Journal List > Cancer Res Treat > v.52(2) > 1154380

Jang and Kim: A Radiosensitivity Gene Signature and PD-L1 Status Predict Clinical Outcome of Patients with Glioblastoma Multiforme in The Cancer Genome Atlas Dataset

Abstract

Purpose

Combination of radiotherapy and immune checkpoint blockade such as programmed death-1 (PD-1) or programmed death-ligand 1 (PD-L1) blockade is being actively tested in clinical trial. We aimed to identify a subset of patients that could potentially benefit from this strategy using The Cancer Genome Atlas (TCGA) dataset for glioblastoma (GBM).

Materials and Methods

A total of 399 cases were clustered into radiosensitive versus radioresistant (RR) groups based on a radiosensitivity gene signature and were also stratified as PD-L1 high versus PD-L1 low groups by expression of CD274 mRNA. Differential and integrated analyses with expression and methylation data were performed. CIBERSORT was used to enumerate the immune repertoire that resulted from transcriptome profiles.

Results

We identified a subset of GBM, PD-L1-high-RR group which showed worse survival compared to others. In PD-L1-high-RR, differentially expressed genes (DEG) were highly enriched for immune response and mapped into activation of phosphoinositide 3-kinase–AKT and mitogen-activated protein kinase (MAPK) signaling pathways. Integration of DEG and differentially methylated region identified that the kinase MAP3K8-involved in T-cell receptor signaling was upregulated and BAI1, a factor which inhibits angiogenesis, was silenced. CIBERSORT showed that a higher infiltration of the immune repertoire, which included M2 macrophages and regulatory T cells.

Conclusion

Taken together, PD-L1-high-RR group could potentially benefit from radiotherapy combined with PD-1/PD-L1 blockade and angiogenesis inhibition.

Introduction

Glioblastoma (GBM) is the most lethal type of human glioma and median survival remains poor following treatment with the current gold standard therapy, which includes maximal surgical resection followed by concurrent chemoradiation and adjuvant temozolomide (TMZ) [1]. Among growing interest in identifying new treatment strategies to improve survival, researchers found that GBM creates an immunosuppressive tumor microenvironment (TME) that facilitates evasion of the host immune system and allows for disease progression. The TME is, in part, a result of angiogenesis and subsequent hypoxia that promote the recruitment and retention of regulatory T cells (Treg) [2,3]. Programmed death-ligand 1 (PD-L1) expression also contributes to the immunosuppressive TME and is the negative prognostic factor for GBM survival [4].
Immunotherapy that targets the programmed death receptor-1 (PD-1) or PD-L1 is an area of active investigation. As a co-inhibitory pathway to T-cell response, PD-1 can bind to PD-L1 that is often expressed on tumor cells, which subsequently downregulates the host immune response. Although pembrolizumab, one of the monoclonal antibodies that blocks PD-1 from binding to PD-L1, yielded unprecedented responses among patients with advanced stage cancers [5], the objective response rate was only 6% to 17%. To improve the response rate, combination with other treatment modalities, including radiation therapy (RT) and angiogenesis inhibitors, are being considered. Also, predictive biomarkers to select for patients that will benefit from immune-based therapy are being explored.
For newly diagnosed GBM, RT is the backbone of standard treatment regimens after maximal surgical resection [1]. RT exerts direct cytotoxic effects on tumors and downregulates immune cells that are sensitive to irradiation, which in turn suppresses the immune response [6]. The concept of radiation-induced tumor equilibrium was recently introduced such that RT might improve the efficacy of immune checkpoint blockade, thereby modulating the immunosuppressive TME towards an anti-tumor TME [7]. In addition, the combination of immunotherapy with an angiogenesis inhibitor could enhance the efficacy of immunotherapeutics because tumor-derived vascular endothelial growth factor A (VEGF-A) has an immunosuppressive function through inhibition of dendritic cell maturation.
In this study, we tested whether the radiosensitivity gene signature [8] and PD-L1 expression level were factors that could predict the clinical outcome of patients receiving RT. We hypothesized that GBM with high PD-L1 expression and radioresistant (RR) was associated with poor survival regarding to RT. Then, we identified a patient subgroup, defined as the PD-L1-high-RR, and characterized the differential expression/methylation pattern of genes and the differential expression of immune cells in the tumor and TME.

Materials and Methods

1. The Cancer Genome Atlas data acquisition

Clinical information from a total of 399 primary GBM patients was collected based on material from previously published research that used The Cancer Genome Atlas (TCGA) lower-grade glioma and GBM cohorts [9] (https://tcga-data.nci.nih.gov/docs/publications/lgggbm_2016/). We used normalized gene expression data from these patients. The detailed normalization process to correct for sample differences is described in the supplementary information of the previous study. In this process, the RALB (RAS Like ProtoOncogene B) gene among the 31 genes was eliminated, and a total of 30 gene signatures were used in the current study. Methylation data was retrieved from the Illumina Human Methylation 450 platform (Illumina, San Diego, CA) and matched into study cohorts using the 'TCGABiolinks' ver. 2.6.9 package [10] of 'R' statistical software (R Foundation for Statistical Computing, Vienna, Austria).

2. Gene signature clustering and PD-L1 grouping

For grouping by PD-L1 status, we determined the cutoff as the median value of CD274 gene expression in the overall study cohort. Patients with CD274 gene expression lower than the cutoff were clustered into the PD-L1-low group, whereas patients with CD274 gene expression higher than the cutoff were clustered into the PD-L1-high group. Previous studies [11,12] used this method to classify the PD-L1-high versus PD-L1-low groups in TCGA cohorts. Specifically, a study [12] that investigated the expression pattern of PD-L1 in 229 glioma samples revealed that patients showing PD-L1 positive expression accounted for 51% of all glioma patients. Thus, our approach that used the median value of CD274 expression among hundreds of patients in the TCGA cohort was acceptable.
For grouping by radiosensitivity, we classified all patients into two groups based on gene signature using consensus clustering (k=2). A total of 1,000 permutation tests, with a subsampling ratio of 0.9, were performed. The optimal number of groups was set to two in order to differentiate the RR and radiosensitive (RS) groups in the current study. Because the reliability of the clustering results and the median values depend on the total number of patients, we performed these grouping processes in the overall cohort, which included RT-treated and non-RT–treated patients. This process is summarized in S1 Fig.
Chi-square tests were used to compare clinical features between the “PD-L1-high-RR” and “others” groups. Clinical information, including baseline characteristics, overall survival (OS) data, and RT information, was obtained from the TCGAbiolinks package [10] in R software. The Kaplan-Meier method was used to compare OS rate between the PD-L1-high-RR and others groups, depending on whether RT had been performed. Cox proportional hazards models were established to identify factors that were significantly associated with the OS for all study cohorts in a univariate analysis. Significant factors were incorporated into multivariable models for RT-treated and non-RT–treated patients to prove the predictive values for receipt of RT. All analyses were performed using ‘R’ ver. 3.3.3 and STATA ver. 14 (StataCorp LP, College Station, TX) statistical software.

3. Transcriptional and epigenetic analysis

Differentially expressed genes (DEGs) for the PD-L1-highRR group were identified using edgeR embedded in the TCGAbiolinks package [10]. We performed this analysis by fitting a negative binomial generalized log-linear model to the read counts for each gene with a threshold to filter genes according to false discovery rate (FDR) cut as 0.05 and log fold change (FC) cut as 1.0. To understand the underlying biological process, gene set enrichment analysis (GSEA) was performed for the PD-L1-high-RR group to identify significant canonical pathways overrepresented by the DEGs. DEGs were mapped into the Kyoto Encyclopedia of Genes and Genomes (KEGG) pathways, and their corresponding pathways were visualized.
The concept of transcriptional deconvolution of immune cells in tissue samples has been recently introduced. Regarding immune cell infiltration into the TME, a bioinformatics tool that uses gene signature, termed as CIBERSORT, has been developed and validated to predict the immune cell repertoire [13]. In the present study, the proportion of immune cells was enumerated by 'CIBERSORT' for each tumor sample within the PD-L1-high-RR and others groups. The mean proportion of various immune cells in each group was calculated and compared between the two groups.
We performed the entire process of 1,000 permutations and filtered samples that had p < 0.05. Furthermore, quanTIseq [14], which is a deconvolution tool that can quantify ten immune cell types from bulky RNA sequencing data, was used to support CIBERSORT results. Differentially methylated genes (DMRs) were searched for identifying functional regions that are involved in regulating gene expression. The beta-values between two groups were calculated, and the p-values were estimated with the Wilcoxon test adjusted by the Benjamin-Hochberg method. The minimum absolute value for delta beta-values was set to 0.2 and the FDR-adjusted Wilcoxon rank-sum p-value was set to 0.01 for detecting differences. Identified DMRs and DEGs were joined and plotted in the form of a starburst plot. Log10 values (FDR-corrected p-value) for each gene for DNA methylation and expression were used to identify which genes are epigenetically regulated in the PD-L1-high-RR group. All transcriptional and epigenetic analysis was performed using packages from TCGAbiolinks [10].

4. Ethical statement

Current study does not require the Institutional Review Board to review and approve this agreement because we used and analyzed publicly available dataset.

Results

1. Exploring the PD-L1-high-RR group

In total, 284 patients (28.8%) received RT and 115 patients (71.2%) did not. After we defined the PD-L1-high versus PD-L1-low and RR versus RS, we could obtain combinatorial four subgroups: PD-L1-low-RS, PD-L1-low-RR, PD-L1-high-RS, and PD-L1-high-RR. Significant difference in OS among those four subgroups was observed when RT was given (p=0.002) (Fig. 1A), however, this difference disappeared when RT was not given (p=0.895) (Fig. 1B). To test our hypothesis, we re-grouped initial four combinatorial groups into simply two groups: the PD-L1-high-RR (PD-L1-high-RR) versus the rest of other groups (others). Afterward, log-rank test revealed that OS was significantly different between the PD-L1-high-RR and others groups when those patients were primarily treated with RT (p=0.008) (Fig. 1C). However, this difference was not observed when RT was not given (p=0.572) (Fig. 1D). Thus, we performed following analyses in current study, comparing the PD-L1-high-RR and others groups.

2. Patient characteristics

Baseline characteristics from the PD-L1-high-RR and others group are summarized in Table 1. There were no significant differences in age, sex, race, and Karnofsky Performance Scale (KPS) between the two groups. In 2008, a study [15] characterized four transcriptional subgroups in GBM: proneural, neural, classical, and mesenchymal. Generally, the proneural type of GBM shows a survival benefit compared to the mesenchymal type. In the current study, the proneural type was found less in the PD-L1-high-RR group than in others group (4.2% vs. 25.4%, p < 0.001). Furthermore, molecular characteristics were significantly different between the two groups. Isocitrate dehydrogenase (IDH)–wild types were more observed in the PD-L1-high-RR compared to others group (81.5% vs. 69.3%, p=0.004). However, there is no significant difference in 1p19q non-codeletion status between the PD-L1-high-RR and the others groups (p=0.353). GBM with a methylated O6-methylguanine-DNA methyltransferase (MGMT) promoter was identified more in other groups than the PD-L1-high-RR group (33.2% vs. 21.8%, p=0.002).

3. Predictive value of radiosensitivity and programmed death-ligand 1 for RT

For all patients, the following factors were associated with OS (Table 2): age, sex, race, KPS, IDH mutational status, 1p19q codeletion status, MGMT promoter status, transcriptome subtype, Estimation of STromal and Immune cells in MAlignant Tumours using Expression data (ESTIMATE) immune score [16], and membership in the PD-L1-high-RR group.
We next investigated whether membership in the “PD-L1- high-RR” group was an independent predictive factor when RT had been performed. A multivariate Cox model for RTtreated patients revealed that membership in the PD-L1- high-RR group (hazard ratio [HR], 1.70; 95% confidence interval [CI], 1.03 to 2.81; p=0.037), IDH-wild type of tumor (HR, 2.91; 95% CI, 1.24 to 6.81; p < 0.001), and male (HR, 1.71; 95% CI, 1.21 to 2.62; p < 0.001) were independently associated with inferior GBM survival. Conversely, membership in the PD-L1-high-RR group was not associated with OS for nonRT-treated patients. Collectively, these results suggested that radiosensitivity gene signature and PD-L1 status were potential predictive factors for survival of GBM patients who receive RT.

4. Differentially expressed and differentially methylated genes

Thirty-gene expression profiles according to the PD-L1- high-RR and the others groups are represented in a heatmap (Fig. 2A), showing the different pattern of transcriptomic profile between them. A total of 200 DEGs were identified between the PD-L1-high-RR and others group. All DEGs, log FC, and FDR are listed in S2 Table. Of these DEGs, the number of downregulated and upregulated genes in the PD-L1-high-RR group was 37 (18.5%) and 163 (81.5%), respectively. With respect to the biologic process, GSEA with these DEGs revealed that upregulated genes in the PD-L1-high-RR group were associated with the immune (common genes, n=19; FDR=1.01e-08) and inflammatory responses (common genes, n=11; FDR=6.55e-05), as shown in Fig. 2B. Furthermore, triggering receptor expressed on myeloid cells 1 (TREM1) signaling (common genes, n=8; FDR=1.97e-06) and pathways involved with chronic inflammation, multiple sclerosis granulocyte, rheumatoid arthritis, were enriched in the PD-L1-high-RR group (Fig. 2C). Other biologic process and pathways enriched in the PD-L1-high-RR are listed in S3 Table.
A total of 1,855 DMRs were identified with 1,604 hypermethylated CpG sites (86.5%) and 251 hypomethylated sites (13.5%) in the “PD-L1-high-RR” group. To investigate the epigenetically down or upregulated genes, we constructed a starburst plot showing significant genes with corrected FDR values (Fig. 2D). Gene names are shown in Fig. 2D when they were matched to available methylation probes in TCGA dataset. Detail information including full list of those gene symbol, methylation probeID, difference of methylation beta-value, log FC, FDRs for differential expression/methylation, the status of expression/methylation in the PD-L1-high-RR group are presented in S4 Table. An epigenetically downregulated gene was BAI1 (Brain-specific Angiogenesis Inhibitor 1) (log FC=–0.332, FDR-adjusted p=0.001), while an epigenetically upregulated gene was MAP3K8 (also known as COT or TPL2) (log FC=0.406, p=0.001). In terms of MAP3K8, T-cell receptor signaling and mitogen-activated protein kinase signaling pathways were retrieved from the KEGG pathway database, and DEGs were mapped and visualized in S5A and S5B Fig., respectively. In the PD-L1-high-RR group, MAP3K8 genes were upregulated in both pathways.

5. Deconvolution of immune cells in the PD-L1-high-RR tumor samples

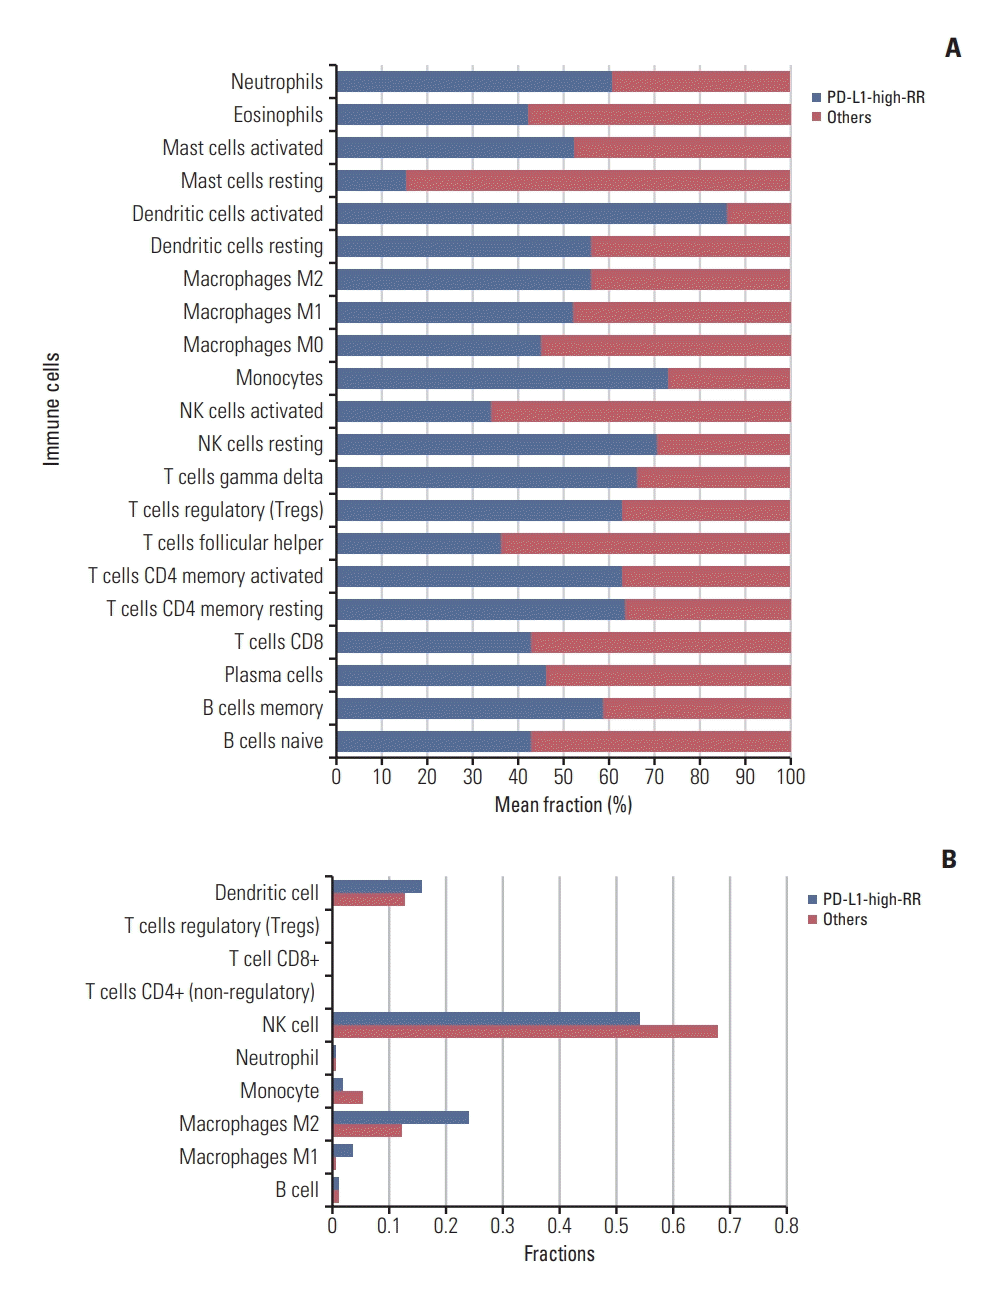
Transcriptional deconvolution of immune cells using CIB-ERSORT were performed in the PD-L1-high-RR and others groups, respectively. With statistically significant samples using Monte Carlo sampling for the deconvolution (p < 0.05), relative percentages of mean fraction of each immune cell are represented in Fig. 3A and listed in S6 Table. M2 type macrophages and Treg cells in tumors were more common for the PD-L1-high-RR group than others group (53.5% vs. 46.5% and 58.9% vs. 41.1%, respectively). On the other hand, the proportion of CD8 T cells was lower in the PD-L1-high-RR than the others group (40.1% vs. 59.8%). Furthermore, we performed deconvolution process using by quanTIseq, showing that M2 type macrophage was more observed in PD-L1-high-RR group compared with the others group (normalized fraction 24.0% vs. 12.1%) (Fig. 3B). However, Treg and CD8 T cells were not detected by quanTiseq. Furthermore, we performed deconvolution analyses in each four subgroup: PD-L1-high-RR, PD-L1-high-RS, PD-L1-low-RR, and PD-L1-low-RS. Detail fractions of immune cells according to four groups are shown in S7 Fig.

Discussion

We showed that the PD-L1-high-RR is a predictor of inferior OS for GBM patients who receive RT. DEGs in this group were associated with an immune response that constitutes an immunosuppressive TME. Epigenetically regulated genes were related to angiogenesis and key oncogenic survival pathways. Also, immune cells representing the immunosuppressive TME were more enumerated with transcriptome analysis in the PD-L1-high-RR tumor samples compared to other tumor samples.
Higher PD-L1 expression was found to be an adverse prognostic factor for OS and the level of expression significantly correlated with the histologic grade of glioma [4]. A study with 976 glioma samples [17] revealed that a high PD-L1 expression level, as measured by immunohistochemistry, was correlated with immune responses, including T-cell activation and macrophage-related response. Compared to lower grade glioma, GBM showed an up-regulation of PD-L1 and a correlation with angiogenesis, suggesting a relationship between PD-L1 and malignancy. To date, there is no research to analyze clinical outcome in GBM patients with regards to the concept of PD-L1 expression, radiosensitivity, and their associated genomic profiles. Here, we showed that PD-L1 status and radiosensitivity could predict OS in GBM patients who received RT, and we correlated the immuno-suppressive microenvironment in the PD-L1-high-RR group with poor clinical outcome.
This conclusion was supported by the results of GSEA. TREM1 signaling was enriched in the PD-L1-high-RR group of current study. A previous TCGA-GBM cohort study [18] noted that high TREM1 expression was associated with shorter OS, and TREM1 expression was more found in the mesenchymal subtype. Furthermore, genes related to inflammatory and immune responses were differentially expressed in the PD-L1-high-RR group. This is consistent with other studies that reported enrichment of proinflammatory genes within the immunosuppressive mesenchymal subtype of GBM [19]. TCGA-GBM cohort analysis using mRNA sequencing data [20] revealed that immune infiltration, dominantly infiltrated by the tumor-associated macrophages (TAMs) and/or myeloid-derived suppressor cells (MDSCs), was associated with a poor clinical outcome. In the current study, the TME of the PD-L1-high-RR group had more M2 type macrophages, more Treg cells, and less CD8 T cells as compared with the other group. Thus, the immunosuppressive TME resulted from the immune repertoire of the PD-L1-high-RR group could potentially lead to tumor growth and poor OS.

Results

of epigenetic analysis also supported the existence of an immunosuppressive TME in the PD-L1-high-RR group. A variety of methylation-regulated genes related to tumor suppression, apoptosis, sensitivity to chemotherapy, and progression in GBM were found as novel targets [21]. In current study, hypomethylation-upregulated MAP3K8 and hypermethylation-downregulated BAI1 genes were identified in the PD-L1-high-RR group. In GBM, MAP3K8, as one of phosphoinositide 3-kinase pathway cluster genes, is linked with a hazard effect on survival in univariate analysis [22]. BAI1, an inhibitor of angiogenesis, was epigenetically down-regulated in the PD-L1-high-RR group. Angiogenesis is promoted as a consequence of downregulation of BAI1 which expression is epigenetically silenced in glioma [23]. In accord with these results, methylation status and expression level of BAI1 and MAP3K8 potentially contribute to the inferior OS in the PD-L1-high-RR.
GBM is regarded as immunologically cold tumors because its TME impedes infiltrating, proliferating, and activating of effector immune cells by various conditions including eminence of Treg and MDSCs, and hypoxia [24]. Overcoming these conditions is prerequisite for the good response to immunotherapy. One of attempts to reverse cold tumors into hot tumors is combination of immunotherapy and other anticancer treatments such as RT or VEGF inhibitor [25]. Given the correlation between BAI1 and VEGF [26], we speculate that a VEGF inhibitor could be beneficial in the treatment of the PD-L1-high-RR group. Angiogenesis results in the recruitment of immune-suppressive cells, such as M2 type TAMs, MDSCs, or Treg cells. Also, hypoxia-inducible factors such as hypoxia-inducible factor-1α, VEGF-A, or interleukin-10 can induce upregulation of PD-L1 [27]. Thus, control of tumor vasculature with an angiogenesis inhibitor might have a synergistic effect with immune checkpoint blockades [28]. Consequently, clinical trials to test combinational strategies that use an immune checkpoint blockade and an angiogenesis inhibitor are ongoing. For the treatment of recurrent GBM, a phase II trial of pembrolizumab in combination with bevacizumab (NCT-02337491) is underway. Preliminary results suggest that there is no dose limiting toxicity. Another ongoing phase II study is evaluating the efficacy of combination treatment of durvalumab with RT or bevacizumab relative to treatment with durvalumab alone in GBM (NCT02336165). Interim analysis suggested that durvalumab alone shows activity; however, this arm of the study was closed because prolonged OS was not shown.
Cumulating evidences indicate that irradiation can augment innate and adaptive immune response against tumors, thereby potentiating the radiation response. RT can induce an inflammatory microenvironment in the context of immunogenic cell death that is characterized by the release of tumor antigen and danger-associated molecular patterns, which in turn increases the production of proinflammatory cytokines and chemokines [7]. For example, Zeng et al. [29] reported the increased tumor-infiltrated cytotoxic T cells and Treg-induced decreased tumor-inflammation when stereotactic RT and anti–PD-1 blockade were applied to immunecompetent orthotopic murine glioma model. Based on these understandings, several clinical trials are ongoing in patients with GBM. A phase II study (NCT02667587) is currently comparing the combination of RT plus TMZ with nivolumab or placebo in primary GBM patients. A phase I study [30] testing the combination of pembrolizumab, bevacizumab, and hypofractionated RT (30 Gy/5 fractions) in recurrent GBM patients reported that this treatment strategy demonstrated acceptable toxicity. The rate of a durable response was 53%, and 1-year OS was 64%. Based on these results, we speculate that the PD-L1-high-RR group identified in this study may benefit from anti-PD-1/PD-L1 blockade and RT.
There are several limitations to the current study. First, since this was a retrospective study using TCGA cohorts, we sought to analyze the OS data. Given that GBM progresses locally in most patients, analyzing the local, and progression-free survival is also important to solidify the predictive value of the radiosensitivity and PD-L1 status. Nevertheless, we prioritized analyzing the OS over recurrence/progressionfree survival due to the potential bias that arises from variation and limitation with regards to follow-up information in the TCGA database. Regarding recurrences, further prospective studies are needed. Second, quantifying the degree of the radiosensitivity for each patient is difficult. Yet, classification of the PD-L1-high-RR and the others group is intuitive and can serve as a cornerstone for precision medicine. The research described here can form the basis for additional studies characterizing the factors predictive of RT and immunotherapy response.
In conclusion, we validated the predictive value of radio-sensitivity and PD-L1 status, and we identified the PD-L1- high-RR group, which showed a worse outcome following RT in TCGA-GBM dataset. This group demonstrated RT resistance and the immunosuppressive TME through a variety of mechanisms, suggesting that this group could potentially benefit from RT combined with PD-L1 blockade and angiogenesis inhibitor.

Electronic Supplementary Material

Supplementary materials are available at Cancer Research and Treatment website (https://www.e-crt.org).
S1 Fig.
Schematic representation of patient grouping in current study. Definition process about RS vs. RR groups and programmed death-ligand 1 (PD-L1)–high vs. PD-L1-low groups.
crt-2019-440-suppl1.pdf
S2 Table.
Detail list of differentially expressed genes between PD-L1–high and others groups
crt-2019-440-suppl2.pdf
S3 Table.
Results of Gene Set Enrichment Analysis with differentially expressed genes between PD-L1–high and others groups
crt-2019-440-suppl3.pdf
S4 Table.
Detail results of combined differentially expressed/methylated genes
crt-2019-440-suppl4.pdf
S5 Fig.
Visualization of differentially expressed genes in the “PD-L1-high-RR” group using the Kyoto Encyclopedia of Genes and Genomes (KEGG) database. PD-L1, programmed death-ligand 1; RR, radioresistant.
crt-2019-440-suppl5.pdf
S6 Table.
Results of CIBERSORT and quanTIseq in tabular form
crt-2019-440-suppl6.pdf
S7 Fig.
CIBERSORT result according to each four subgroups. NK, natural killer; PD-L1, programmed death-ligand 1; RR, radioresistant; RS, radiosensitive.
crt-2019-440-suppl7.pdf

Notes

Conflict of interest relevant to this article was not reported.

ACKNOWLEDGMENTS

This work was supported by a grant from the Ministry of Science and Information & Communication Technology (NRF#2017R1A2B4002710 & NRF#2017M2A2A7A01018438) and SNUBH Research Fund (#18-2018-001).

References

1. Ostrom QT, Gittleman H, Xu J, Kromer C, Wolinsky Y, Kruchko C, et al. CBTRUS statistical report: primary brain and other central nervous system tumors diagnosed in the United States in 2009-2013. Neuro Oncol. 2016; 18(Suppl 5):v1–75.
crossref
2. Crane CA, Ahn BJ, Han SJ, Parsa AT. Soluble factors secreted by glioblastoma cell lines facilitate recruitment, survival, and expansion of regulatory T cells: implications for immunotherapy. Neuro Oncol. 2012; 14:584–95.
crossref
3. Huang Y, Goel S, Duda DG, Fukumura D, Jain RK. Vascular normalization as an emerging strategy to enhance cancer immunotherapy. Cancer Res. 2013; 73:2943–8.
crossref
4. Nduom EK, Wei J, Yaghi NK, Huang N, Kong LY, Gabrusiewicz K, et al. PD-L1 expression and prognostic impact in glioblastoma. Neuro Oncol. 2016; 18:195–205.
crossref
5. Topalian SL, Hodi FS, Brahmer JR, Gettinger SN, Smith DC, McDermott DF, et al. Safety, activity, and immune correlates of anti-PD-1 antibody in cancer. N Engl J Med. 2012; 366:2443–54.
crossref
6. Grossman SA, Ye X, Lesser G, Sloan A, Carraway H, Desideri S, et al. Immunosuppression in patients with high-grade gliomas treated with radiation and temozolomide. Clin Cancer Res. 2011; 17:5473–80.
crossref
7. Weichselbaum RR, Liang H, Deng L, Fu YX. Radiotherapy and immunotherapy: a beneficial liaison? Nat Rev Clin Oncol. 2017; 14:365–79.
crossref
8. Kim HS, Kim SC, Kim SJ, Park CH, Jeung HC, Kim YB, et al. Identification of a radiosensitivity signature using integrative metaanalysis of published microarray data for NCI-60 cancer cells. BMC Genomics. 2012; 13:348.
crossref
9. Ceccarelli M, Barthel FP, Malta TM, Sabedot TS, Salama SR, Murray BA, et al. Molecular profiling reveals biologically discrete subsets and pathways of progression in diffuse glioma. Cell. 2016; 164:550–63.
10. Colaprico A, Silva TC, Olsen C, Garofano L, Cava C, Garolini D, et al. TCGAbiolinks: an R/Bioconductor package for integrative analysis of TCGA data. Nucleic Acids Res. 2016; 44:e71.
crossref
11. Jang BS, Kim IA. A radiosensitivity gene signature and PD-L1 status predict clinical outcome of patients with invasive breast carcinoma in The Cancer Genome Atlas (TCGA) dataset. Radiother Oncol. 2017; 124:403–10.
crossref
12. Webb JR, Milne K, Kroeger DR, Nelson BH. PD-L1 expression is associated with tumor-infiltrating T cells and favorable prognosis in high-grade serous ovarian cancer. Gynecol Oncol. 2016; 141:293–302.
crossref
13. Newman AM, Liu CL, Green MR, Gentles AJ, Feng W, Xu Y, et al. Robust enumeration of cell subsets from tissue expression profiles. Nat Methods. 2015; 12:453–7.
crossref
14. Finotello F, Mayer C, Plattner C, Laschober G, Rieder D, Hackl H, et al. Molecular and pharmacological modulators of the tumor immune contexture revealed by deconvolution of RNAseq data. Genome Med. 2019; 11:34.
crossref
15. Cancer Genome Atlas Research Network. Comprehensive genomic characterization defines human glioblastoma genes and core pathways. Nature. 2008; 455:1061–8.
16. Yoshihara K, Shahmoradgoli M, Martinez E, Vegesna R, Kim H, Torres-Garcia W, et al. Inferring tumour purity and stromal and immune cell admixture from expression data. Nat Commun. 2013; 4:2612.
crossref
17. Wang Z, Zhang C, Liu X, Wang Z, Sun L, Li G, et al. Molecular and clinical characterization of PD-L1 expression at transcriptional level via 976 samples of brain glioma. Oncoimmunology. 2016; 5:e1196310.
crossref
18. Szulzewsky F. Investigating the properties of glioma-associated microglia/macrophages [dissertation]. Berlin: Free University of Berlin Institute of Pharmacy;2015.
19. Doucette T, Rao G, Rao A, Shen L, Aldape K, Wei J, et al. Immune heterogeneity of glioblastoma subtypes: extrapolation from the cancer genome atlas. Cancer Immunol Res. 2013; 1:112–22.
crossref
20. Iglesia MD, Parker JS, Hoadley KA, Serody JS, Perou CM, Vincent BG. Genomic analysis of immune cell infiltrates across 11 tumor types. J Natl Cancer Inst. 2016; 108:djw144.
crossref
21. Martinez R, Esteller M. The DNA methylome of glioblastoma multiforme. Neurobiol Dis. 2010; 39:40–6.
crossref
22. Ruano Y, Mollejo M, Camacho FI, Rodriguez de Lope A, Fiano C, Ribalta T, et al. Identification of survival-related genes of the phosphatidylinositol 3'-kinase signaling pathway in glioblastoma multiforme. Cancer. 2008; 112:1575–84.
crossref
23. Zhu D, Hunter SB, Vertino PM, Van Meir EG. Overexpression of MBD2 in glioblastoma maintains epigenetic silencing and inhibits the antiangiogenic function of the tumor suppressor gene BAI1. Cancer Res. 2011; 71:5859–70.
24. Wei J, Wu A, Kong LY, Wang Y, Fuller G, Fokt I, et al. Hypoxia potentiates glioma-mediated immunosuppression. PLoS One. 2011; 6:e16195.
crossref
25. Platten M, Reardon DA. Concepts for immunotherapies in gliomas. Semin Neurol. 2018; 38:62–72.
crossref
26. Wang W, Da R, Wang M, Wang T, Qi L, Jiang H, et al. Expression of brain-specific angiogenesis inhibitor 1 is inversely correlated with pathological grade, angiogenesis and peritumoral brain edema in human astrocytomas. Oncol Lett. 2013; 5:1513–8.
crossref
27. Hendry SA, Farnsworth RH, Solomon B, Achen MG, Stacker SA, Fox SB. The role of the tumor vasculature in the host immune response: implications for therapeutic strategies targeting the tumor microenvironment. Front Immunol. 2016; 7:621.
crossref
28. Ramjiawan RR, Griffioen AW, Duda DG. Anti-angiogenesis for cancer revisited: is there a role for combinations with immunotherapy? Angiogenesis. 2017; 20:185–204.
crossref
29. Zeng J, See AP, Phallen J, Jackson CM, Belcaid Z, Ruzevick J, et al. Anti-PD-1 blockade and stereotactic radiation produce long-term survival in mice with intracranial gliomas. Int J Radiat Oncol Biol Phys. 2013; 86:343–9.
crossref
30. Sahebjam S, Forsyth P, Arrington J, Jaglal M, Tran ND, Etame AB, et al. Atim-18. A phase I trial of hypofractionated stereotactic irradiation (hfsrt) with pembrolizumab and bevacizumab in patients with recurrent high grade glioma (nct0231-3272). Neuro-Oncology. 2017; 19(Suppl 6):vi30.
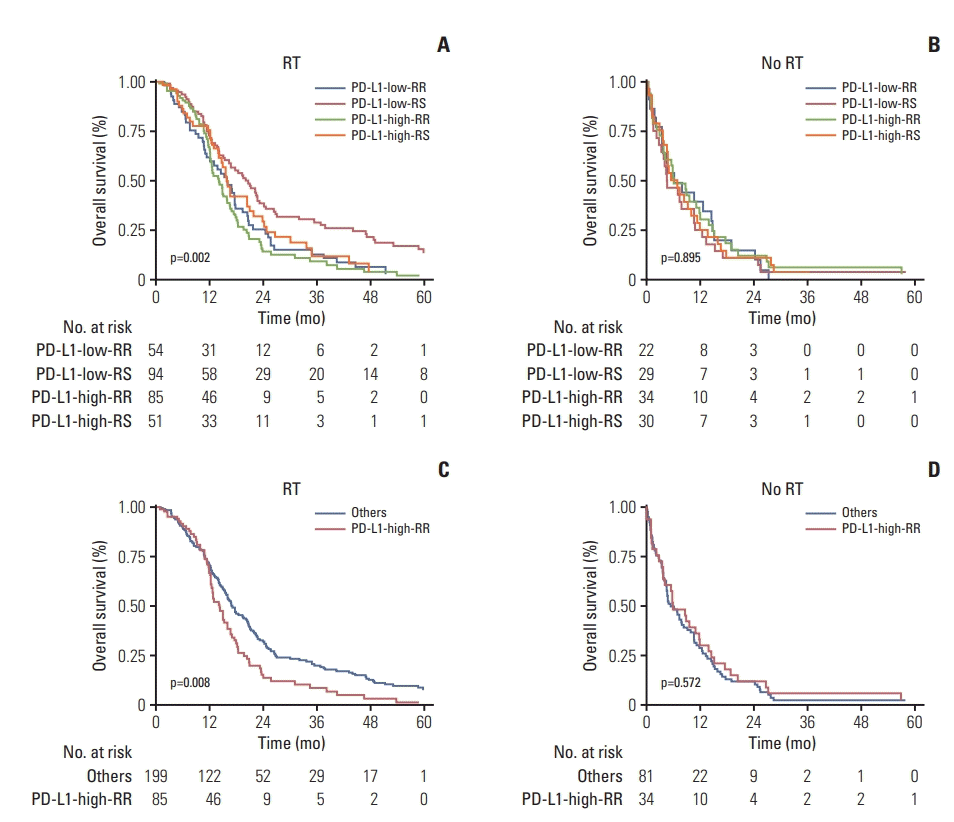
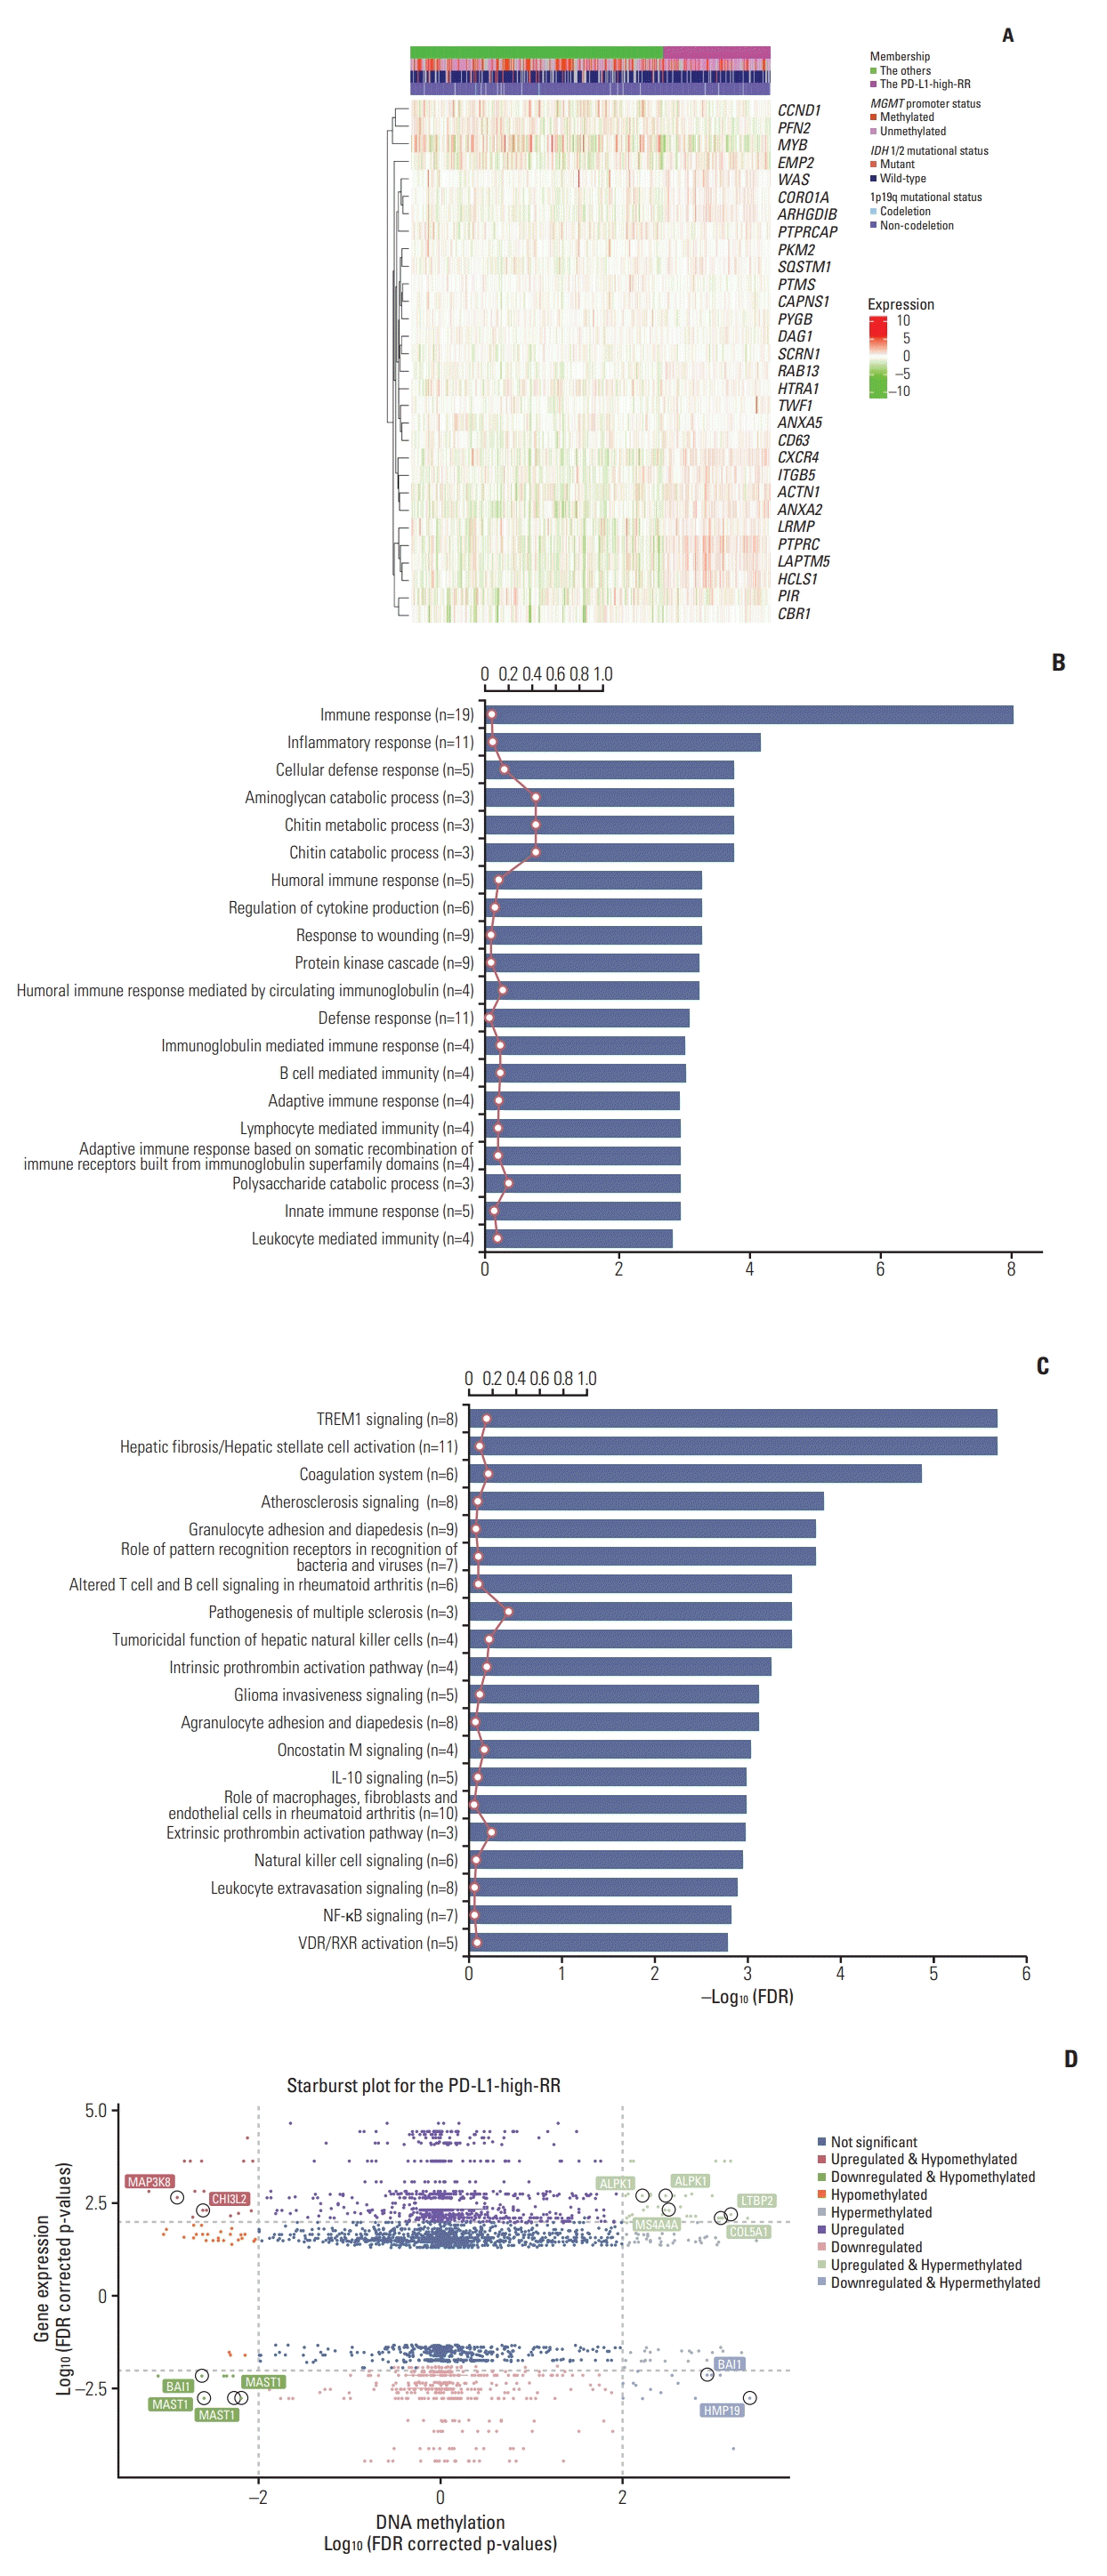
Fig. 1.
Kaplan-Meier curves for overall survival among four combinatorial groups in RT-treated patients (A) and in no RTtreated ones (B). To test our hypothesis, four combinatorial groups were re-grouped into two groups (PD-L1-high-RR vs. others). Again, Kaplan-Meier curves for overall survival comparing two groups are depicted in RT-treated patients (C) and no RT-treated ones (D), respectively. p-value was estimated by the log-rank test. RT, radiation therapy; PD-L1, programmed death-ligand 1; RR, radioresistant; RS, radiosensitive.
crt-2019-440f1.tif
Fig. 2.
(A) Heatmap comparing the mean fraction of immune cells between the samples in the PD-L1-high-RR and the others groups, showing the differential 30 gene expression pattern. Rows list each of the 30 genes, and columns show each sample. The expression level was normalized between –10 and 10, represented by the colors (green to red). Gene set enrichment analysis and the relationship between differentially expressed genes and methylation-regulated genes. The top 20 enriched biologic processes (B) and pathways (C) are shown. The x-axis indicates a–log10 FDR, the red line represents the ratio of genes in that pathway, and the number in parenthesis is the number of common genes in that pathway. In the starburst plot (D), log10 (FDR-corrected p-value) is plotted for DNA methylation (x axis) and gene expression (y axis). The degree of change (log2 multiple) is indicated by color (red and green). RT, radiation therapy; PD-L1, programmed death-ligand 1; RR, radioresistant; MGMT, O6 -methylguanine-DNA methyltransferase; IDH, isocitrate dehydrogenase; FDR, false discovery rate.
crt-2019-440f2.tif
Fig. 3.
In the starburst plot (D), log10 (FDR-corrected p-value) is plotted for DNA methylation (x axis) and gene expression (y axis). The degree of change (log2 multiple) is indicated by color (red and green). RT, radiation therapy; PD-L1, programmed death-ligand 1; RR, radioresistant; MGMT, O6 -methylguanine-DNA methyltransferase; IDH, isocitrate dehydrogenase; FDR, false discovery rate. (A) From CIBERSORT, the normalized mean fraction of each of the immune cells found within samples in the PD-L1-high-RR and the others groups are demonstrated in the bar plot. (B) Results from the another deconvolutional tool, quanTIseq, are presented in bar graphs indicating the relative normalized mean fraction of immune cells between the PD-L1-high-RR and others groups. PD-L1, programmed death-ligand 1; RR, radioresistant.
crt-2019-440f3.tif
Table 1.
Patient characteristics
Variable Others (n=280) PD-L1-high-RR (n=119) Total (n=399) p-value
Age (yr)
 ≤ 70 218 (77.9) 103 (86.6) 321 (80.5) 0.067
 > 70 59 (21.1) 16 (13.4) 75 (18.8)
 N/A 3 (1.1) 0 3 (0.8)
Sex
 Female 112 (40) 39 (32.8) 151 (37.8) 0.150
 Male 165 (58.9) 80 (67.2) 245 (61.4)
 N/A 3 (1.1) 0 3 (0.8)
Race
 Caucasian 243 (86.8) 101 (84.9) 344 (86.2) 0.921
 African American 16 (5.7) 9 (7.6) 25 (6.3)
 Asian 7 (2.5) 3 (2.5) 10 (2.5)
 N/A 14 (5.0) 6 (5.0) 20 (5.0)
Karnofsky Performance Scale
 40-80 178 (63.6) 70 (58.8) 248 (62.2) 0.736
 90-100 34 (12.1) 15 (12.6) 49 (12.3)
 N/A 68 (24.3) 34 (28.6) 102 (25.6)
IDH mutation status
 Mutant 22 (7.9) 1 (0.8) 23 (5.8) 0.004
 WT 194 (69.3) 97 (81.5) 291 (72.9)
 N/A 64 (22.9) 21 (17.6) 85 (21.3)
1p/19q codeletion status
 Codeletion 2 (0.7) 0 2 (0.5) 0.353
 Non-codeletion 266 (95.0) 115 (96.6) 381 (95.5)
 N/A 12 (4.3) 4 (3.4) 16 (4.0)
MGMT promoter status
 Methylated 93 (33.2) 26 (21.8) 119 (29.8) 0.002
 Unmethylated 93 (33.2) 61 (51.3) 154 (38.6)
 N/A 94 (33.6) 32 (26.9) 126 (31.6)
Transcriptome subtype
 Classical 86 (30.7) 22 (18.5) 108 (27.1) < 0.001
 Mesenchymal 48 (17.1) 72 (60.5) 120 (30.1)
 Neural 33 (11.8) 8 (6.7) 41 (10.3)
 Proneural 71 (25.4) 5 (4.2) 76 (19.0)
 N/A 42 (15.0) 12 (10.1) 54 (13.5)
ESTIMATE immune score group
 Low 40 (14.3) 9 (7.6) 49 (12.3) < 0.001
 High 20 (7.1) 28 (23.5) 48 (12.0)
 N/A 220 (78.6) 82 (68.9) 302 (75.7)
Radiotherapy
 No 81 (28.9) 34 (28.6) 115 (28.8) 0.943
 Yes 199 (71.1) 85 (71.4) 284 (71.2)
Total 280 (100) 119 (100) 399 (100)

PD-L1, programmed death-ligand 1; RR, radioresistant; N/A, not available; IDH, isocitrate dehydrogenase; WT, wild type; MGMT, O6-methylguanine-DNA methyltransferase.

Table 2.
Univariate analysis and multivariate models for overall survival in RT-treated and non-RT–treated patients
Characteristic Univariate (All, n=399)
Multivariate (No RT, n=115)
Multivariate (RT, n=284)
HR 95% CI p-value HR 95% CI p-value HR 95% CI p-value
Age (yr)
 ≤ 70 1.00 1.00 1.00
 > 70 2.19 1.65-2.90 < 0.001 1.54 0.76-3.10 0.228 1.74 0.93-3.26 0.083
Sex
 Female 1.00 1.00
 Male 1.31 1.05-1.65 0.017 1.92 0.93-3.94 0.077 1.71 1.12-2.63 0.014
Race
 Caucasian 1.00
 African American 0.68 0.42-1.10 0.117
 Asian 0.61 0.29-1.30 0.202
KPS
 40-80 1.00
 90-100 0.72 0.51-1.02 0.066
IDH mutational status
 Mutant 1.00 1.00
 WT 2.97 1.77-5.01 < 0.001 1.00 Omitted 2.75 1.17-6.49 0.020
1p19q codeletion status
 Codeletion 1.00 1.00
 Non-codeletion 4.58 1.11-18.88 0.035 1.00 Omitted 1.90 0.23-15.71 0.550
MGMT promoter status
 Methylated 1.00 1.00
 Unmethylated 1.42 1.07-1.86 0.013 0.83 0.41-1.71 0.620 1.23 0.81-1.88 0.330
Transcriptome subtype
 Classical 1.00 1.00
 Mesenchymal 1.23 0.92-1.63 0.157 0.95 0.43-2.08 0.897 1.01 0.58-1.75 0.984
 Neural 1.27 0.87-1.85 0.216 0.00 0.11-1.40 0.151 1.69 0.90-3.20 0.105
 Proneural 0.67 0.48-0.92 0.015 0.48 0.00-3.74 0.573 1.04 0.55-1.94 0.914
ESTIMATE immune score
 Low 1.00
 High 1.13 0.72-1.78 0.591
PD-L1 status and radiosensitivity
 The others 1.00
 The PD-L1-high-RR 1.21 0.96-1.53 0.113 1.06 0.52-2.14 0.880 1.77 1.06-2.93 0.028

RT, radiation therapy; HR, hazard ratio; CI, confidence interval; KPS, Karnofsky Performance Scale; IDH, isocitrate dehydrogenase; MGMT, O6-methylguanine-DNA methyltransferase; ESTIMATE, Estimation of Stromal and Immune cells in MAlignant Tumours using Expression Data; PD-L1, programmed death-ligand 1; RR, radioresistant.

TOOLS
Similar articles