

 PDF
PDF Citation
 Print
Print


INTRODUCTION
The metabolic syndrome (MetS) is a cluster of conditions that synergistically enhances the risk of type 2 diabetes, cardiovascular disease, and even mortality [12]. The components of MetS include abdominal obesity, impaired glucose metabolism, dyslipidemia, and hypertension. Insulin resistance is considered crucial in the pathophysiology of MetS [2].
Botanicals often contain diverse collections of biologically active compounds with multiple mechanisms of action, which may serve as effective agents in the treatment or prevention of metabolic disorders [3]. More than 1,200 different plants have been reported in the treatment of diabetes, hypertension and dyslipidemia, which are risk factors associated with MetS [456]. Dendropanax morbifera belongs to the family Araliaceae. It is an endemic subtropical evergreen tree which grows in the southwestern province of Korea and Jeju island [7]. The extract from different parts of the plant contains various biologically active materials, including polyphenol and polyacetylene compounds. These compounds exhibit diverse therapeutic potentials [89].
Dendropanoxide, which is extracted from the leaves of D. morbifera, significantly lowered the serum glucose level in streptozotocin (STZ)-induced diabetic rats [10]. Eight weeks of treatment with D. morbifera effectively reduced the total fat mass (including subcutaneous, mesenteric, and epididymal) in high fat-fed mice compared to that of untreated high-fat fed mice [11]. D. morbifera essential oil dose-dependently reduced the total cholesterol, low-density lipoprotein-cholesterol (LDL-C) levels, and triglycerides (TGs), while it significantly increased the high-density lipoprotein-cholesterol (HDL-C) levels in male rats [12]. In addition, D. morbifera extract lowers blood pressure (BP) [13], ameliorates hepatic fibrosis [14], and increases anti-oxidant/anti-inflammatory activities in animal models [1516]. Until now, the favourable metabolic effects of D. morbifera have only been reported in animal studies. Therefore, we investigated the efficacy and safety of D. morbifera leaf extract for improving metabolic disarrangements in humans.
SUBJECTS AND METHODS
Study design and participants
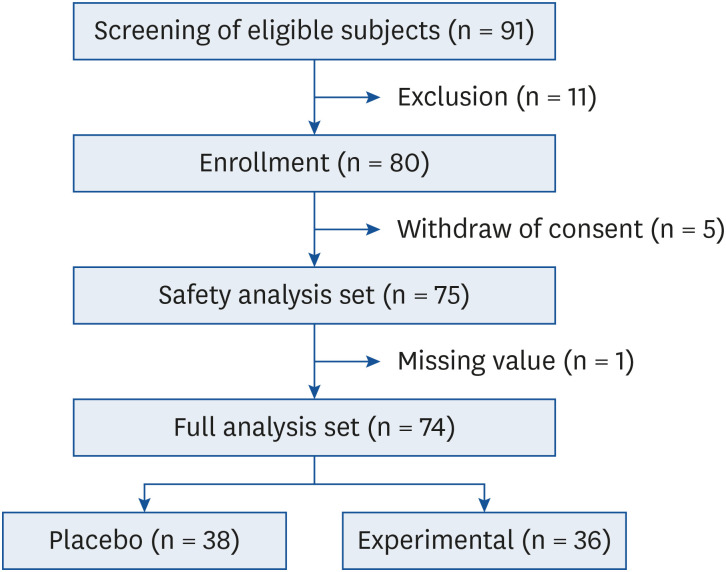
The design of this study was a 12-week, double-blind, placebo-controlled and randomized clinical trial conducted between July 2018 and April 2019 at Kyung Hee University Hospital at Gangdong, Seoul, Korea. Potential subjects were screened for eligibility during visit 1 (week −3 to −1). Non-diabetic adults aged 21–70 years were enrolled in this study. The exclusion criteria were as follows: 1) type 2 diabetes based on the criteria of American Diabetes Association [17]; 2) high aspartate and alanine aminotransferases levels (aspartate aminotransferase [AST] or alanine aminotransferase [ALT] over 3 times the upper limit of normal); 3) serum creatinine levels over 1.5 mg/dL; 4) individuals who had taken medication for obesity, anti-diabetic medications, lipid-lowering drugs or corticosteroids within the preceding 3 months; 5) individuals diagnosed with hyperthyroidism or hypothyroidism, except for subclinical hypothyroidism with thyroid-stimulating hormone < 10 mIU/L; 6) subjects with serious illnesses (e.g., heart disease, psychiatric disease, and cancer); and 7) drug abusers. Finally, a total of 74 subjects were included in the full analysis set, and 75 were included in the safety set (Fig. 1).
Ethics approval and consent to participate
This study was conducted according to the guidelines proposed by Kyung Hee University Hospital at Gangdong, and all procedures involving human subjects were approved by the Institutional Review Board (IRB) at Kyung Hee University Hospital at Gangdong (IRB number; 2017-06-030). All performed procedures were in accordance with the ethical standards of the 1964 Helsinki Declaration and its later amendments. Written informed consent was obtained from all study participants before inclusion. This trial has been registered with the Clinical Research Information Service (CRIS), Korea (KCT0004672).
Study procedures
Eligible participants were randomly assigned to the placebo group (n = 38), or the D. morbifera group (n = 36) at visit 2. Next, a simple randomization procedure was performed without stratification using a random number list. All of the enrolled subjects were educated about nutrition and exercise prior to starting the trial. They maintained a balanced diet and regular physical activity. We provided subjects with dietary information, such as the components of well-controlled diet, the importance of food choices, and information how to cook low-fat meals. Efficacy and safety assessments were performed at baseline, and at weeks 4 and 12. All of the participants were instructed to take 2 pills once daily with water 30 minutes prior to eating breakfast.
Body weight was measured to the nearest 0.05 kg and height was measured to the nearest 0.1 cm using a measuring system (GL-310; G-Tech International, Uijeongbu, Korea), respectively. Body mass index (BMI) was calculated as weight in kilograms divided by the square of height. The waist circumference (WC) was measured midway between the lower rib margin and the iliac crest by the same researcher. Fat mass was evaluated using the bioimpedance method (InBody720; Biospace, Seoul, Korea).
Blood samples were collected after fasting for more than 8 hours at baseline, and after 4 and 12 weeks of treatment. The kinetic ultraviolet (UV) method was used to measure AST, ALT and blood urea nitrogen (AU5800; Beckman Coulter, Inc., Brea, CA, USA). Creatinine was measured using a kinetic colorimetric assay (AU5800). Lipid profiles (total cholesterol, TG, HDL-C, and LDL-C) were measured using an enzymatic colorimetric assay (AU5800). Fasting plasma glucose (FPG) was measured using an enzymatic UV method (AU5800). Fasting insulin was measured using a chemiluminescent microparticle immunoassay (Architect i1000 System; Abbott Laboratories, Abbott Park, IL, USA). The hemoglobin A1c (HbA1c) was measured using high-performance liquid chromatography (Variant II TURBO; Bio-Rad, Kyoto, Japan). Serum glycated albumin (GA) was measured at week 4 using an enzymatic method that included an albumin-specific proteinase, ketoamine oxidase and albumin assay reagent (LUCICA GA-L; Asahi Kasei Pharma Co., Tokyo, Japan), and a Hitachi 7699 P module autoanalyzer (Hitachi Instruments Service, Tokyo, Japan).
Preparation of D. morbifera extracts
D. morbifera was manufactured and provided by J-creation Co, Ltd. on Jeju Island in the Korea. The leaves from the plant samples were washed 3 times using 100°C water. The leaves were packed in 5 kg units in burlap. They were then extracted for 15 hours in purified water at 85°C. After removing impurities using a 0.5 μm filter, the extracts were transferred to a storage tank and concentrated 10 times. The 90% of the extracts and 10% of dextrin were blended properly, stirred at 90°C, and freeze-dried at −75°C for 40 hours until the proportion of water contents decreased to < 8%. Finally, the dried extract was ground to 50 mesh powder using a pin mil.
The concentration of D. morbifera extract that lowered body weight or glucose level in the animal study was 200 mg/kg body weight for rats (0.08 mg/cm2 of body surface areas). Because the ratio of the body surface area in the tested species (rats) to that of humans is 5.45, 480–960 mg was calculated as the equivalent dose for a 60 kg human being. We decided to administer a medium dose of 700 mg D. morbifera, and one pill contains 350 mg D. morbifera leaf extracts to facilitate dosing in capsule form. All subjects were instructed to take 2 pills once daily within 30 minutes before breakfast for 12 weeks. The compositions of placebo and D. morbifera capsule are presented in Supplementary Table 1.
Definitions
Diabetes was defined as FPG level ≥ 126 mg/dL, or HbA1c ≥ 6.5% [1718]. Prediabetes was defined as 100 ≤ FPG level < 126 mg/dL, or 5.7 ≤ HbA1c < 6.5% [19]. The MetS was diagnosed in any subjects who met 3 or more of the following criteria: 1) abdominal obesity (the Asia Pacific criteria for obesity based on WC: men ≥ 90 cm and women ≥ 85 cm); 2) TG ≥ 150 mg/dL; 3) FPG ≥ 100 mg/dL or the use of antidiabetic medications; 4) HDL-C < 40mg/dL men or < 50 mg/dL in women, or use of lipid-lowering medications; 5) hypertension based on a BP ≥ 130/85 mmHg or the use of antihypertensive medications. These criteria were adopted from the modified Third National Cholesterol Education Program Expert Panel on Detection, Evaluation, and Treatment of High Blood Cholesterol in Adults and the specific values for WC provided by the World Health Organization and the Korean Society for the Study of Obesity [202122]. The homeostatic model assessment for insulin resistance (HOMA-IR) was calculated according to the following formula: fasting insulin (μU/L) × FPG (mg/dL)/405. The homeostatic model assessment of β-cell function (HOMA-β) was calculated using the following formula [23]: 360 × fasting insulin (μIU/L)/FPG (mg/dL) − 63. Difference was calculated by subtracting the baseline values from follow-up values. The percent change was calculated by dividing the difference by the baseline value and multiplying by 100 (%).
Outcome assessment
The efficacy endpoints were as follows: changes in glycemic parameters (such as FPG, HbA1c, GA, HOMA-IR, and HOMA-β), changes in lipid parameters (such as total cholesterol, TG, LDL-C, and HDL-C), changes in obesity parameters (such as body weight, BMI, WC, total fat, abdominal fat amount, and changes in systolic/diastolic BP after 4 and 12 weeks of treatment. In addition, the proportion of subjects with MetS and the numbers of MetS components were investigated after 12 weeks.
All of the subjects completed a 24-hour recall dietary record before and at the end of the study. Dietary records that were kept during the study were used to reinforce dietary advice and evaluate the amount of total energy and nutrients intake. Nutrient analysis was quantified using a computer-aided nutritional analysis program (CAN pro 4.0; Korean Nutrition Society, Seoul, Korea).
Safety was assessed by monitoring adverse events (AEs), laboratory results (AST, ALT, serum creatinine, leukocyte count, hemoglobin, and platelet count), electrocardiograms, vital signs, and physical examinations. AEs were defined as those that occurred, worsened, or became serious during the study period. The AEs included all unintended consequences that the individual receiving treatment experienced, regardless of its causality. AEs were categorized as definitely related, probably related, possibly related, probably not related, definitely not related, and with an unknown relationship to the study drug.
Statistical analyses
The data were analyzed using the SPSS software (version 22.0; IBM Corp., Chicago, IL, USA). Continuous variables which were normally distributed were presented as means ± standard deviations, or as medians (25th–75th percentile) if they were not normally distributed. Either the Student's t-test or Mann-Whitney U test was used to compare the differences between the 2 groups. The 2-way repeated measures analysis of variance (ANOVA) for parametric variables and aligned ranks transformation ANOVA for non-parametric variables were used to compare the groups for changes in metabolic parameters from baseline to each assessment time. A paired t-test or Wilcoxon signed-rank test was used to compare the pre- and post-treatment data within a group. Categorical variables were expressed as numbers and percentages, and were analyzed using the χ2 test. P < 0.05 was considered statistically significant.
RESULTS
Baseline characteristics of the subjects
The subjects' baseline demographic and clinical characteristics are described in Table 1. The mean age was 44.8 ± 12.3 years. The proportion of female participants was 69.0%. The mean BMI was 23.8 ± 3.5 kg/m2. The majority of subjects were prediabetic patients (62.2%) with a mean FPG of 103.4 ± 10.8 mg/dL, and mean HbA1c of 5.5 ± 0.3%. There were no significant differences in any baseline variables, including age, sex proportion, body composition, BP, glycemic parameters, and lipid profiles, between the placebo and D. morbifera groups.
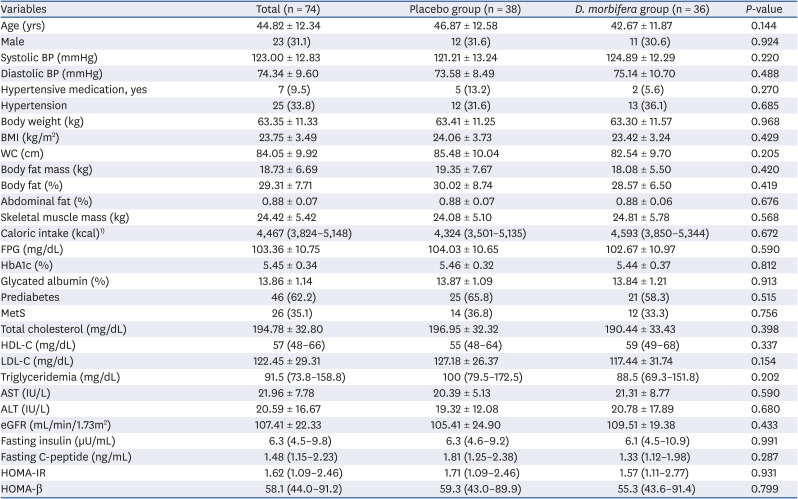
Table 1
Baseline characteristics of the subjects
Values are presented as mean ± standard deviation, number (%) or number (range).
BP, blood pressure; BMI, body mass index; WC, waist circumference; FPG, fasting plasma glucose; HbA1c, hemoglobin A1c; MetS, metabolic syndrome; HDL-C, high-density lipoprotein-cholesterol; LDL-C, low-density lipoprotein-cholesterol; AST, aspartate aminotransferase; ALT, alanine aminotransferase; eGFR, estimated glomerular filtration rate; HOMA-IR, homeostasis model assessment of insulin resistance; HOMA-β, homeostatic model assessment of β-cell function.
1)Measured in 72 subjects.
![]()
Changes in glycemic parameters, insulin sensitivity and insulin resistance
After 4 weeks of treatment, there were no differences in the glycemic parameters including FPG, GA, HOMA-β, and HOMA-IR between the 2 groups. The fasting insulin level was the only parameter that significantly decreased compared to baseline only in the D. morbifera group (6.1 [4.5–10.9] μIU/L vs. 5.8 [3.9–7.9] μIU/L, P = 0.043; Table 2). After 12 weeks of treatment, the HbA1c level showed a significant time and group interaction (Supplementary Fig. 1), and the HbA1c level significantly decreased in the D. morbifera group, compared to that of the placebo group (% of change between baseline and week 12: −2.27 ± 3.63% vs. 0.10 ± 5.10%, P = 0.025; Fig. 2). HbA1c at week 12 was also significantly decreased from baseline within the D. morbifera group (P = 0.001; Supplementary Fig. 1). Notably, the HbA1c lowering effect was only evident in the subjects with prediabetes using D. morbifera (Fig. 2), when we classified the subjects into prediabetes and normal groups. The fasting serum insulin level, HOMA-β and HOMA-IR at week 12 were all significantly lower than those of baseline within the D. morbifera group. However, FPG, GA, and fasting C-peptide levels did not differ between or within the 2 groups (Table 2).
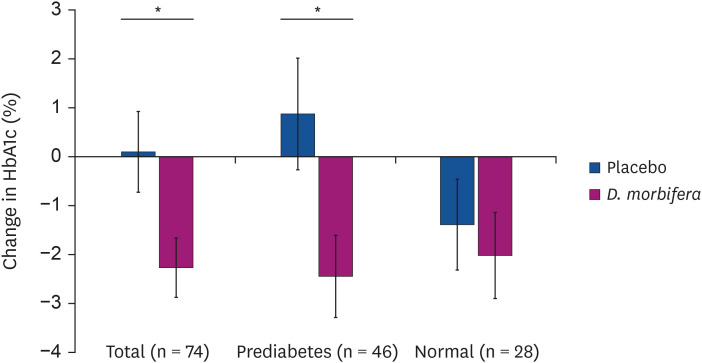
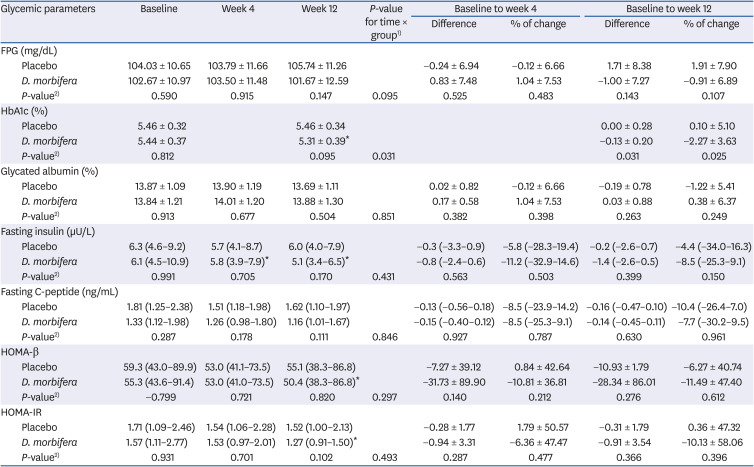
Fig. 2
Percent changes in HbA1c level between baseline and week 12 according to prediabetic and normal glycemic status. Data was presented as mean with standard deviation. The black bar represents the prediabetic group (n = 46), while the white bar represents the normal group (n = 28).
HbA1c, hemoglobin A1c.
*P-value < 0.05 for group comparison.
![]()
Table 2
Changes in glycemic parameters, insulin sensitivity and insulin resistance before and after treatment
Values are presented as mean ± standard deviation or number (range).
FPG, fasting plasma glucose; HbA1c, hemoglobin A1c; HOMA-β, homeostatic model assessment of β-cell function; HOMA-IR, homeostatic model assessment for insulin resistance.
1)Repeated measure/aligned ranks transformation analysis of variance test was used to see the variables in both groups during course of follow up time period; 2)The t-test/Mann-Whitney U test was used to compare the difference between 2 groups.
*P < 0.05 for compare the within group difference in paired t-test or Wilcoxon signed test.
![]()
Changes in lipid parameters
There was no time and group interaction until 12 weeks of treatment. At week 4, HDL-C was significantly increased and TG was significantly decreased in D. morbifera group than in placebo group (Table 3). Neither difference within group from baseline to week 12 nor difference between placebo and D. morbifera groups was observed in total cholesterol, TG, HDL-C and LDL-C levels after 12 weeks.
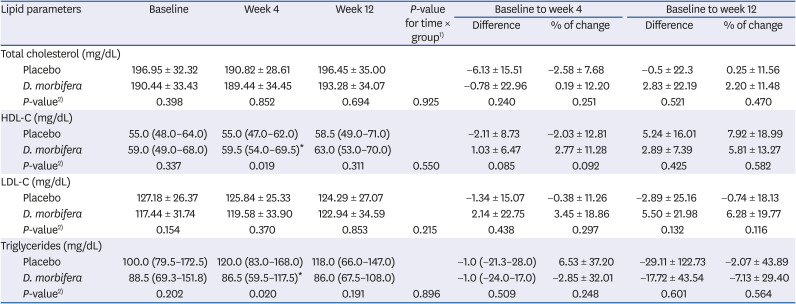
Table 3
Changes in lipid parameters before and after treatment
Values are presented as mean ± standard deviation or number (range).
HDL-C, high-density lipoprotein-cholesterol; LDL-C, low-density lipoprotein-cholesterol.
1)Repeated measure/aligned ranks transformation analysis of variance test was used to see the variables in both groups during course of follow up time period; 2)The t-test/Mann-Whitney U test was used to compare the difference between 2 groups.
*P < 0.05 for compare the within group difference in paired t-test or Wilcoxon signed test.
![]()
Changes in caloric intake and body composition
Although no significant differences over time in all indices of body composition were found between the 2 groups, the percentage of abdominal fat at week 4 was significantly increased from baseline and remained static at week 12 in the placebo group, while there was no change from baseline in abdominal fat proportion in the D. morbifera group (Table 4). The daily caloric intake, body weight, BMI, and body fat percent did not differ before and after treatment within each group or between groups (Table 4).
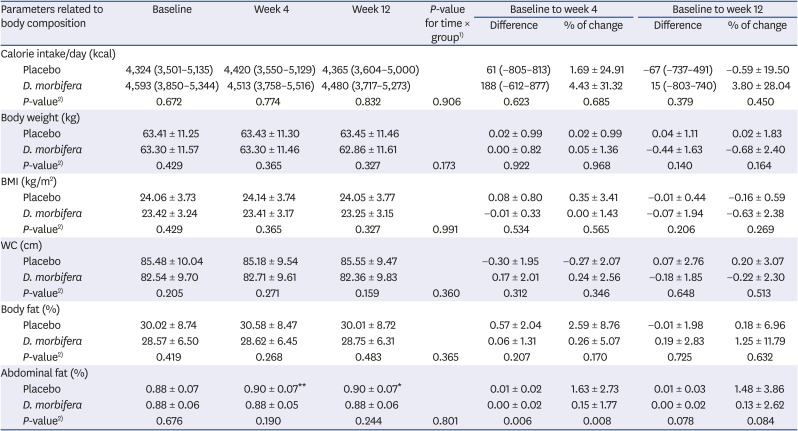
Table 4
Changes in body composition before and after treatment
Values are presented as mean ± standard deviation or number (range).
BMI, body mass index; WC, waist circumference.
1)Repeated measure/aligned ranks transformation analysis of variance test was used to see the variables in both groups during course of follow up time period; 2)The t-test/Mann-Whitney U test was used to compare the difference between 2 groups.
*P < 0.05 and **P < 0.01 for compare the within group difference in paired t-test or Wilcoxon signed test.
![]()
Changes in BP
There was a significant difference in systemic BP pattern over time between 2 groups (Supplementary Fig. 2). Systolic BP showed a significant decreasing trend until week 12 in the D. morbifera group, whereas it increased in the placebo group. However, both systolic and diastolic BP at week 4 did not differ between and within the 2 groups.
The systolic BP in the D. morbifera group was significantly lower after 12 weeks of treatment than it was at baseline or in the placebo group (difference between baseline and week 12: −3.94 ± 9.81% vs. 3.34 ± 11.70%, P = 0.005; % of change between baseline and week 12: −2.82 ± 7.68% vs. 3.29 ± 10.15%, P = 0.005; Table 5).
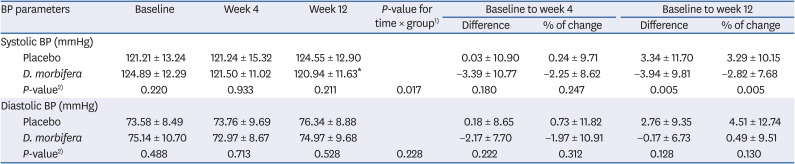
Table 5
Changes in blood pressure
BP, blood pressure.
1)Repeated measure/aligned ranks transformation analysis of variance test was used to see the variables in both groups during course of follow up time period; 2)The t-test/Mann-Whitney U test was used to compare the difference between 2 groups.
*P < 0.05 for compare the within group difference in paired t-test or Wilcoxon signed test.
![]()
Changes in prevalence of MetS and the number of MetS components
The prevalence of MetS of D. morbifera group at week 12 was significantly lower than that of placebo group (13.9% vs. 36.8%, P = 0.022; Fig. 3), although baseline prevalence of MetS did not differ. Among the subjects without MetS at baseline, 4.2% (n = 1) of the subjects in D. morbifera group (n = 24) developed incident MetS after 12 weeks of treatment compared to 16.7% (n = 4) of the subjects in placebo group (n = 24), which is significantly lower (P = 0.027; Fig. 3).
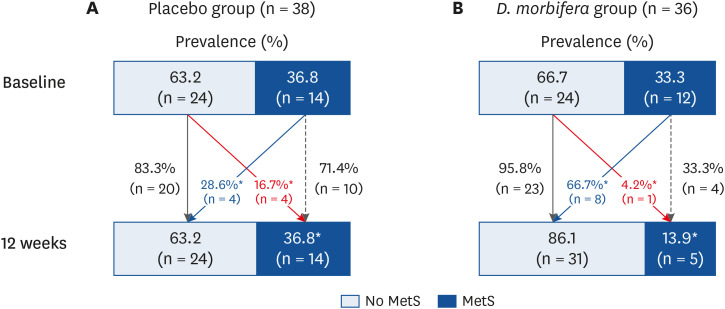
Fig. 3
Changes in prevalence and incidence of MetS between baseline and week 12. (A) Changes in placebo group. (B) Changes in D. morbifera group. Data was presented as percentage. The black bar represents the subjects with MetS, and the white bar represents those without. Thick solid red line represents the proportion of the subjects who do not have MetS at baseline, but developed new onset MetS at week 12. Thick solid blackline represents the proportion of the subjects who do not have MetS at baseline and week 12. Thick solid blue line represents the proportion of the subjects who had MetS at baseline, but recovered at week 12. Thick dotted black line represents the proportion of the subjects who had MetS at baseline and week 12.
MetS, metabolic syndrome.
*P < 0.05 for comparing the difference between D. morbifera and placebo group.
![]()
The numbers of baseline MetS components were distributed similarly between the 2 groups (Supplementary Fig. 3). After 12 weeks of treatment, the number of MetS components tended to decrease in the D. morbifera group, while it increased in the placebo group (Supplementary Fig. 3). The numbers of MetS components at week 12 were significantly lower in the D. morbifera group (1.2 ± 1.2 vs. 2.0 ± 1.3, P = 0.010) than it was in the placebo group.
Safety evaluation
The proportion of total AEs (5.3 vs. 8.1%, P = 0.627) did not differ between the placebo and D. morbifera groups (Supplementary Table 2). There were no serious AEs in either group. The serum AST level of the D. morbifera group was significantly lower after treatment than it was at baseline. However, the AST level remained within the normal reference range. Otherwise, there were no changes in the laboratory results between the groups before and after treatment.
DISCUSSION
To our knowledge, this study is the first randomized controlled human trial to investigate the effect of D. morbifera on the metabolic parameters that mostly are components of MetS. Treatment with D. morbifera leaf extract significantly reduced the HbA1c level compared to that in the placebo group. HOMA-IR and HOMA-β also decreased from baseline within the D. morbifera group during 12 weeks of treatment, although these changes did not differ to those of placebo group. In addition, D. morbifera extracts significantly lowered systemic BP after 12 weeks of treatment. Even though D. morbifera extracts did not change the obesity or lipid parameters, the prevalence of MetS and sum of MetS components significantly decreased in the D. morbifera group after 12 weeks through the improvement of glycemic metabolism and hypertension. Furthermore, the proportion of subjects with MetS at baseline who were normalized at week 12 was higher in the D. morbifera group than it was in the placebo group. There were no serious side effects of D. morbifera treatment.
To date, all prior studies that investigated the effect of D. morbifera extract on metabolic parameters were performed in animals. The antidiabetic effects of D. morbifera extract were presented in STZ-induced diabetic rats [10]. In this study, 2 weeks of D. morbifera treatment significantly decreased serum glucose more so than did glibenclamide. Like sulfonylurea which is a strong insulin secretagogues, D. morbifera extract led to increased insulin secretion due to enhanced insulin expression in pancreatic islet cells of type 1 diabetes animal model which was induced by STZ [1018]. However, our human study showed that the index of insulin secretion and fasting insulin level were decreased from baseline within D. morbifera group. Also, HbA1C significantly decreased in subject with prediabetes after 12 weeks treatment with D. morbifera. It suggested that D. morbifera reduced insulin over-secretion and preserved pancreatic insulin secretion through improvement of insulin resistance in human. Especially, these glucose lowering effects was clearly demonstrated in subject with prediabetes who had insulin resistance. Prediabetes state means over-secretion of insulin to overcome the increased insulin resistance which is different with STZ-induced type 1 diabetic animal models. In addition, because prediabetes state of human is easily progress to type 2 diabetes mellitus (T2DM), D. morbifera treatment might be helpful to prevent the progression from prediabetes to T2DM.
In mice fed a high-fat and high-cholesterol diet, D. morbifera extract significantly reduced plasma and hepatic TG, total cholesterol, and LDL-C levels, with increased the plasma HDL-C level [19]. The cholesterol-lowering effect of D. morbifera extracts can be explained by several mechanisms in previous animal studies. First, the extract inhibited the intestinal absorption of cholesterol and promoted fecal cholesterol excretion [19]. Second, D. morbifera extracts decreased mRNA and protein expression of adipogenesis-related genes in mouse cells [20]. Third, the hot water extract of D. morbifera inhibited 3-hydroxy-3-methyl-glutaryl-CoA reductase, which is the rate-limiting enzyme for cholesterol synthesis [21]. D. morbifera extract also improved hepatic lipid accumulation by lowering reactive oxygen spices (malondialdehyde) and increasing the activity of superoxide dismutase, an antioxidant [19]. D. morbifera also inhibited intracellular lipid accumulation through the activation of AMP-activated protein kinase in HepG2 hepatocytes and 3T3-L1 adipocytes [11]. However, D. morbifera in our human study did not affect on lowering total cholesterol or LDL-C level. Instead, decrease in TG and increase in HDL-C from baseline level after treatment with D. morbifera might be explained by diminished hepatic TG synthesis and HDL clearance according to improvement of insulin resistance, rather than it directly contributed to prohibit cholesterol synthesis.
Both glucose and cholesterol-lowering effects are usually related to the anti-obesity effect. Prior studies that addressed the anti-obesity effects of D. morbifera were animal- or cell-based; therefore, there were conflicting results regarding its effect on body weight, as these studies did not contain any information on body composition. Diabetic rats that treated with D. morbifera extracts did not lose weight compared to controls [18]. Conversely, mice fed a high-fat and high-cholesterol diet lost more weight than did the control group after 7 weeks of D. morbifera administration in a dose dependent manner [19].
However, we did not find any significant differences in the body composition, body weight and total caloric intake in this study. This result might be partially explained by the fact that it is hard to extrapolate animal data to humans. The animal models used in the aforementioned studies experienced extremely unfavorable metabolic states given high fat diet. We enrolled subjects without overt diabetes, with a mean LDL-C level of 122.5 mg/dL which does not reach the diagnostic criteria for dyslipidemia, and with a mean BMI of 23.8 kg/m2 which does not reach the diagnostic criteria of obesity. Therefore, our study suggested that glucose and BP lowering effects of D. morbifera did not result from indirect effect of weight loss, but resulted from the effect of D. morbifera to alleviate insulin resistance.
In addition, the mice with D. morbifera extracted by using ethyl acetate (21.3%) or n-butanol (11.0%) had lower BP than did the control group [13]. The levels of angiotensin II, angiotensin converting enzyme, and aldosterone were all lower in the D. morbifera treated group than they were in the control group. Inappropriate activation of the renin angiotensin aldosterone system (RAAS) is one of the main mechanisms for hypertension. Therefore, controlling the RAAS might be a mechanism by which D. morbifera extract has anti-hypertensive effects. In accordance with these results, the systemic BP was significantly lower in the D. morbifera group after 12 weeks of treatment in this study. Insulin can increase BP via several mechanisms such as increased renal sodium reabsorption, activation of the sympathetic nervous system, and hypertrophy of vessel [22]. Vice versa, hypertension can cause insulin resistance by altering the delivery of insulin and glucose to skeletal muscle cells [23]. Although the causal relationship is unclear in this study, improvement of BP and insulin resistance might be substantially intertwined.
As another pathophysiology of MetS in addition to insulin resistance, emerging evidence indicates that chronic low grade inflammation may represent a triggering factor for MetS [24]. Various stimuli such as overnutrition would result in cytokine hypersecretion and lead to insulin resistance in genetically or metabolically predisposed individuals. Alternatively, resistance to the anti-inflammatory actions of insulin would result in high circulating levels of proinflammatory cytokines resulting in persistent low-grade inflammation. Therefore, the anti-inflammatory effects of D. morbifera might support the improvement in MetS components. D. morbifera extracts suppressed the production of lipopolysaccharide-induced pro-inflammatory mediators and cytokines [925], increased the number and proliferation of T- and B-lymphocytes for boosting non-specific immunity [15].
The present study has several limitations. First, the study sample size was relatively small, and most of the enrolled subjects did not have overt metabolic disorders. Therefore, it is difficult to generalize or extrapolate these results to a larger population. Second, the duration of the treatment period was too short to observe the recovery for metabolic disarrangements. Lastly, more information on inflammatory markers, cytokine, and RASS should be needed to understand the exact mechanism of improving metabolic parameters.
In conclusion, the supplementation of D. morbifera extracts over a 12-week period reduced the prevalence of MetS and improved metabolic parameters such as HbA1c and BP. Insulin resistance was also modestly decreased in subjects using D. morbifera extracts. The results from this clinical study may serve as a platform to evaluate the utility of D. morbifera extracts as a nutraceutical source for the management of metabolic disorders.
 XML Download