

 PDF
PDF Citation
 Print
Print


INTRODUCTION
Low socioeconomic status poses a great risk of death from non-communicable diseases (NCDs) [1]. Furthermore, major risk factors for NCDs related to poverty are an additional burden on low-income countries [12]. Several epidemiological studies have reported an association between a social gradient of socioeconomic indicators and subjective [345] or clinical oral health status [67]. Low socioeconomic status is a crucial determinant of chewing disability [8] and poorer self-reported oral health status [3]. Chewing ability is assessed and monitored annually in Korea, along with periodontal disease, dental caries, and tooth loss [9]. About half of Korean adults suffer from chewing discomfort [10], and the incidence of such discomfort is increasing in older Koreans, according to the Korea National Health and Nutrition Examination Survey (KNHANES) [9]. In the elderly, mastication and swallowing function may be deteriorated, which can lead to indigestion because they are not able to completely chew and swallow their food [11]. Moreover, as dietary changes occur due to a limited food intake, the quantity and quality of meals decreases, and nutritional intake becomes unbalanced [12]. The proportions of elderly people who consumed less than the estimated average requirement (EAR) of calcium, less than an adequate intake of potassium, less than the EAR of riboflavin, and less than the EAR of vitamin A were 82.3%, 79.6%, 71.0%, and 61.7%, respectively [13]. Moreover, nutritional status was lower in women than in men, and lower in those over 75 years of age than in those aged 65–74 years [13].
Food security is a broad subject that includes all aspects of food availability, accessibility, and utilization [14] and has emerged as a public health issue associated with socioeconomic inequality [15]. Household food insecurity was associated with various chronic systemic, mental, and social health diseases in a population-based survey in Canada [16] and the United States [17]. In the results of a domestic study, household food instability was shown to affect physical health and mental health, including the risk of depression [1819]. Moreover, it was closely related to declines in 5 aspects of the quality of life (exercise ability, self-management, daily life, pain/discomfort, and anxiety/depression) [20]. In addition, food insecurity has been closely related to education level and marital status, particularly a high divorce rate [21]. However, studies on oral health status and food insecurity have not been widely reported. Muirhead et al. [22] demonstrated an association between self-reported oral health status and food insecurity based on telephone surveys of working-poor subjects. A National Health and Nutrition Examination Survey [23] analysis revealed a positive association between food insecurity and untreated dental caries in US children. In an analysis of 203 Brazilian children [24], food insecurity was 1.5 times more likely to cause dental caries. Except for these few studies, no research reports have been published on food security or chewing discomfort in Korea. Thus, studies into potential associations between food security and chewing discomfort in Korean adults are needed. In addition, it is important to determine the relationships of food insecurity with socioeconomic inequality and chewing discomfort.
The aims of this study were 1) to investigate the association between socioeconomic status and chewing discomfort, 2) to examine the association between food insecurity and chewing discomfort, 3) and to assess whether food insecurity mediates the link between socioeconomic status and chewing discomfort in a representative population of Korean elders.
Go to : 
MATERIALS AND METHODS
Study population
This study was based on data from the 2013–2015 KNHANES VI, which is carried out annually by the Korea Centers for Disease Control and Prevention (KCDC) since the enactment of the National Health Promotion Act. The sampling protocol was designed to include a complex, stratified, multistage, and probability-cluster survey of a representative sample of the non-institutionalized civilian population [25]. Based on the 2010 Population and Housing Census, all household members aged 1 year or older of 20 selected households in each survey district were selected as subjects for the survey. [26]. In total, 192 primary sampling units (PSUs) were selected from geographically defined PSUs in South Korea. Representative participants were annually selected from about 10,000 household members ≥ 1 year old [25]. Three types of survey are included in the KNHANES: a health examination (including an oral examination), a health interview, and a nutrition survey. Subjects participated in the survey and completed a questionnaire after completing a consent form. This study has been conducted in full accordance with the World Medical Association Declaration of Helsinki. The 2013 to 2015 survey was ethically approved by the Institutional Review Board (IRB) of KCDC (IRB No. 2013-07CON-03-4C, 2013-12EXP-03-5C, 2015-01-02-6C). The number of participants included for the 3 years was 22,948. Of those, exclusion criteria were applied as follows: 1) < 65 years of age (n = 18,133), 2) missing values in socioeconomic status variables (n = 734), 3) missing value in food security status (n = 250), 4) missing value in chewing discomfort (n = 95), 5) missing values in various confounders (n = 660). The final sample included 3,076 participants.
Assessment of socioeconomic status (independent variable)
Household income and education level were used as socioeconomic status indicators. Education level was divided into the 4 groups of elementary school, middle school, high school, and college or further. Income level was divided into 4 quartiles after calculating the average monthly household income: lowest quartile (< 25%), lower-middle quartile (25–49%), upper-middle quartile (50–74%), and highest quartile (≥ 75%).
Assessment of chewing discomfort (dependent variable)
The participants were asked whether they had chewing problems through the following question. “Do you feel uncomfortable chewing food due to mouth problems, such as teeth, dentures, or gums? (If you have a denture, please tell us how you feel.)”. The answers to the question consisted of 1 of 5 responses: “very much”, “quite a lot”, “some”, “very little”, or “not at all”. Chewing discomfort was categorized into 2 groups for the analysis: yes (very much, quite a lot) and no (some, very little, not at all).
Assessment of food security status (mediator)
The food stability questionnaire was composed of 18 items developed for Koreans based on the US Household Food Security Survey Module in the United States [27]. All items consisted of questions about dietary habits related to a lack of money for food during the past year. In general, 18 items were examined in households including children, while 10 items were examined in households without children. The food security score was categorized as 0 for positive or 1 for negative, based on the response to the item, and the sum of the food security scores for all items was calculated. The severity of food insecurity status was classified into 4 groups for households with no children as follows: 1) score 0–2: food secure; 2) score 3–5: food insecure without hunger; 3) score 6–8: moderately food insecure with hunger; 4) score 9–10: severely food insecure with hunger, whereas the severity of food insecurity status was classified into 4 groups for households with children as follows: 1) score 0–2: food secure; 2) score 3–7: food insecure without hunger; 3) score 8–12: moderately food insecure with hunger; 4) score 13–18: severely food insecure with hunger. Because the distributions of moderate and severe food insecurity responses were very low, food security status was dichotomized into food secure and food insecure (food insecure with hunger, moderately food insecure with hunger, and severely food insecure with hunger).
Assessment of confounders
All health interviews and general health examinations were conducted by well-trained clinicians and medical staff in a face-to-face manner. Demographic factors included age, sex, residential area, and marital status. The area of residence was divided into Dong and Myung according to the administrative district, and marital status was divided into the presence of a spouse or living alone. General health behavior factors included smoking status and alcohol drinking. The participants were asked whether they were currently smoking, and the responses were classified as never smoker, former smoker, or current smoker. The participants responded to the question about the frequency of alcohol drinking during the previous year with the following answers: non-drinker; almost non-drinker (≤ 1 day per month); light drinker (2–4 days per month); moderate drinker (2–3 days per week); and heavy drinker (≥ 4 days per week).
The frequency of daily tooth brushing (< 2 times/day or ≥ 2 times/day) and regular dental visits (yes or no) during the last year were included as indicators of oral health behavior. Systemic health status included the presence of obesity, diabetes mellitus, and hypertension. Obesity was defined as a body mass index (BMI) ≥ 25.0 kg/m2, with BMI calculated by dividing weight in kilograms by the square of height in meters. The definition of diabetes mellitus was defined as a fasting glucose level > 126 mg/dL or taking medication for diabetes. Hypertension was a systolic blood pressure ≥ 140 mm Hg, diastolic blood pressure ≥ 90 mm Hg, or taking medication for hypertension.
Statistical analysis
According to the guidelines for the KNHANES statistical analysis [26], combined weights were generated to merge the 3 years of data, and all data underwent a complex sampling analysis. The distributions of socioeconomic, demographic, and behavioral factors and disease prevalence by chewing discomfort and food security status are presented as weighted percentages and standard errors and differences determined using the independent t-test and the χ2 test. Mediation models were constructed and analyzed with 4 separate logistic regression models. Socioeconomic status was fitted as an independent variable, food security status as a mediator, and chewing discomfort as a dependent variable. The associations between socioeconomic status, food insecurity, and chewing discomfort were constructed using mediation analysis. Various confounders (age, sex, area of residence, marital status, smoking status, alcohol consumption, dental visits, tooth-brushing frequencies, obesity, diabetes mellitus, and hypertension) were included in all logistic regression models. The first analysis was performed on the effect of the independent variable on the mediator (socioeconomic status → food insecurity). The second analysis was performed on the effect of the independent variable on the dependent variable (food insecurity → chewing discomfort). In the subsequent analysis, the effect of the independent variable on the dependent variable was analyzed (socioeconomic status → chewing discomfort). Finally, the link between socioeconomic status and chewing discomfort was assessed in model 4 by adding food insecurity to model 3. We assessed whether food insecurity mediated the association between the 2 main variables by examining changes in the regression coefficients. All analyses were performed using the SPSS 22 (SPSS Inc., Chicago, IL, USA) statistical program.
Go to :
RESULTS
Table 1 shows the distribution of general characteristics among study participants according to chewing discomfort. Of the 3,076 study participants, 1,331 (43.3%) reported chewing discomfort. Participants who had chewing discomfort were more likely to be female (P < 0.05), have a lower household income (P < 0.001), and have a lower education level than those without chewing discomfort (P < 0.05). More than half of the food insecure group reported the lowest household income and lowest education level. The proportion of chewing discomfort was significantly higher in participants who did not visit a dental clinic and brushed teeth less frequently (P < 0.05). No significant differences were detected in systemic health conditions according to chewing status. The proportions of food insecure participants were 14.5% of those with chewing discomfort and 6.9% of those without chewing discomfort (P < 0.001).
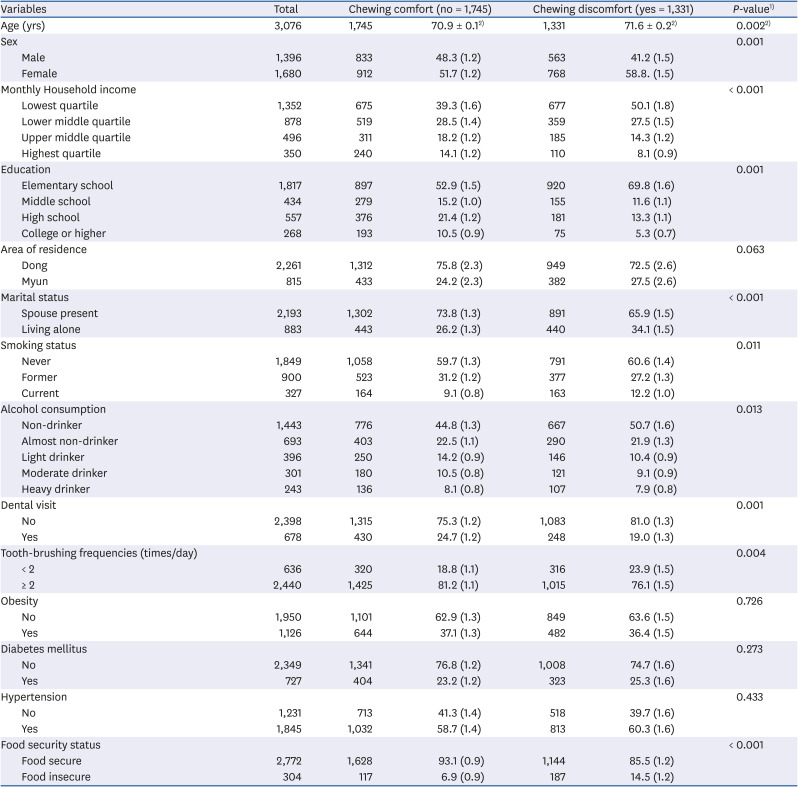
Table 1
Characteristics of study participants according to chewing status (n = 3,076)
Data are shown as mean ± SE or number (%).
1)Obtained from χ2 test.
2)Obtained from independent t-test.
![]()
The distributions of the socioeconomic status factors and confounders according to food security are presented in Table 2. The estimated percentages of subjects in the food secure and food insecure groups were 90.1% and 9.9%, respectively. Food insecurity was significantly higher in participants with a lower income and lower education level (P < 0.001 for both).
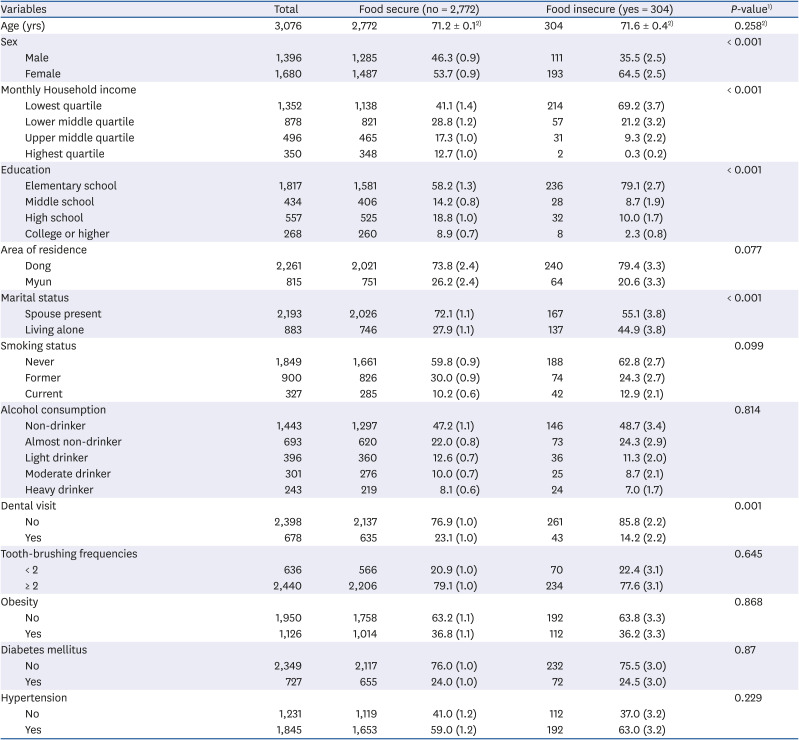
Table 2
Distribution of socioeconomic status and confounders and mediator according to food security
Data are shown as mean ± SE or number (%).
1)Obtained from χ2 test.
2)Obtained from independent t-test.
![]()
Table 3 sequentially displays the model results for the mediation analysis on food insecurity between socioeconomic status and chewing discomfort groups. Model 1 showed that socioeconomic status has a significant effect on food insecurity. Notably, the strength of the association was much stronger than that of education. Model 2 showed the effect of food insecurity acting as a mediator on chewing discomfort (odds ratio [OR], 2.14; 95% confidence interval [CI], 1.59–2.89). Model 3 demonstrated the association between the 2 main variables.
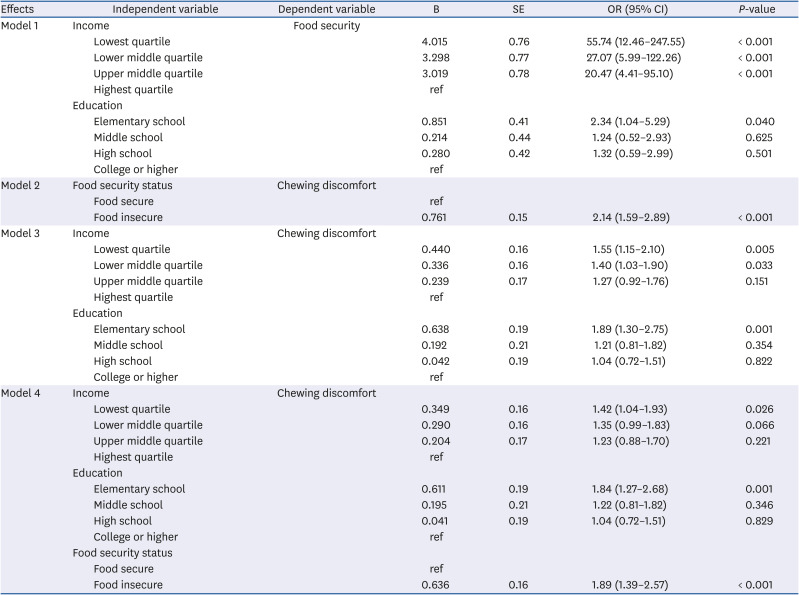
Table 3
Associations of socioeconomic status with food insecurity and chewing discomfort
Each analytical model was adjusted for age, sex, area of residence, marital status, smoking, alcohol consumption, dental visits, tooth-brushing frequencies, obesity, diabetes mellitus, and hypertension
B, logistic coefficient; OR, odds ratio; 95% CI, 95% confidence interval.
![]()
The ORs for chewing discomfort in the first and second income quartiles were 1.55 and 1.40 compared to participants in the highest income quartile (OR, 1.55; 95% CI, 1.15–2.10 for the first income quartile and OR, 1.40; 95% CI, 1.03–1.90 for the second income quartile). Participants with the lowest education level were 1.89 times more likely to have chewing discomfort than those without chewing discomfort (OR, 1.89; 95% CI, 1.30–2.75 for first education quartile). In model 4, the food insecurity OR was lower for chewing discomfort than in the previous model 2 (OR, 1.89; 95% CI, 1.39–2.57). The logistic coefficients were attenuated in the income and education quartiles as a result of the comparison of the logistic coefficients for socioeconomic status of models 3 and 4, which showed that income and education partially mediated the effect of socioeconomic status on chewing discomfort.
Go to :
DISCUSSION
In this Korean nationwide population-based study, low socioeconomic status was associated with chewing discomfort independent of the effects of age, sex, area of residence, marital status, smoking, alcohol consumption, dental visits, tooth-brushing frequency, obesity, diabetes mellitus, and hypertension. Thus, socioeconomic status is related to the indirect and direct impacts of chewing discomfort. In addition, our findings confirm that food partially mediates the association between socioeconomic inequalities and chewing discomfort among the elderly.
Social gradients have been documented in various oral health indicators, such as chewing ability [8], untreated decayed teeth [28], number of teeth [36], and periodontitis [6]. Among these indicators, more research on chewing discomfort and socioeconomic status in older subjects who have accumulated oral disease throughout life is needed. Chewing discomfort is indicative of various oral health problems, functional limitations, unfavorable food choices, and oral health-related quality of life [8]. Thus, the prevalence of chewing discomfort is a crucial indicator that has been monitored in the elderly via KNHANES. In our study, the income gradient in participants with chewing discomfort had a much higher slope than the education gradient. However, we could not compare the present study results with those of other studies because other self-reported measures were used as the instruments of subjective oral pain- and oral health-related quality of life [3429] rather than chewing discomfort. A similar study examined the impacts of early life conditions on chewing discomfort using representative data from 13 European countries [8]. A pattern of regular dental visits in childhood was reported to determine oral health behaviors throughout life and create positive oral health consequences in old age [8].
Income is the best indicator of those material-related resources that can have a direct impact on health [30]. Most affluent residents in ‘advantaged’ neighborhoods have appropriate access to dental care [31]. In contrast, socioeconomically disadvantaged residents have less access to dental industry infrastructure and services, and it is difficult for such residents to obtain information and opportunities related to oral health promotion activities [31]. In a Brazilian longitudinal study [32], showed that a lower income is related to adverse oral health due to limited access to dental care.
Our secondary findings were that food-insecure participants were more likely to have chewing discomfort. This result corroborated those in a Canadian study of working-poor subjects [22] that reported on food insecurity, self-rated oral health indicators, and denture wearing status. Although the effects of food insecurity on oral health disparities are not well established, observations of food insecurity leading to detrimental oral health outcomes can be explained as follows. Food insecurity refers to insufficient access to an adequate and safe food supply due to limited money or other resources [33]. Individuals with a low income tend to consume relatively low amounts of fruits, meats, and dairy products, which are sensitive to food price changes [34]; instead, they consume inexpensive and unhealthy foods that contain starch, added sugars, and saturated and trans fats [35]. Such unhealthy dietary patterns lead to several diet-related chronic diseases, including hypertension [36], diabetes mellitus [37], obesity [38], and kidney disease [39]. Similarly, a carbohydrate-rich diet and the consumption of processed foods containing large amounts of added sugars increase the risk for dental caries [4041] and periodontal disease [404142]. Starch also increases the risk for caries on root surfaces, which is a major concern among older people [41]. One study suggested that one of the most common consequences of such oral disorders is reduced masticatory capacity and functional impairment due to tooth loss [43].
The results in this study demonstrate that food insecurity can act as a mediator between socioeconomic status and chewing discomfort. This result is inconsistent with those in a recent US study of children, which showed food insecurity was not mediated by socioeconomic status or untreated dental caries [23].
South Korea is becoming a super-aged society, and the numbers of seniors living alone and in senior households or using welfare centers are increasing [44]. Food service may consist of congregate meal programs for elderly people who have access to local facilities or Meals-On-Wheels for disabled elderly [44]. Although nutritional issues in vulnerable elderly people are an urgent aspect of national welfare policy, food safety and nutritional management programs for the elderly remain insufficient. In fact, due to economic and physical limitations, the elderly often use the food services provided by senior welfare facilities; unfortunately, the quality of the food service programs may be poor. Therefore, government and policymakers should change the food purchasing environment for the elderly and provide food selection tips and healthy eating guidelines. These interventions should be developed in collaboration with dental staff and the dentistry sector and integrated into policies aimes at improving oral health and nutrition status.
This study had some limitations and should be interpreted carefully. A causal relationship cannot be asserted because of the cross-sectional nature of the study design. In addition, we did not evaluate the possible effects of childhood financial hardship or adverse life events that could affect chewing ability in subjects aged ≥ 50 years [8]. Further study is needed to investigate other socioeconomic status indicators, and subsequent research is needed to determine the mechanisms causing the observed association.
Nevertheless, there are several strengths of the present study. First, results describing the effects of food insecurity on oral health in children [8] and adults [22] have been published, but this is the first report based on data from a nationally representative sample of Korean elders describing those effects in the elderly. Second, we assessed conditions using a food security questionnaire validated for the general Korean population. Third, unlike previous studies [822], this study included various potential confounders, such as systemic health status and oral and general health behaviors.
In conclusion, socioeconomic status was shown to be independently associated with chewing discomfort in the Korean elderly. Food insecurity may be a possible mechanism through which low socioeconomic status is associated with chewing discomfort.
Go to :
 XML Download