

 PDF
PDF Citation
 Print
Print


INTRODUCTION
Chronic fatigue, including central nervous system fatigue and peripheral fatigue, can cause serious health problems, and the lack of control over fatigue is emerging as an important issue in individuals living in a rapidly changing modern society [12]. Fatigue of the central nervous system is characterized by a decrease in skeletal muscle activity, and peripheral fatigue affects the neuromuscular junctions [3]. Physical fatigue is mainly responsible for the deterioration of exercise performance, which is difficult to initiate in a sustainable or random manner, leading to sleep and lethargy [4]. During exercise, physical fatigue can be induced in response to the accumulation of ammonia and lactic acid in tissues and blood [5]. However, no treatment has been identified to prevent fatigue. Some reports have been suggested that the combination of supplementation with essential nutrients and aerobic exercise is an effective approach to preventing fatigue [6]. Therefore, one of the strategies to suppress fatigue involves the elimination or inhibition of the production of fatigue-related metabolites during exercise.
Nutrients are required for the growth and development of an organism, and nutrition involves the ingestion of external substances and energy metabolism to sustain life [7]. Physical fatigue is tightly associated with the maintenance of the balance between nutrition and energy metabolism [8]. For example, cluster of differentiation 36 (CD36) is a protein transporter of fatty acids from the extracellular membrane and cytoplasm to mitochondria. According to recent research results, exercise increases the expression of CD36 and mobilizes fat as an energy source [910]. The pyruvate dehydrogenase kinase 4 (Pdk4) gene is associated with lipid metabolism in the skeletal muscle [11]. Pdk4 mediates the inactivation of pyruvate dehydrogenase complex (PDC) via phosphorylation. Inactivation of PDC inhibits the conversion of pyruvic acid to acetyl-CoA, thereby shifting the energy substrate utilization from carbohydrates to lipids [12].
Physical fatigue is responsible for an imbalance between ATP generation and utilization [13]. ATP is synthesized by the ATP-creatine phosphate system, the lactate system that uses glycogen, and the aerobic system that uses carbohydrates and fats. In particular, the process of converting and transporting energy using the lactate system leads to the overproduction of biological metabolites such as ammonia and lactic acid [14]. Therefore, mechanisms of fatigue prevention involve the facilitation of fat metabolism, rather than carbohydrate metabolism, under conditions of high oxygen uptake to produce ATP, which is used for muscle contraction [15]. Mitochondria, which produce ATP, contribute to the maintenance of biological function by repeated fission and fusion [16]. During energy metabolism, mitochondria inevitably produce reactive oxygen species (ROS) [17], and ROS generation is one of the main causes of physical fatigue during excessive physical activity [18].
Dietary antioxidants reduce physical fatigue by preventing ROS-induced oxidative stress during exercise and scavenging free radicals [19]. Ginseng (GS) contains various physiologically active substances exhibiting antioxidant, anticancer, and antifatigue effects [20]. Especially, GS restores energy in the body and acts as a nutrient and tonic. However, the rates of absorption of GS components in the body show individual differences. Therefore, it is necessary to search for nutrients that can increase the absorption rates of GS components in the body to effectively utilize GS. Taurine (TR) is an in vivo metabolite that acts as an antioxidant and antifatigue agent [21]. In addition to metabolic pathway-mediated TR synthesis and elimination, excessive exercise can reduce the amount of TR in the body. In humans, TR in a free state is abundant in major organs, such as the heart, brain, and liver, and is the second most abundant amino acid, after glutamic acid, in the muscles [22]. However, there are no studies regarding a potential synergy in antifatigue effects of ginseng extract (GSE) and TR. In the present study, we analyzed the exercise ability and fatigue-causing factors in mice to determine whether there is a synergy between the antifatigue effects of TR and GSE.
Go to : 
MATERIALS AND METHODS
Materials
The reagents for cell culture experiments were purchased from Thermo Fisher Scientific (Waltham, MA, USA). GSE was purchased from the Geumsan Ginseng Wholesale Center (Geumsan, Korea). TR was obtained from Hubei Grand Life Science (Hubei, China). L6 rat skeletal muscle cells were obtained from the Korean Cell Line Bank (Seoul, Korea). MitoTracker™ Red FM, the blood urea nitrogen (BUN) colorimetric detection kit, and the lactate assay kit, TRIzol reagent and 4′,6-diamidino-2-phenylindole (DAPI) were purchased from Thermo Fisher Scientific. An anti-8-oxoguanine (8-oxoG) antibody was purchased from Merck (Darmstadt, Germany). The glycogen assay kit and all other reagents were purchased from Sigma-Aldrich (St. Louis, MO, USA).
Cell viability assay
L6 cells were cultured as previously described [23] in high-glucose Dulbecco's modified Eagle's medium containing 10% fetal bovine serum and 1% penicillin–streptomycin at 37 ± 2°C and 5% CO2. Cells were seeded into 96-well plates (1 × 10⁴ cells/well) and treated with TR, GSE, or mixtures of TR and GSE for 24 h, followed by incubation with the 2-(4-iodophenyl)-3-(4-nitrophenyl)-5-(2,4-disulfophenyl)-2H-tetrazolium reagent for 2 h at 37 ± 2°C. Cell viability was quantified using an iMARK microplate reader (Bio-Rad, Hercules, CA, USA) at 450 nm. Cell morphology was examined using light microscopy (Nikon, Tokyo, Japan) at a magnification of 200×.
In vitro immunocytochemistry
L6 cells (5 × 10³ cells/mL) were cultured in a 35-mm confocal dish for 24 h and then incubated with or without hydrogen peroxide (H2O2), TR, or GSE for 24 h. The cells were fixed with 4% formalin for 10 min, then permeabilized with 0.1% Triton X-100 for 10 min, incubated with 5% bovine serum albumin (BSA) for 1 h, and probed with the 8-oxoG antibody (1:1,000). The cells were then incubated with an Alexa Fluor 488-conjugated secondary antibody for 1 h. The nuclei were stained with DAPI. To detect mitochondria, the cells were incubated with MitoTracker™ Red FM at 37 ± 2°C for 30 min. Images were obtained at a magnification of 200× using fluorescence microscopy (K1-Fluo; Nanoscope System, Daejeon, Korea) installed at Korea Basic Science Institute (Seoul, Korea). The lengths of mitochondria were measured using the ImageJ software.
Animal care
Five-week-old male Kunming mice (Mus musculus) (Charles River Beijing, Beijing, China) were used for experiments after acclimation for 1 week. All experiments and animal care were performed in accordance with the institutional guidelines (SEMCARE 20-09-03). The experimental animals were housed in standard cages in a breeding room maintained at a constant temperature of 25 ± 2°C, humidity 55 ± 5%, and a 12-h light/dark cycle and were provided a standard feed (5L79 formula) containing 18% protein, 0.85% calcium, and 0.62% phosphorus (Orient Bio, Seongnam, Korea).
In vivo energy metabolism test
To measure energy metabolism during exercise, 24 mice were assigned to 4 groups (n = 6) and treated as follows: an untreated group (normal saline vehicle); G400 group (400 mg/kg GSE); T300 group (300 mg/kg TR); and G400 + T300 group (400 mg/kg/GSE and 300 mg/kg TR). All treatments were orally administered 30 min before a running exercise. Energy metabolism was measured using the exercise conditions described in a previous study: 18 m/min, slope of 8°, 65% of maximal oxygen consumption (maximum VO2) for 1 h [24]. The mice were placed in exercise metabolism chambers for adaptation 1 h before the experiment. Respiratory gas was measured using an open-circuit apparatus in accordance with the methods proposed in previous studies [2526].
In vivo antifatigue experimental design
Antifatigue experiments, including forced swimming, lactate, BUN, and glycogen tests, were performed as described in previous studies [2728]. To test the antifatigue effects of the treatments, the 60 mice were randomly divided into 6 groups (n = 10) and treated for 30 days as follows: an untreated group (saline); G100 group (100 mg/kg/day GSE); G200 group (200 mg/kg/day GSE); G400 group (400 mg/kg/day GSE); G200 + T150 group (200 mg/kg/day GSE and 150 mg/kg/day TR); and G400 + T300 group (400 mg/kg/day GSE and 300 mg/kg/day TR).
Forced swimming test
On day 30, the mice were treated with GSE or TR before a resting period of 30 min. The swimming test was performed as described previously by Xu et al. [28]. Briefly, the mice were placed in a swimming tank (50 × 50 × 40 cm), which was filled with water to a depth of 30 cm and maintained at 25 ± 1°C. The tail of each mouse was loaded with a bundle of lead pieces, which weighed 5% of the body weight. Exhaustion was determined by observing the loss of coordinated movements and a failure to return to the surface within 10 s. The swimming time was recorded immediately.
In vivo measurement of biochemical parameters
To detect the antifatigue effects of GSE and TR, blood and liver samples of the mice were collected, and biochemical parameters, such as lactate, BUN, and glycogen levels, were measured. To measure the lactate content, the blood of mice that swam (water temperature, 30 ± 1°C) for 10 min was collected at 3 time points, i.e., before swimming, immediately after swimming, and 20 min after swimming. The lactate content in the blood samples was measured using the lactate assay kit according to the manufacturer's instructions. To measure the BUN levels, blood samples were collected 60 min after swimming from mice that swam for 90 min at 30 ± 1°C. The measurement of BUN levels using the BUN kit was outsourced to Genia (Seongnam, Korea). The measurement of the glycogen content in the liver samples collected on day 30 was also outsourced to Genia.
Analysis of mRNA expression
Total RNA was isolated from the gastrocnemius of euthanized mice after exercise experiments and from L6 cells using the TRIzol reagent according to the manufacturer's instructions. cDNA was synthesized from 1 µg of total RNA using the Superscript III first-strand synthesis kit.
The mRNA expression of mitofusin-2 (Mfn2) in L6 cells was measured using quantitative real-time polymerase chain reaction (PCR) with a SYBR Green PCR mix (Thermo Fisher Scientific). The primer sequences for Mfn2 were 5′-AGCCTGGTGAGTGTGATGTG-3′ (forward) and 5′-CTCCGTGGTGACATCGATCC-3′ (reverse), and those for β-actin were 5′-CACGGCATTGTCACCAACTG (forward) and 5′-AACACAGCCTGGATGGCTAC-3′ (reverse). The cycling conditions were as follows: initial denaturation at 95°C for 10 min, followed by 40 cycles of denaturation at 95°C for 10 s, annealing at 60°C for 30 s, and extension at 72°C for 30 s. Relative mRNA levels were calculated using the 2−ΔΔCt method and normalized to those of β-actin.
The mRNA expression of CD36 and Pdk4 in muscle tissue was measured using an RT-PCR premix (Bioneer, Daejeon, Korea) installed at Korea Basic Science Institute (Seoul Center, Korea). The primer sequences were as follows: for CD36, 5′-GGCCAAGCTATTGCGACAT-3′ (forward) and 5′-CAGATCCGAACACAGCGTAGA-3′ (reverse); for Pdk4, 5′-CGCCTGGCCAATATCCTGAA-3′ (forward) and 5′-GCCTTGAGCCATTGTAGGGA-3′ (reverse); and for β-actin, 5′-CAGCTGAGAGGGAAATCGTG-3′ (forward) and 5′-CGTTGCCAATAGTGATGACC-3′ (reverse). The cycling conditions were as follows: initial denaturation at 95°C for 10 min, followed by 30 cycles of denaturation at 94°C for 10 s, annealing at 58°C for 30 s, and extension at 72°C for 30 s. The PCR products were separated on a 1% agarose gel.
Analysis of protein expression in vivo
The gastrocnemius muscles of mice were fixed with 4% formalin for 24 h, then embedded in paraffin, and cut to a thickness of 5 µm. After the specimens were deparaffinized and dehydrated, they were incubated with 3% H2O2 for 10 min and blocked with 3% BSA for 30 min. Afterward, the tissues were incubated with an anti-phosphorylated AMP-activated protein kinase (p-AMPK) primary antibody for 24 h at 4°C and stained with an Alexa Fluor 488-conjugated secondary antibody for 1 h at room temperature, followed by staining with 300 µM DAPI for 10 min at room temperature. The levels of p-AMPK were determined using confocal microscopy (LSM 780; Zeiss, Oberkochen, Germany) installed at Korea Basic Science Institute (Seoul, Korea).
Statistical analysis
Data are expressed as the mean ± SD. Significance was analyzed using the Student's t-test and Tukey's multiple range test for each pairwise comparison with the Prism 4.0 software (GraphPad Software, La Jolla, CA, USA). P < 0.05 was considered significant.
Go to :
RESULTS
Effects of TR and GSE on the viability of L6 cells
To explore the effects of TR and GSE on the viability of L6 cells, we performed a cell viability assay and observed cell morphology. Cytotoxicity was not observed up to 400 µg/mL GSE and up to 600 µg/mL TR (Fig. 1A and B, respectively). Furthermore, cell viability was not affected by cotreatment with 400 µg/mL GSE and 300 µg /mL TR (Fig. 1C and D). Therefore, subminimum concentrations of TR (150 µg/mL) and GSE (200 µg/mL) were used in subsequent experiments.
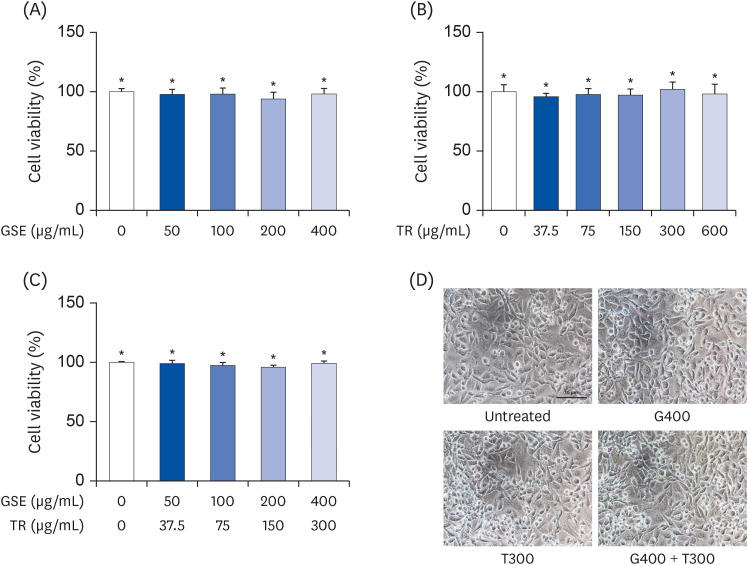 | Fig. 1Effects of TR and GSE on the viability of L6 cells. (A) The cells were treated with different concentrations (50, 100, 200, and 400 µg/mL) of GSE for 24 h. (B) L6 cells were incubated with different concentrations (37.5, 75, 150, 300, and 600 µg/mL) of TR for 24 h. (C) Cells were co- treated with different concentrations of GSE and TR for 24 h. (D) Cell morphology was observed using light microscopy. Data are expressed as the mean percentages (± SD) relative to the untreated group.GSE, ginseng extract; TR, taurine; G400, 400 µg/mL GSE; T300, 300 µg/mL TR.
*Denote no significant difference (P < 0.05; Tukey's multiple range test).
|
Effects of TR and GSE against exogenous H2O2-induced oxidative stress in L6 cells
To investigate the antioxidant effects of TR and GSE in H2O2-stimulated L6 cells, 8-oxoG expression and mitochondrial shape changes were observed under a fluorescence microscope. The cells were treated with TR (150 µg/mL) or GSE (200 µg/mL), with or without H2O2 (300 µM), for 24 h. As shown in Fig. 2A, the cell morphology remained the same with all treatments. H2O2 significantly increased the expression of 8-oxoG in the nuclei, whereas the patterns of 8-oxoG expression in the TR and GSE groups were similar to that in the untreated group (Fig. 2B). As shown in Fig. 2C and D, treatment with H2O2 significantly increased the fission form of mitochondria in the L6 cells. The mitochondrial length was 5.5 ± 0.63 µm in the untreated group, 0.54 ± 0.18 µm in the H2O2 group, 2.54 ± 0.55 µm in the H2O2 + G200 group, 2.82 ± 0.45 µm in the H2O2 + T300 group, and 4.56 ± 0.58 µm in the H2O2 + G200 + T300 group. As shown in Fig. 2E, H2O2 significantly decreased the expression of Mfn2 mRNA, while the presence of TR attenuated the downregulation of Mfn2 by H2O2.
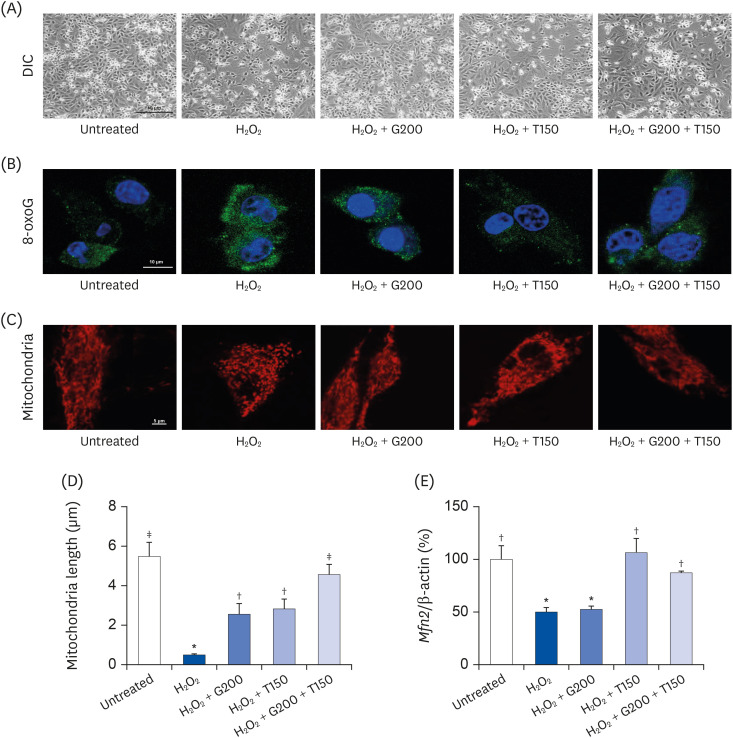 | Fig. 2Effects of TR and GSE on H2O2-stimulated L6 cells. (A) The images represent the cell morphology observed using light microscopy (200×). (B) Immunocytochemistry staining for 8-oxoG (green color). The nuclei were stained with DAPI (blue color). (C) Fluorescence microscopy detection of mitochondria stained with Mito Tracker™ Red FM for 30 min. (D) The lengths of mitochondria measured in the panel (C) photographs. (E) Mfn2 mRNA expression. Data are expressed as the mean ± SD.TR, taurine; GSE, ginseng extract; 8-oxoG, 8-oxoguanine; DAPI, 4′,6-diamidino-2-phenylindole; Mfn2, mitofusin-2; G200, 200 µg/mL GSE; T150, 150 µg/mL TR; DIC, differential interference contrast; H2O2, hydrogen peroxide.
*,†,‡Denote significant differences (P < 0.05; Tukey's multiple range test).
|
Effects of TR and GSE on mouse metabolism during acute exercise
Antifatigue effects are closely related to an increased oxygen uptake and the use of fat sources [29]. Mice were divided into 4 groups, namely, untreated, G400, T300, and G400 + T300. The mice were orally pretreated with GSE or TR and then allowed to rest for 30 min, followed by an exercise on a treadmill for 1 h. First, respiratory gas analysis was performed to explore whether TR or GSE contributed to the regulation of oxygen uptake and fat metabolism during acute exercise. As shown in Fig. 3A, the oxygen uptake significantly increased in the G400 + T300 group compared with that in the untreated group. Fat oxidation was found to occur at higher levels in the G400 + T300 group compared with those in the other groups (Fig. 3B). To confirm the synergistic effect of TR and GSE on energy metabolism during acute exercise, we analyzed the CD36 and Pdk4 mRNA expression and p-AMPK levels in mouse tissue specimens. As shown in Fig. 3C, the mRNA expression of CD36 and Pdk4 was higher in the T300 and G400 + T300 groups than in the other groups. Moreover, the p-AMPK level was higher in the G400 + T300 group than in the other groups (Fig. 3D).
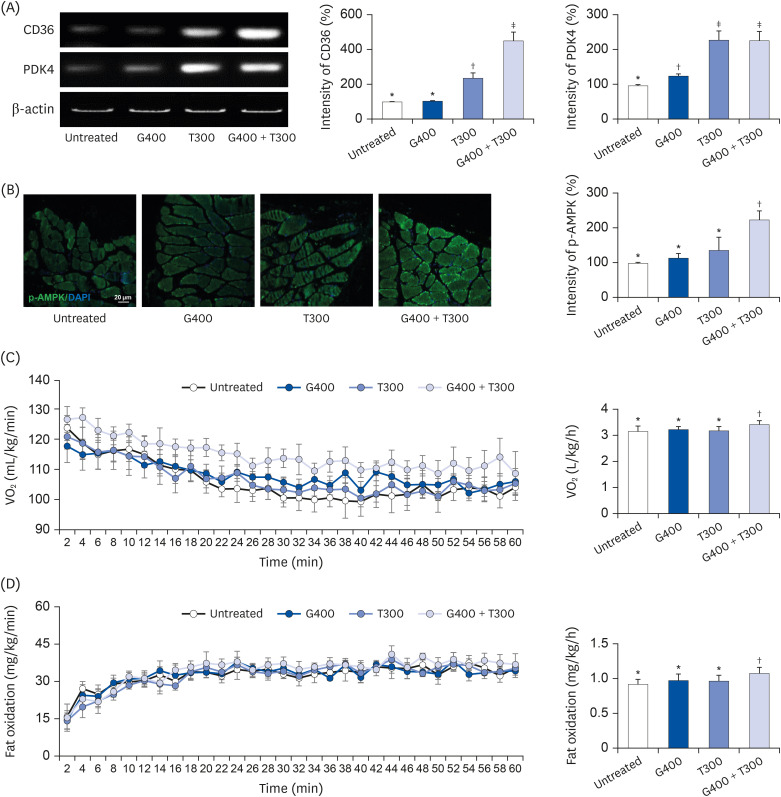 | Fig. 3Effects of TR and GSE on oxygen uptake and fat metabolism in mice during acute exercise. (A) CD36 and Pdk4 mRNA expression measured using reverse transcription–polymerase chain reaction. The graphs indicate the band intensity relative to that in the untreated group. (B) Immunohistochemical staining for p-AMPK. The graph shows the intensity of p-AMPK in muscle tissue. (C) Oxygen uptake data using an open-circuit method at 2-min intervals during exercise for 1 h. (D) Measurement of fat metabolism using the open-circuit method during exercise for 1 h. Data are expressed as the mean ± SD.TR, taurine; GSE, ginseng extract; CD36, cluster of differentiation 36; Pdk4, pyruvate dehydrogenase kinase 4; p-AMPK, phosphorylated AMP-activated protein kinase; G400, 400 mg/kg GSE; T300, 300 mg/kg TR; VO2, volume of oxygen.
*,†,‡Denote significant differences (P < 0.05; Tukey's multiple range test).
|
Effects of TR and GSE on tissue glycogen content in mice
Carbohydrates consumed in food are stored in the liver as glycogen, and depletion of glycogen causes fatigue [30]. Next, we measured the body weight and tissue glycogen content in mice treated orally with GS extract or TR for 30 days (Fig. 4A). As shown in Fig. 4B, the weight of mice increased daily, but there were no differences among the groups. The treatments with TR and GSE for 30 days did not result in any differences in the amount of glycogen compared with that in the liver of the control mice (Fig. 4C).
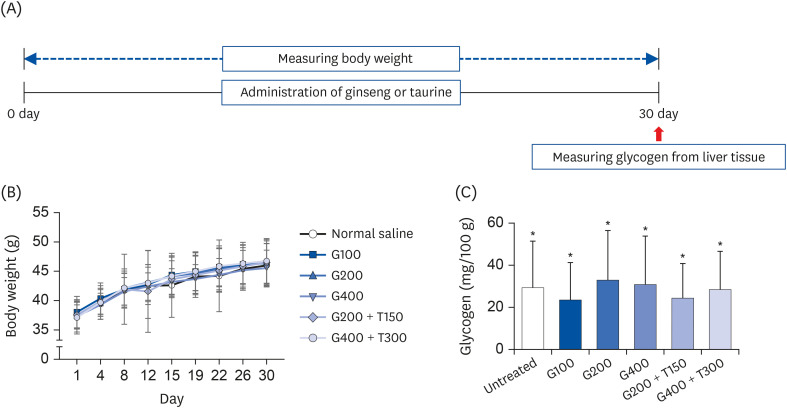 | Fig. 4Body weight and tissue glycogen levels in mice. (A) Schematic workflow for the 30-day experiment. (B) Body weight changes in mice over a period of 30 days. (C) The bar graphs indicate the glycogen levels. Data are expressed as the mean ± SD.TR, taurine; GSE, ginseng extract; G100, 100 mg/kg/day GSE; G200, 200 mg/kg/day GSE; G400, 400 mg/kg/day GSE; T150, 300 mg/kg/day TR; T300, 300 mg/kg/day TR.
*Denote no significant difference (P < 0.05; Tukey's multiple range test).
|
Effects of TR and GSE on fatigue-related parameters in mice after swimming
Fatigue-related parameters, including the blood lactate (Fig. 5A), BUN (Fig. 5C) and forced swimming time (Fig. 5E) were measured to investigate whether administration of TG and GSE for 30 days could improve fatigue. As shown in Fig. 5B and D, treatment with TG and/or GSE (G400, T300, and G400 + T300) for 30 days did not change the BUN and blood lactate levels in mice after swimming compared with those in the untreated group. However, the duration of forced swimming was longer in the G400 group than in the G400 + T300 group (Fig. 5F).
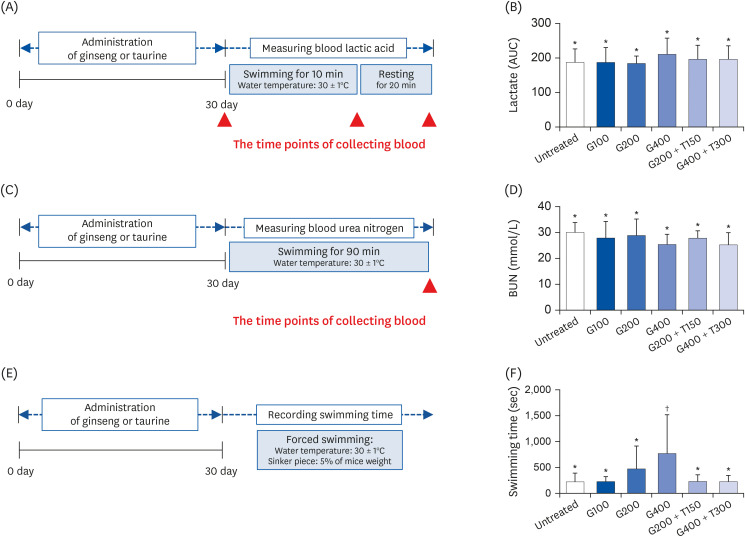 | Fig. 5Analysis of biochemical parameters after the swimming exercise in mice treated for 30 days. (A) Schematic workflow for measuring the blood lactic acid levels. (B) Blood lactic acid levels in each group. (C) Schematic workflow for measuring the BUN levels. (D) BUN levels in each group after swimming. (E) Schematic workflow for recording the duration of forced swimming. (F) Duration of forced swimming in each group. All data are expressed as the mean ± SD.TR, taurine; GSE, ginseng extract; G100, 100 mg/kg/day GSE; G200, 200 mg/kg/day GSE; G400, 400 mg/kg/day GSE; T150, 150 mg/kg/day TR; T300, 300 mg/kg/day TR; AUC, area under the curve; BUN, blood urea nitrogen.
*,†Denote significant differences (P < 0.05; Tukey's multiple range test).
|
Go to :
DISCUSSION
In the present study, we hypothesized that GSE could react with substances such as TR in the body to produce an antifatigue effect. Some studies have reported that TR may help relieve fatigue. However, as the amount of TR is regulated in vivo, its antifatigue effects remain controversial. Therefore, we explored the possibility of synergistic effects of TR and GSE on energy metabolism in vitro and in vivo.
Physical fatigue is a condition wherein physical activity is no longer spontaneous as a result of excessive training or high-intensity exercise, which can also increase ROS generation, contributing to fatigue [31]. Overproduction of ROS during generation and consumption of energy from nutrients can induce oxidative stress, resulting in the production of fatigue-inducing substances. To the best of our knowledge, studies on synergistic effects of GSE and TR on fatigue are lacking. In the present study, we found that GSE and TR effectively protected L6 cells stimulated with exogenous ROS, and ROS generation was significantly reduced in all experimental groups. Treatment with TR and GSE regulated mitochondrial fission and expression of 8-oxoG in H2O2-stimulated L6 cells. Therefore, we suggest that the combination of TR and GSE regulates ROS scavenging.
Elevated metabolism of fat as an energy resource is associated with antifatigue effects [32]. Compared with anaerobic systems that use only glycogen, aerobic systems can indefinitely use both glycogen and fat to produce ATP [33]. The cellular pathway of fat metabolism initiates the activation of CD36, which is involved in fat transportation to mitochondria [34]. In the present study, we observed a synergistic effect of the intake of TR and GSE on energy metabolism in response to acute exercise. Our results indicated that oxygen consumption in response to acute exercise was significantly induced upon treatment with TR and GSE, implying their synergistic effects on fat metabolism and the activation of the aerobic system. Furthermore, treatment with TR and GSE led to an increase in CD36 expression in the skeletal muscle during acute exercise. Interestingly, similar to previous studies, our study also showed an increase in Pdk4 expression. According to recent studies, the expression of skeletal muscle Pdk4is increased by treatment with TR alone [35] and red GSE alone [36]. Our study confirmed that the expression of Pdk4 was significantly higher in each treatment group, including the combination treatment than in the untreated group. These results suggest that TR and GSE may exert their antifatigue effects by increasing fat metabolism and activating the aerobic system.
In addition, we investigated whether TR and GSE could be effective as antifatigue agents after long-term administration. BUN and blood lactic acid levels are biochemical indicators related to mitochondrial function, and oxidative stress is related to energy production [37]. In this study, there were no changes in the BUN and lactic acid levels in the experimental groups. However, the antifatigue effect of long-term administration of GSE alone was greater than that observed upon coadministration of TR and GSE. Our results were consistent with those of a previous study, which examined the effect of a 2-week GSE intake and exercise-boosting fat metabolism [3839]. Apparently, there is no synergistic effect between TR and GSE upon long-term coadministration in mice. We speculate that excessive intake of substances such as TR cannot be expected to produce antifatigue effects because these supplements are quickly exerted to maintain homeostasis. Therefore, we suggest that TR and GSE are consumed for a short period of time to achieve an antifatigue effect.
In conclusion, our findings demonstrated that TR and GSE ameliorated mitochondrial dysfunction and oxidative stress in H2O2-stimulated L6 cells. TR and GSE also upregulated CD36 and Pdk4 expression to induce fat metabolism during an acute treadmill exercise in mice. Additionally, in swimming experiments, the effect of long-term treatment with GSE was greater than that of cotreatment with TR and GSE. These results suggest that TR and GSE may have beneficial effects against physical fatigue during acute exercise. However, we suggest that the biological response of the human body to long-term intake of TR or GSE is considered in future studies.
Go to :
 XML Download