

 PDF
PDF Citation
 Print
Print


INTRODUCTION
Non-communicable diseases have emerged as a new global agenda for women's health [12]. A growing body of evidence from the long-term cohort studies has contributed to understand and improve the health of women [3456]. Diet is one of the most important determinants of health throughout the life and across generations [78]. To ensure the research findings regarding the association between diet and disease outcome, an accurate assessment of dietary exposure is essential [9]. In the Nurses' Health Study (NHS), a large cohort study of female nurses in the United States (US), various dietary factors assessed by validated questionnaires have been identified as determinants of chronic diseases in women [10]. For example, the NHS found that high consumption of red meat or sugar-sweetened beverages and low consumption of dietary fiber or fruits and vegetables were associated with increased risk of coronary heart disease [11].
The Korea Nurses' Health Study (KNHS), which began in 2013, is a prospective study of young female nurses in Korea [12]. The purpose of the KNHS is to investigate the effects of occupational, environmental, and lifestyle factors on women's health. This long-term follow-up study of women of reproductive age is expected to contribute to framing of evidence-based policies and guidelines for women's health. In the KNHS, dietary information was assessed using the web-based food frequency questionnaire (FFQ) [12]. Given that FFQs are designed to evaluate the long-term dietary intake of the study population, the capacity of the FFQ to measure the participants' diet over an extended period, despite the within-person variation, should be evaluated. The FFQ is typically validated by comparing the reference methods, and its reproducibility is generally assessed by administering the same FFQ twice to the same group of participants. The FFQ used in the KNHS was initially developed for adults aged 19–64 years in the Korean National Health and Nutrition Examination Survey (KNHANES) [13]. It has been reported that the FFQ used in this study has acceptable reproducibility and modest validity [14]; significant associations between dietary factors, as assessed by this FFQ, and disease-related outcomes [1516171819] suggest that this FFQ appropriately captures diet-disease associations.
However, the performance of the FFQ in the KNHS has not been addressed. Therefore, the present study aimed to evaluate the reproducibility of the web-based FFQ used in the KNHS in women aged 20–45 years in Korea.
SUBJECTS AND METHODS
Participants and study design
The KNHS is an ongoing web-based prospective cohort study of female registered nurses aged 20–45 years that began in 2013 in Korea [12]. The protocol and questionnaires of the KNHS are based on the NHS3, an ongoing web-based prospective study in the US and Canada that began in 2010 [20]. In the first phase of the KNHS (March 2013–December 2015), survey modules 1–4 and pregnancy modules were open to participants. The initial baseline survey (module 1) was conducted from July 2013 to November 2014, and a total of 20,613 women were enrolled. Participants who responded to the module 1 survey were invited through a text message to continue with subsequent online surveys. The second phase of the study was conducted from June 2016 to March 2019, in which participants provided answers to survey modules 5–7. The third phase began in March 2019 with module 8, and module 9 in the third phase was administered beginning October 2020. Some questions such as job status, disease history, and reproductive factors have been repeated in the modules. The KNHS has been described in detail elsewhere [12].
In the baseline survey module 1, participants were asked about demographic characteristics, weight and height, disease history, reproductive factors, employment, occupational exposure, and lifestyle factors, including alcohol consumption and smoking status. In the subsequent survey module 2, usual dietary intake during the past year was assessed using the web-based FFQ. For the current analysis, we used dietary data collected from May 2014 to February 2019. Among the 15,355 participants who agreed to participate in module 2, a total of 14,485 participants completed the FFQ. We aimed to recruit 300 participants in November 2019 to examine the reproducibility of the FFQ. In epidemiological studies, a sample size of about 100 to 200 participants is reasonable to evaluate the performance of the FFQ [9].
Among those who had completed the first FFQ (FFQ1), we excluded women who were pregnant at the time of dietary assessment (n = 684), had been diagnosed with a chronic disease, including type 2 diabetes, hypertension, cardiovascular diseases, or cancer (n = 743), or had a short interval (< 9 months) from the date of FFQ1 completion to November 2019 (n = 3). We further excluded 875 participants who reported an implausible energy intake (< 500 kcal/day, > 95th percentile of energy intake). Consequently, 12,218 participants were eligible for re-contact, and 900 individuals were selected as potential participants for this study as follows. We initially included potential participants who had completed the FFQ1 within 9 months to less than 1 year (n = 151) and selected the rest of the participants using stratified random sampling (n = 749). In other words, we oversampled participants who had recently completed the FFQ1 to minimize the effect of dietary change over time. Participants who had completed the FFQ1 ≥ 1year prior were stratified into 3 groups by time since the completion of the FFQ1 (1 to < 2.5 years, 2.5 to < 4 years, and ≥ 4 years) and were randomly selected in a ratio of 3:2:1 using PROC SURVEYSELECT in SAS (SAS Institute Inc., Cary, NC, USA).
The questionnaire comprised the second FFQ (FFQ2) and questions on reproductive factors (pregnancy, childbirth, and breastfeeding), history of chronic diseases (type 2 diabetes, hypertension, cardiovascular diseases, and cancer), and occupational status (current job status and shift work information). The invitation to participate in the survey was sent to potential participants via text message that included a link to the questionnaire. We sent a reminder message to non-responders 3 days after sending the web-based questionnaire. The online survey was closed when the number of respondents reached 300. A coffee coupon was given to participants as an incentive. Among participants enrolled from November 5 to November 20, 2019 (n = 300), we excluded participants who were pregnant, had given birth, or had breastfed an infant in the last year (n = 45), had been diagnosed with a chronic disease (n = 15), or reported an implausible energy intake (n = 4). Consequently, a total of 243 women were included in this analysis. The study was approved by the Institutional Review Board of the Ewha Womans University (ewha-201904-0012-05). All participants provided the informed consent after understanding the purpose of the study.
The FFQ
The semi-quantitative FFQ was developed to assess the usual dietary intake over the past year in Korean adults [13]. The validity of the FFQ among 126 Korean adults have been described in detail elsewhere [14]. In brief, the validity of the FFQ was assessed by comparing energy as well as intake of thirteen nutrients between the FFQ findings and 4 seasonal 3-day dietary records (DR). The correlation coefficients between the first FFQ and 12-day DR ranged from 0.27 to 0.45 (mean r = 0.38) for energy and nutrients and from 0.15 to 0.64 (mean r = 0.39) for energy-adjusted and de-attenuated nutrients [14]. The FFQ includes 112 food items commonly consumed by Korean adults. Participants were asked to select their average frequency of consumption over the past year by selecting one of nine frequency categories (never or seldom, once per month, 2–3 times per month, once per week, 2–4 times per week, 5–6 times per week, once per day, twice per day, or three times per day). Participants were also asked to select their usual portion size as small, medium, or large. In the KNHS, figures for the portion sizes of food items were provided to aid the estimation of portion sizes. To calculate the daily intake, the selected frequency category for each food item was converted to a daily frequency of consumption. Daily intakes of energy, nutrients, and foods were calculated by multiplying the frequency of consumption by the nutrient content of the selected portion size. The nutrient database for the FFQ in the KNHANES was primarily based on the food composition table from the Korean National Academy of Agricultural Science and that provided by the Korea Disease Control and Prevention Agency [21].
Statistical analysis
We compared the baseline characteristics of 300 participants who were administered FFQ2 with those of all study participants of the KNHS (n = 20,613). Descriptive statistics were presented as mean and SD for continuous variables, and as number and proportion (%) for categorical variables. Among the 243 subjects who were included in the reproducibility analysis, group means and SDs were separately calculated from FFQ1 and FFQ2 for daily intake of energy, % energy from macronutrients (protein, fat, and carbohydrate), and twenty-two nutrients. We used a paired t-test to examine the differences in energy and nutrient intakes between the FFQ1 and FFQ2.
To assess the reproducibility, we estimated the relative ranking of participants by the test–retest responses. We calculated their Pearson's correlation coefficients for energy and nutrients and Spearman's correlation coefficients for food items. We also calculated their energy-adjusted nutrient intake using a residual method to estimate energy-adjusted Pearson’s correlation coefficient [9]. To improve the normality of data, energy, % energy from macronutrients, and nutrient intake values were log-transformed. We also calculated the agreement in quartile classification of the dietary intake between FFQ1 and FFQ2. The percentages of participants classified into the same quartile, the same or adjacent quartile, and the opposite quartile were calculated. A few food items were not divided into quartiles because of skewed distribution and therefore we did not compute % quartile agreement. Because a longer time interval between FFQs decreases the reproducibility due to true changes in diet as well as variations in response [9], we also evaluated the mean daily intakes and reproducibility of FFQs administered in a relatively short interval. A time interval of < 3 years was chosen to perform analysis with the sample size of more than 100 (n = 139).
All statistical analyses were performed using SAS statistical software version 9.4 (SAS Institute Inc.). All hypothesis tests were evaluated using 2-tailed tests of significance at P-value < 0.05.
RESULTS
The baseline characteristics of the current reproducibility study respondents did not differ from those of all cohort participants in terms of age, body mass index, alcohol consumption, smoking status, education levels, or marital status (Table 1). Among the 243 women included in this study, the mean time interval between FFQ1 and FFQ2 was 2.76 years and ranged from 9.24 months to 5.64 years. In addition, the mean time interval between FFQs was 1.74 years among 139 women who completed FFQ2 within the 3 years since FFQ1 administration.
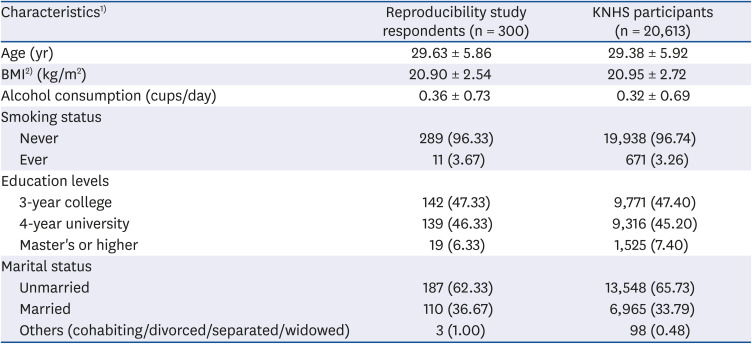
Table 1
Characteristics of the respondents of the reproducibility study and the cohort participants
Values are presented as mean ± SD or number (%).
KNHS, Korea Nurses' Health Study; BMI, body mass index.
1)Number may not total to 300 or 20,613 for each characteristic due to missing values. Data are missing for BMI (n = 4 among reproducibility study respondents; n = 93 among overall participants) and alcohol consumption (n = 2 among reproducibility study respondents; n = 31 among overall participants).
2)BMI was calculated as weight divided by height squared (kg/m2).
![]()
Mean daily intakes, correlation coefficients, and quartile agreement between FFQs are shown in Table 2. Mean daily intakes were lower in FFQ2 than in FFQ1, except for % energy from protein and fat, carotene, and vitamin C intakes. Pearson's correlation coefficient between FFQ1 and FFQ2 was 0.46 for energy intake. The correlation coefficients between FFQ1 and FFQ2 ranged from 0.41 for carbohydrate to 0.55 for protein or iron (median r = 0.51) for nutrient intake. Adjustment for energy intake attenuated the correlation coefficients, except for the correlation coefficient for carbohydrate. The correlations ranged from 0.16 for carotene to 0.46 for carbohydrate (median r = 0.36) for energy-adjusted nutrient intake. The correlation coefficients for % energy from macronutrients were similar to those of energy-adjusted macronutrients using the residual methods. The median percentages of the same quartile, the same or adjacent quartile, and the opposite quartile classification for energy and nutrients were 42%, 82%, and 4%, respectively.
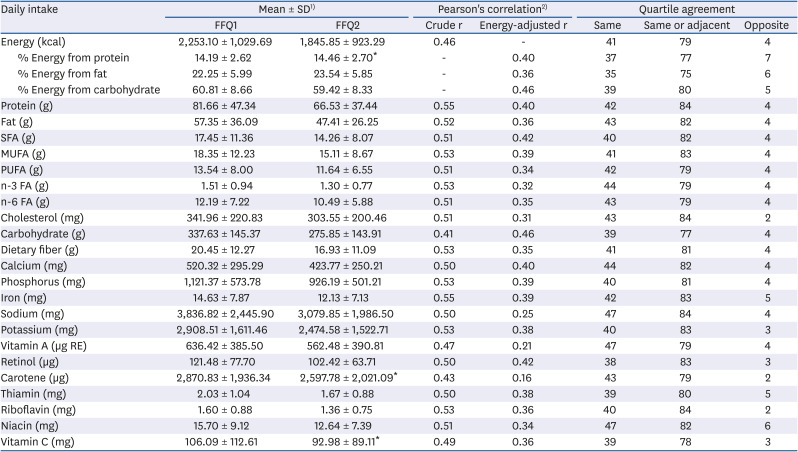
Table 2
Mean daily intakes and reproducibility of energy and nutrients between FFQ1 and FFQ1 (n = 243)
FFQ1, the first food frequency questionnaire; FFQ2, the second food frequency questionnaire; SFA, saturated fatty acids; MUFA, monounsaturated fatty acids; PUFA, polyunsaturated fatty acids; FA, fatty acids.
1)Non-significant differences in mean intakes at α = 0.05 between FFQs were noted as “*”.
2)All correlation coefficients were statistically significant at α = 0.05.
![]()
The same sets of analyses for energy and nutrients were conducted among women who completed FFQ2 during the period from 9 months to less than 3 years since they had completed FFQ1 (Table 3). Mean daily intakes were generally lower in FFQ2 than in FFQ1; however, there were no statistically significant differences between the 2 FFQs in terms of fat (fat subtypes and cholesterol), vitamin A, retinol, carotene, and vitamin C intakes. The reproducibility was slightly increased among women who had a shorter time interval. Pearson's correlation coefficient between FFQ1 and FFQ2 for energy intake was 0.49. For nutrient intake, correlation coefficients between FFQ1 and FFQ2 ranged from 0.42 for carbohydrate to 0.62 for potassium (median r = 0.57) for raw nutrients and from 0.11 for carotene to 0.49 for potassium or retinol (median r = 0.39) for energy-adjusted nutrients. The median percentages of the same quartile, the same or adjacent quartile, and the opposite quartile classification for energy and nutrients were 45%, 82%, and 4%, respectively.
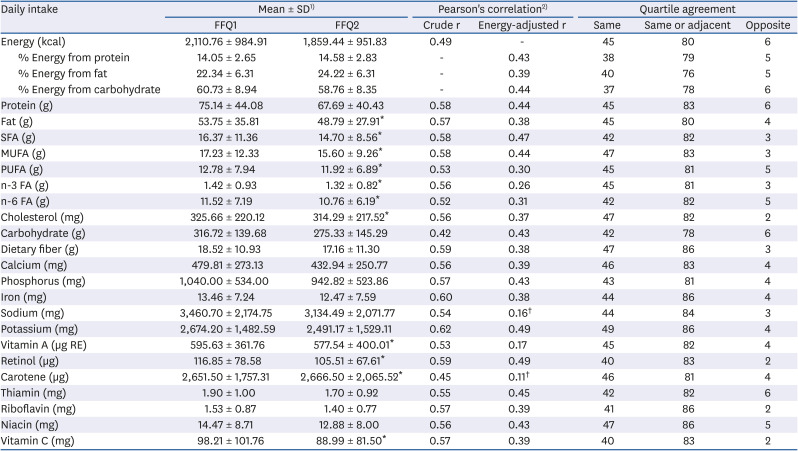
Table 3
Mean daily intakes and reproducibility of energy and nutrients between FFQ1 and FFQ2, < 3 years apart (n = 139)
FFQ1, the first food frequency questionnaire; FFQ2, the second food frequency questionnaire; SFA, saturated fatty acids; MUFA, monounsaturated fatty acids; PUFA, polyunsaturated fatty acids; FA, fatty acids.
1)Non-significant differences in mean intakes at α = 0.05 between FFQs were noted as “*”.
2)Correlation coefficients were statistically significant at α = 0.05, unless otherwise noted as “†”.
![]()
Spearman's correlation coefficients and quartile agreement of 40 food items according to the time interval between FFQs are shown in Table 4. The correlation coefficients ranged from 0.25 for cooked rice to 0.72 for beer (median r = 0.41) among the 243 women and from 0.24 for kimchi stew/stir-fried kimchi to 0.74 for beer (median r = 0.45) among the 139 women who completed FFQ2 within < 3 years since FFQ1. The median percentages of the same quartile, the same or adjacent quartile, and the opposite quartile classification were 40%, 78%, and 6%, respectively, among the 243 women and 42%, 79%, and 5%, respectively, among the 139 women. The correlation coefficients and quartile agreements of all food items of the FFQs are listed in Supplementary Table 1. Spearman's correlation coefficients of food intake between FFQ1 and FFQ2 ranged from 0.18 for persimmon/dried persimmon to 0.72 for beer (median r = 0.39) among the 243 women and from 0.10 for strawberry to 0.74 for beer (median r = 0.41) among 139 women with a time interval of < 3 years since FFQ1. The median of the same and opposite classification was 40% and 6% among the 243 women and 42% and 6% among the 139 women.
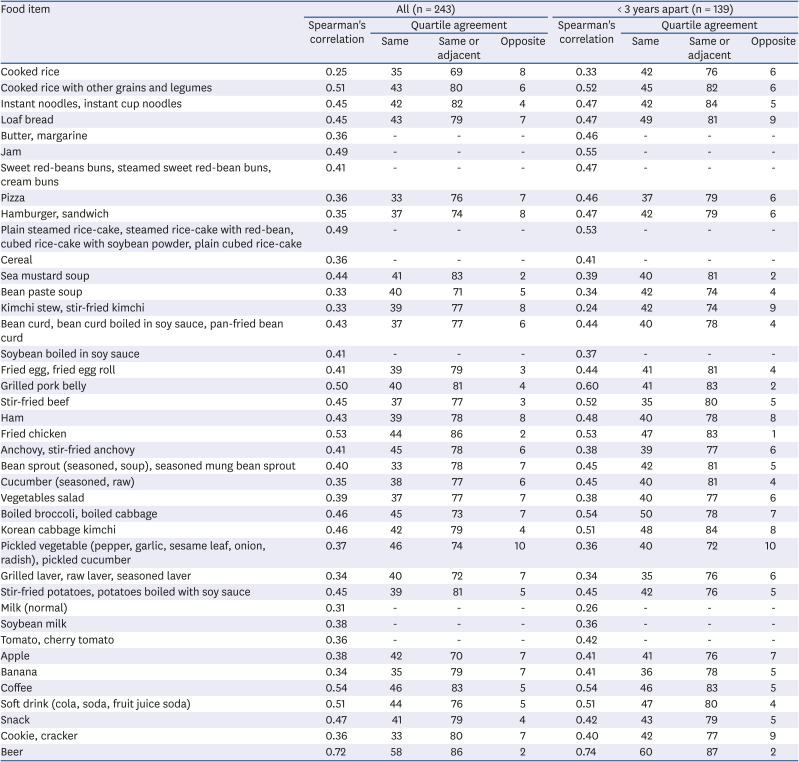
Table 4
Reproducibility of selected food items between the first and second food frequency questionnaires
![]()
DISCUSSION
This study aimed to assess the reproducibility of the web-based FFQ used in the KNHS among 243 female nurses. A 112-item FFQ was administered twice at a mean interval of 2.76 years, ranging from 9.24 months to 5.64 years. The mean daily intakes of energy and nutrients were lower from FFQ2 than from FFQ1. The median of reproducibility correlation coefficients was 0.51 (range, 0.41–0.55) for energy and raw nutrients and 0.41 (ranged, 0.25–0.72) for food items. The median percentages of participants who were classified into the same quartile and the same or adjacent quartile were 42% and 82%, respectively, for energy and nutrients. For food items, the median percentages of participants who were classified into the same quartile and the same or adjacent quartile were and 40% and 78%, respectively.
The following reasons may have caused the differences in mean intakes between FFQ1 and FFQ2: aging, changes in dietary intakes, or random variation. However, although the comparison of mean intakes is a simple approach for evaluating the performance of FFQs, it does not provide information on the ability of the FFQ to rank individuals [9]. Correlations between the repeated measures of FFQs could provide useful information for distinguishing among individuals by dietary intakes. We found a moderate correlation between nutrient intakes from FFQ1 and those from FFQ2. In our study, energy adjustment slightly attenuated the correlation coefficients. The attenuation of the correlation coefficients for the reproducibility of the FFQ has also been observed in some previous studies in Korea [222324], Japan [252627], and Western countries [282930]. Although the underlying reasons remain unclear, adjustment for energy intake could add unexplained variation.
We included women who had a time interval between FFQs that ranged from 9.24 months to 5.64 years. Because FFQ reproducibility has been often evaluated by assessing diet using the same questionnaires 1-year apart, we limited the analysis to women who completed FFQ2 within the 3 years following completion of FFQ1. Reproducibility was slightly higher when we limited the analysis to women with a shorter interval from FFQ1 completion than those with a longer interval. A few studies examined temporal changes in the reproducibility of the FFQ and observed a decline in correlation coefficients over time [3132]. It may be natural that we observed slightly higher correlations because diet can change over time. The mean time interval between FFQs was 2.76 years among all participants in our study, comparable to those of several previous studies reporting various time intervals between FFQs, ranging from 9 months to 5.7 years [31429333435].
Our results are comparable with those of a previous study that examined the reproducibility of the same FFQ [14]. In the previous validity and reproducibility study of the FFQ, FFQs were administrated twice at 9 months apart to 126 Korean men and women aged 20–65 years. The median correlation coefficients between the 2 FFQs were 0.55 (range, 0.53 for phosphorus to 0.62 for fat) for energy and thirteen nutrients and 0.61 (range, 0.33 for rice to 0.87 for alcoholic beverages) for eleven food groups. The median proportions of participants whose dietary intakes were classified into the same or adjacent quartile was 83% for energy and nutrients, and 87% for food groups. The median of correlations for energy-adjusted nutrients and food groups was 0.55 for both nutrients and food groups [14].
Similar reproducibility results have been reported in several previous Korean studies. The validity and reproducibility of the FFQ were assessed among middle-aged men and women [222336] and young women [24] in Korea. The correlation coefficients for the reproducibility of the FFQ generally ranged from 0.3 to 0.6 for energy and nutrients [22232436], and energy adjustment attenuated the correlation coefficients in most studies [222324]. For example, in the Korean diet and cancer research, 115 men and 173 women aged 30–66 years completed 2 FFQs administered approximately 9 months apart [23]. Among the 173 women, the correlation coefficients between 2 FFQs ranged from 0.42 for vitamin C to 0.59 for fat (median r = 0.54) for energy and fifteen nutrients and from 0.24 for niacin to 0.57 for calcium (median r = 0.49) for energy-adjusted nutrients. For eleven food groups, the median (range) correlation coefficient was 0.56 (0.35 for fruit to 0.72 for alcoholic beverages) for unadjusted values and 0.50 (0.36 for fruit to 0.72 for alcoholic beverages) for energy-adjusted values among women [23].
Our results are also consistent with findings of studies in other populations. The correlation coefficients for the reproducibility of the FFQ generally ranged from 0.4 to 0.7 for energy and nutrients [262733343537383940414243444546474849] and ranged from 0.3 to 0.8 for foods [2627333538414647505152] among female adults. Most previous studies used a self-administered FFQ to assess dietary intake over the preceding year and re-administered the questionnaire at approximately 1-year interval. For the reproducibility of food intake, correlations were the highest for alcoholic beverages in several studies [2627333551]. In the US Nurses' Health Study, 1,497 female nurses self-administered 2 FFQs 9 months apart, and the mean (range) of correlation coefficients was 0.57 (0.40 for trans-fatty acids to 0.71 for vitamin E) for energy-adjusted nutrients and 0.56 (0.34 for ready-made pie to 0.76 for tea) for foods [38]. In the Shanghai Women's Health Study, 2 FFQs were administered approximately 2 years apart to 191 Chinese women by interviewers [46]. In this study, the mean (range) of correlation coefficients was 0.51 (0.30 for carotene to 0.59 for retinol) for energy and nutrients and 0.49 (0.37 for soy foods to 0.66 for fruits) for food groups. The mean (range) percentage of the same quartile classification was 36% (32% to 39%) for energy and nutrients and 41% (35–51%) for food groups.
Web-based surveys have several advantages over traditional survey methods, such as access to individuals at distant locations, ability to collect real-time data, low administration cost, and ease of follow-up [5354]. Because of the advances in technologies and increased internet access, online surveys have become common research tools. Dietary assessment methods are also integrated with novel technologies in current epidemiological research [55]. FFQs are suitable for a web-based survey because the respondent's burden is modest and they can be self-administered. In addition, data processing of the FFQ is inexpensive and can be easily computerized [9]. Paper and web-based FFQ have shown comparable performance in several studies [56575859]. Reproducibility of the web-based FFQs has shown moderate-to-high correlation coefficients among adults [6061626364] and adolescents [656667]. Most studies used web-based FFQs that assess dietary intake over the preceding month, and FFQs were administered twice at one-month interval [60616264656667].
The strength of this study is a large sample size and extensive evaluation of various nutrients and foods for the reproducibility of the FFQ. The limitation of our study is a relatively long-time interval between FFQs compared to the previous studies. However, when we examined the reproducibility among those with a shorter time interval between FFQs, we found acceptable reproducibility. Our results were comparable to those from previous studies that examined the reproducibility of the FFQ with intervals of 9 months or 1 year. Further research, including that on the association of diet and disease, is needed to support the validity of the questionnaire.
In conclusion, the FFQ used in the KNHS study has acceptable reproducibility. The estimates of reproducibility in our study are similar to a study that examined the reproducibility of the same FFQ in Korean men and women, and studies that evaluated the reproducibility of FFQs among women. This study may be a useful resource for testing future KNHS hypotheses about dietary roles in women's health and wellness.
 XML Download