Introduction
Background/rationale
Objectives
Methods
Ethics statement
Study design
Setting
Participants
Table 1.
Data sources/measurement
Table 2.
Values are presented as median (interquartile range) considering the skewness of the data distribution or number (%), unless otherwise stated. Comparisons are shown between years (‘a’, ‘b’, ‘c’, and ‘d’ denote no statistical significance if they are the same letter, and show statistical significance if they are different letters).
NA, not assessed.
Statistical significance was calculated using a)the Cochran–Armitage test or the Kruskal-Wallis test and Wilcoxon rank-sum test with the Bonferroni correction.
Items of the measurement tool (survey questionnaire)
Definition of training environment attributes
Classification of institutions by type
Grouping of specialties
Working conditions
Learning environment
Validity and reliability testing
Bias
Study size
Statistical methods
Results
Participants
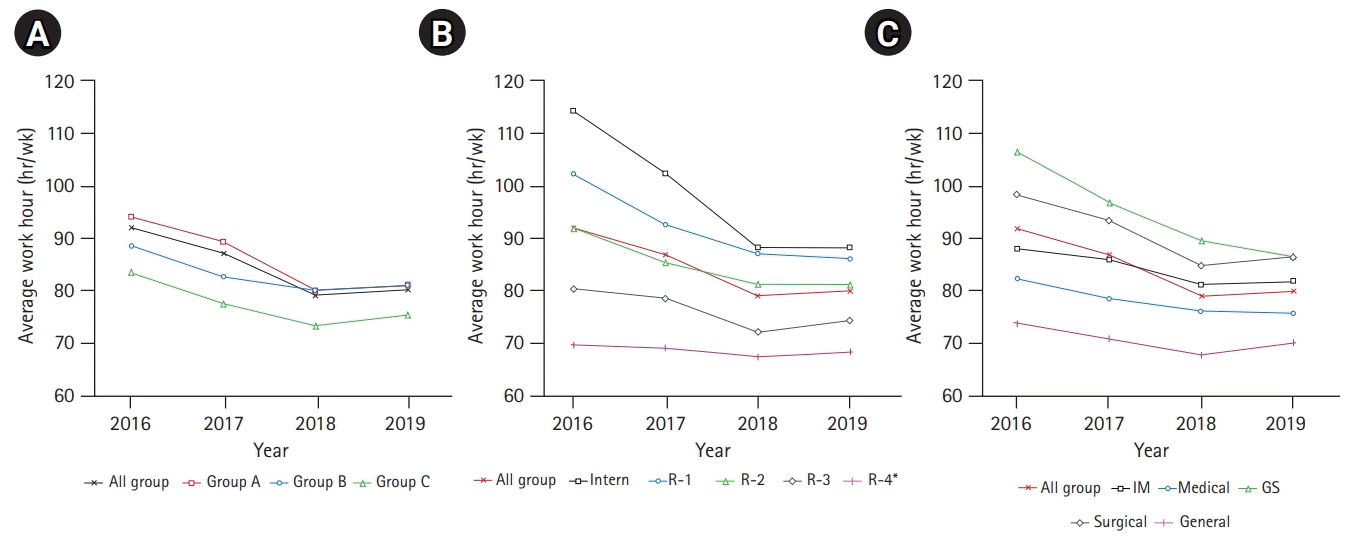
Changes in working hours
Fig. 1.

Change in the workload of internal medicine and general surgery residents
Table 3.
Values are presented as median (interquartile range) considering the skewness of the data distribution. Statistical significance was calculated using the Kruskal-Wallis test and Wilcoxon rank-sum test with the Bonferroni correction. Comparisons are shown between years (‘a’, ‘b’, ‘c’, and ‘d’ denote no statistical significance if they are the same letter, and show statistical significance if they are different letters).
NA, not assessed.
Changes in the learning environment
Table 4.
Values are presented as number (%) or median (interquartile range) considering the skewness of the data distribution, unless otherwise stated. Group A: tertiary hospitals; group B: general hospitals with 100 or more training physicians; group C: general hospitals with less than 100 training physicians, single-specialty hospitals, or other teaching institutions not classified in groups A or B. Comparisons are shown between years (‘a’, ‘b’, ‘c’, and ‘d’ denote no statistical significance if they are the same letter, and show statistical significance if they are different letters).
NA, not assessed; PGY, postgraduate year.
Statistical significance was calculated using a)the Cochran–Armitage test or the Kruskal-Wallis test and Wilcoxon rank-sum test with the Bonferroni correction.
Non-essential physician tasks and sense of educational deprivation due to the institution’s PAs
Table 5.
Group A: tertiary hospitals; group B: general hospitals with 100 or more training physicians; group C: general hospitals with <100 training physicians, single-specialty hospitals, or other teaching institutions not classified in groups A or B. Statistical significance was calculated using the Cochran–Armitage test or the Jonckheere-Terpstra test.
PA, physician assistant; PGY, postgraduate year; NA, not assessed.
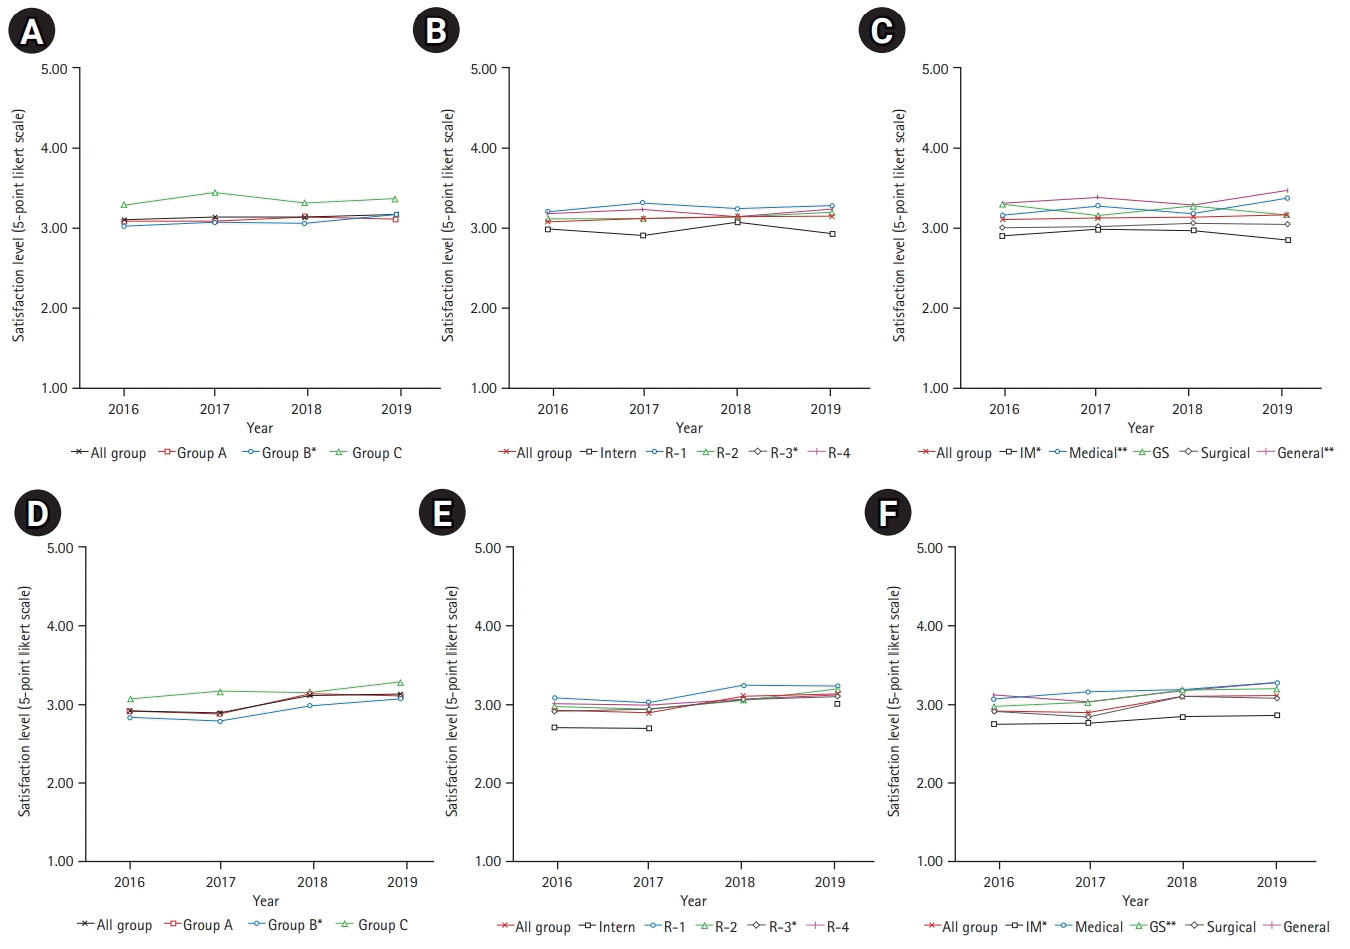
Satisfaction with the working environment
Fig. 2.


 PDF
PDF Citation
 Print
Print


 XML Download