Introduction
Methods
Ethics statement
Population
Research instrument
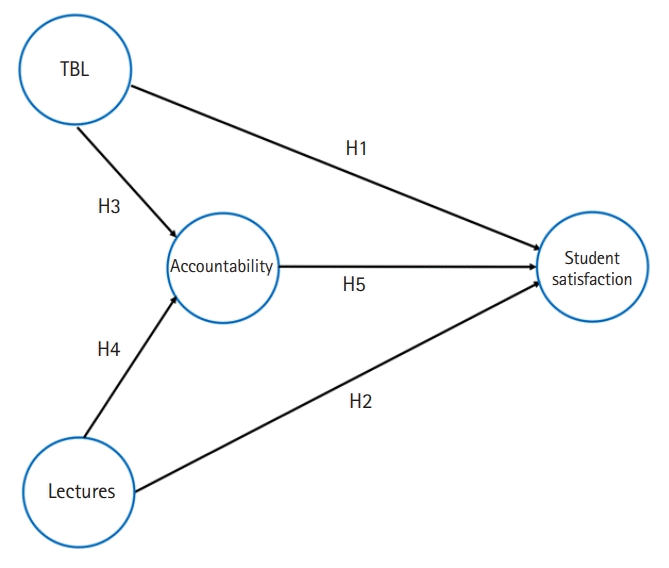
Conceptual model
Study power
Data collection cleaning and analysis
Procedure for model assessment and statistical analysis
Results
Demographics
Table 1.
| Characteristic | No. (%) |
|---|---|
| Gender | |
| Female | 71 (71.70) |
| Male | 28 (28.30) |
| Age range (yr) | |
| 16–24 | 92 (92.90) |
| 25–24 | 4 (4.00) |
| 35–45 | 1 (1.00) |
| >45 | 2 (2.00) |
| Entry qualificationa) | |
| A level/IB | 64 (64.64) |
| Foundation year | 29 (29.29) |
| Others | 14 (14.14) |
| Returning after break | 4 (4.00) |
| Ethnicity | |
| White | 64 (64.65) |
| Asian/Asian British | 12 (12.12) |
| Black/African/Caribbean/Black British | 10 (10.10) |
| Mixed/multiple ethnic groups | 9 (9.09) |
| Others | 3 (3.03) |
| Prefer not to say | 1 (1.01) |
| Residence status | |
| United Kingdom/EU | 95 (96.00) |
| Non-United Kingdom/non-EU | 4 (4.00) |
| Discipline | |
| Biomedical science | 52 (52.50) |
| Foundation: introduction to clinical sciences | 29 (29.30) |
| Pharmacy | 18 (18.20) |
Confirmatory tetrad analysis
Table 2.
Reflective measures
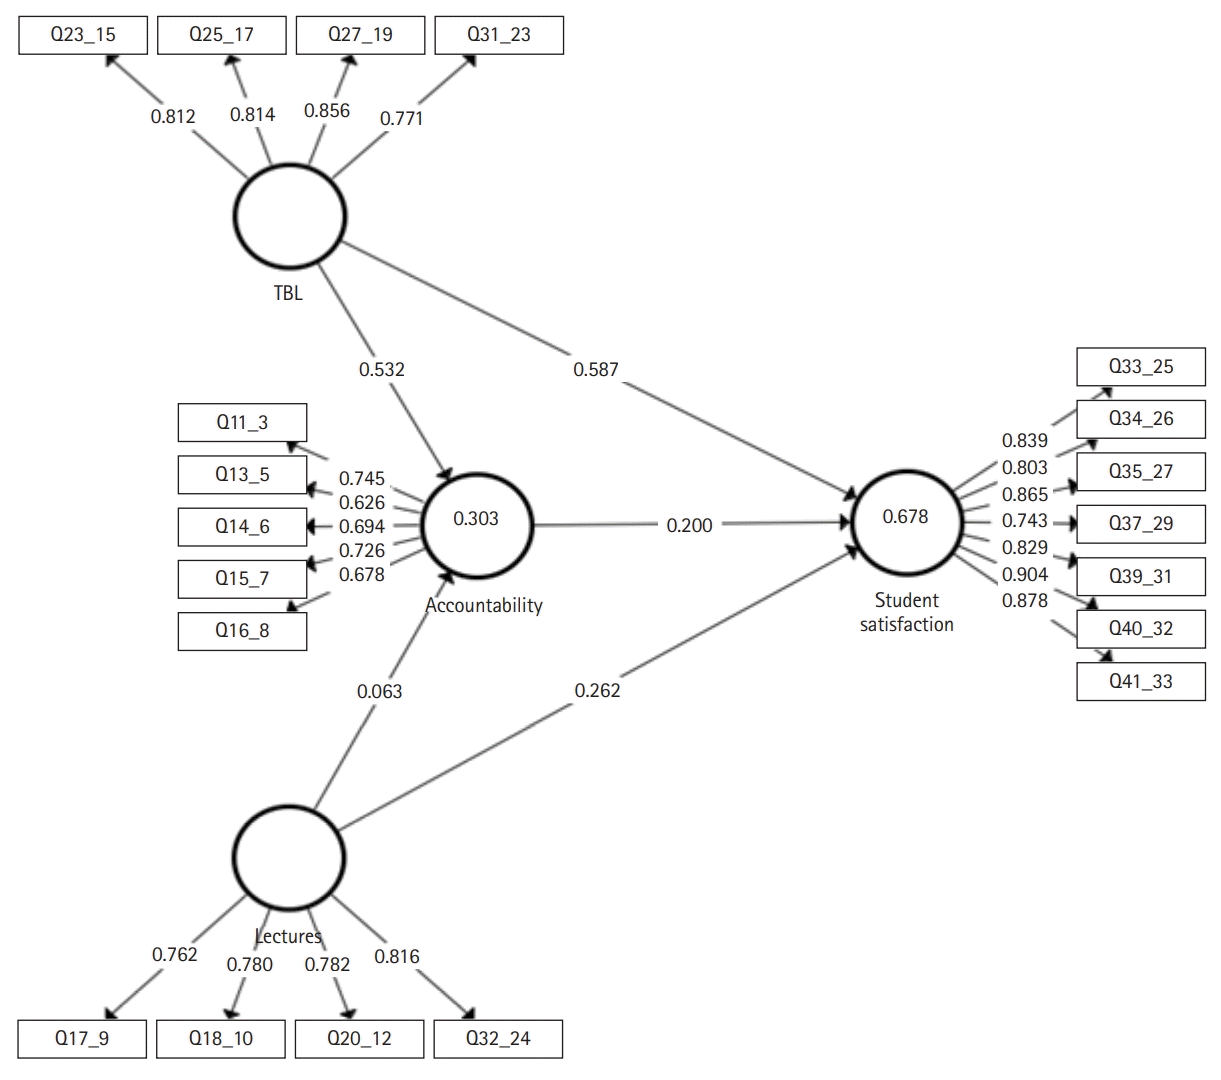
Fig. 2.

Evaluation of the measurement model (outer model)
Reliability and validity
Table 3.
Discriminant validity
Table 4.
Evaluation of the structural model (inner model)
Co-linearity among constructs
Testing the hypotheses (H1 to H6)
In-sample prediction: significance and relevance of path coefficients
Table 5.
Table 6.
Statistically significant at P-value <0.05 for the total effects.
Direct effect, a relationship linking 2 constructs with a single arrow; Indirect effect, a sequence of relationships with at least one intervening construct involved; Total effect, the sum of the direct effect and all indirect linking 2 constructs; CI, confidence interval; Bca, bias-corrected and accelerated bootstrap; NA, not applicable; TBL, team-based learning.


 PDF
PDF Citation
 Print
Print


 XML Download