Construction of the survey questions was guided by the literature and by consultation with medical education experts at UFCOM; therefore, content validity was fulfilled. As for construct validity, responses to the 9 survey items were subjected to exploratory factor analysis using squared multiple correlations as communality estimates. The independent-sample t-test was used for comparisons between groups. All statistical analyses were conducted using SAS ver. 9.4 (SAS Institute Inc., Cary, NC, USA). Graphs were constructed using IBM SPSS ver. 25.0 (IBM Corp., Armonk, NY, USA). The principal factor method was used to extract the factors, followed by oblique rotation to aid interpretability using the Promax method. The screen test suggested 3 meaningful factors, and these factors were retained for rotation. In interpreting the rotated factor pattern (
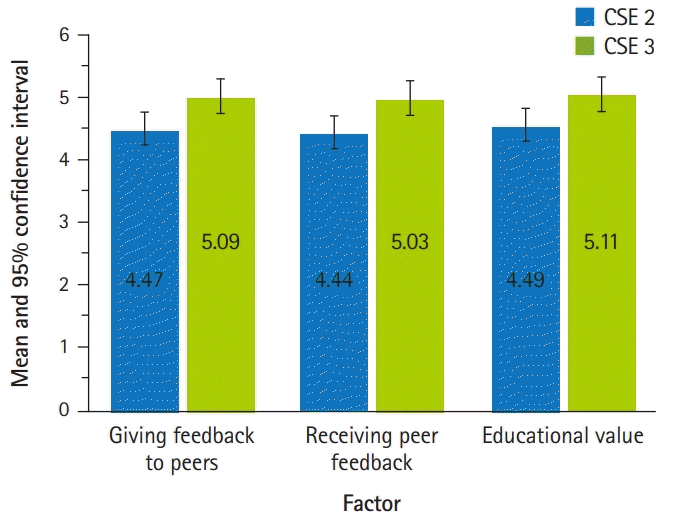
Table 2), an item was said to load on a given factor if the factor loading was 0.50 or greater for that factor. Using these criteria, groups of 3 items were found to load on each of the 3 factors. Items 1, 2, and 3 were found to load on the first factor, which was labeled “giving feedback to peers.” Items 4, 5, and 6 loaded on the second factor, labeled “peer feedback received.” Items 7, 8, and 9 loaded on the third factor, labeled “educational value” of the peer feedback session. Using the oblique rotation method allows factors to be correlated. The correlation between factor 1 and factor 2 was r=0.37, the correlation between factor 1 and factor 3 was r=0.47, and the correlation between factor 2 and factor 3 was r=0.65. These 3 factors accounted for 72% of the variance in student responses. Additionally, a non-refined method was used to compute factor scores, in which student responses were averaged for each of the 3 factors (subscales) described. The mean factor scores for the 2 groups and the 95% confidence interval (CI) for the mean are included in
Table 2 and depicted in
Fig. 1. The Cronbach α coefficient was also computed to measure the internal consistency of the survey items common to both groups in the aggregate and for each group.
Table 1 provides descriptive statistics for the survey items for all participants and by CSE level. For the aggregated data, the internal consistency of the survey items, as measured by the Cronbach α coefficient, was 0.89; for CSE2, it was 0.88 and for CSE3, 0.86.
Fig. 1.
Students’ perception of peer-assisted learning sessions: CSE 2 versus CSE 3. CSE, clinical skills examination.


Table 2.
Factor loadings and factor scores by group
|
Item |
Rotated factor pattern |
Mean (95% confidence interval) factor score |
|
Giving feedback to peers (factor 1) |
Receiving feedback from peers (factor 2) |
Educational value (factor 3) |
|
Factor 1 |
Factor 2 |
Factor 3 |
MS2 |
MS3 |
t (P)-value |
MS2 |
MS3 |
t (P)-value |
MS2 |
MS3 |
t (P)-value |
|
Q1 |
0.81*
|
0.2 |
0.22 |
4.47 (4.31–4.62) |
5.09 (4.96–5.21) |
6.13 (<0.0001) |
|
|
|
|
|
|
|
Q2 |
0.91*
|
0.19 |
0.19 |
|
|
|
|
|
|
|
Q3 |
0.91*
|
0.12 |
0.21 |
|
|
|
|
|
|
|
Q4 |
0.16 |
0.79*
|
0.34 |
|
|
|
4.44 (4.25–4.63) |
5.03 (4.89–5.18) |
4.88 (<0.0001) |
|
|
|
|
Q5 |
0.22 |
0.58*
|
0.15 |
|
|
|
|
|
|
|
Q6 |
0.08 |
0.79*
|
0.37 |
|
|
|
|
|
|
|
Q7 |
0.17 |
0.43 |
0.67*
|
|
|
|
|
|
|
4.49 (4.29–4.68) |
5.11 (4.97–5.26) |
5.07 (<0.0001) |
|
Q8 |
0.31 |
0.28 |
0.73*
|
|
|
|
|
|
|
|
Q9 |
0.19 |
0.25 |
0.71*
|
|
|
|
|
|
|


 PDF
PDF Citation
 Print
Print


 XML Download