Abstract
Purpose:
No study had been conducted to assess the hospitals’ environment for learning purposes in multicenter sites in Saudi Arabia. It aims to evaluate the environment of hospitals for learning purposes of pediatric residents.
Methods:
We applied Postgraduate Hospital Educational Environment Measure (PHEEM) to measure the learning environment at six teaching hospitals in the Eastern Region of Saudi Arabia from September to December 2013.
Results:
The number of respondents was 104 (86.7%) out of 120 residents and 37 females and 67 male residents have responded. The residents’ response scored 100 out of 160 maximum score in rating of PHEEM that showed overall learning environment is favorable for training. There were some items in the social support domain suggesting improvements. There was no significant difference between male and female residents. There was a difference among the participant teaching hospitals (p<0.05).
Several researchers investigated learning environment at undergraduate level by an inventory called Dundee (DREEM) developed by Sue Roff [1]. This DREEM inventory has been translated in many languages including Arabic and applied for evaluation of learning environment in many countries [2]. This DREEM inventory also applied at postgraduate level in Saudi Arabia for the evaluation of Diploma in Family Medicine by Khan et al. in 2011[3]. There is another reliable and validated inventory to the same purpose, the Postgraduate Hospital Educational Environment Measure (PHEEM) developed by Roff et al [4]. This inventory contains 40 items evaluating various aspects of learning environment in teaching hospitals for postgraduate training. The inventory measures three domains: perception of teaching; perception of autonomy; and perception of social support. This inventory has been used for four major residency programs: pediatric; surgery; internal medicine and Gynecology & Obstetrics at Taiba University Teaching Hospitals in 2010 [5] and in King Fahad Hospital, Dammam University for all residents in 2011[6]. Though the aims of previous study and ours were the same, the previous studies were conducted at one site only while our study aimed as a multicenter and covered 6 training & teaching hospitals. Therefore it gives a broader picture of learning environment in major teaching hospitals of Eastern region.
In Eastern Region, there are six teaching hospitals for postgraduate training for 17 specialties [7], including a 4-year training pediatric residency program. We included all male and female residents from year 1 to year 4 in our study. The study period was from September to December 2013. A total of 120 residents were invited to participate.
PHEEM inventory contains 40 items with which the respondents were asked to show their agreement using 5-point Likert scale. These range from strongly agree (4), agree (3), unsure (2), disagree (1) to strongly disagree (0). An environment is considered to be good if it’s overall score is high and showing maximum agreement. This inventory has four domains: perception of autonomy; perception of teaching; and social support. There are four negative statements (items 7, 8, 11 and 13) to be scored in reverse order. We included age, gender and residency years (R1 to R4) and name of teaching hospitals with codes for response comparison.
We headed with our plan for taking permission of using PHEEM inventory for our research, after taking permission we applied for ethical approval and received no objection from the ethical committee. All residents of pediatric specialties have collected the data from six teaching and training hospitals of Eastern region. We distributed the questionnaire by hand to make sure that all residents have received the questionnaire. One pediatric specialist has been assigned to collect the entire questionnaire confirming it has been ended face-to-face in order to well-define the doubts promptly if any. And it was asked residents that don’t write name or academic number.
We fed the data into SPSS version 20 (IBM, New York, USA) and did a descriptive analysis and calculate mean and standard deviation of all responses. The difference between males and females’ mean scores were calculated and applied t-test for comparison. Then we have calculated median and means and applied ANOVA for comparison of different responses at different teaching hospitals and different years of studies. The p-value less than 0.05 was considered as significant.
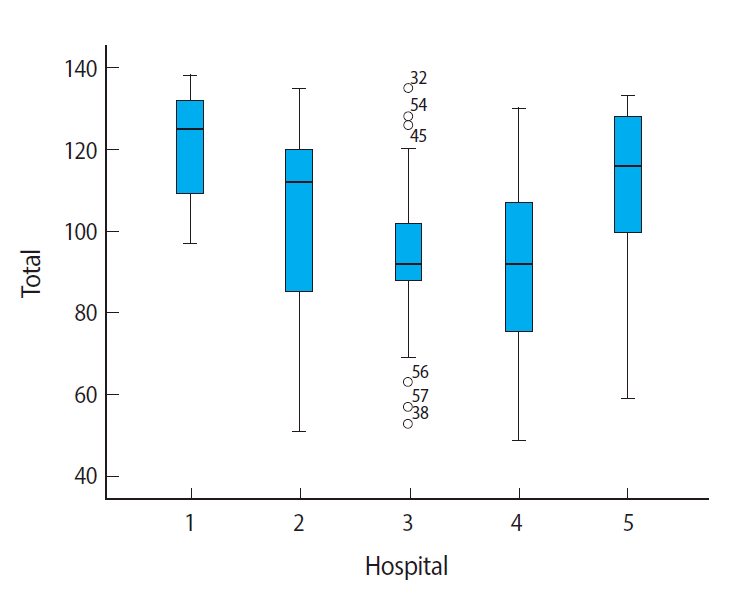
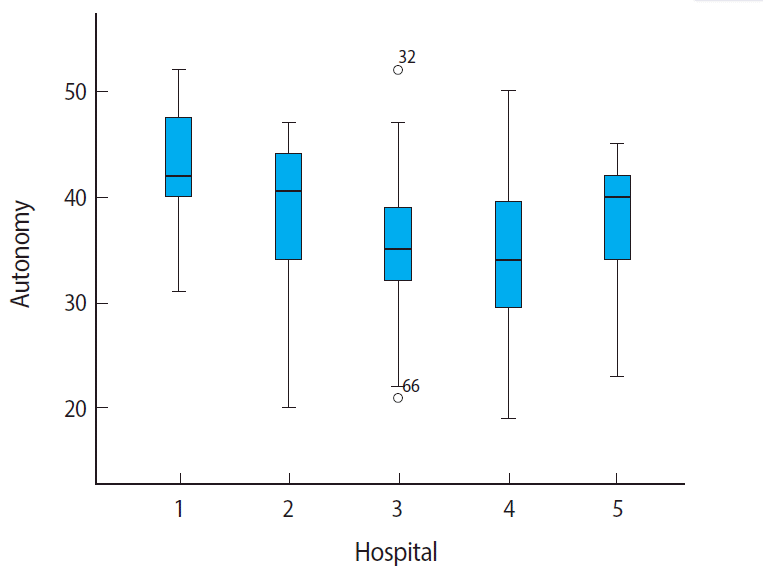
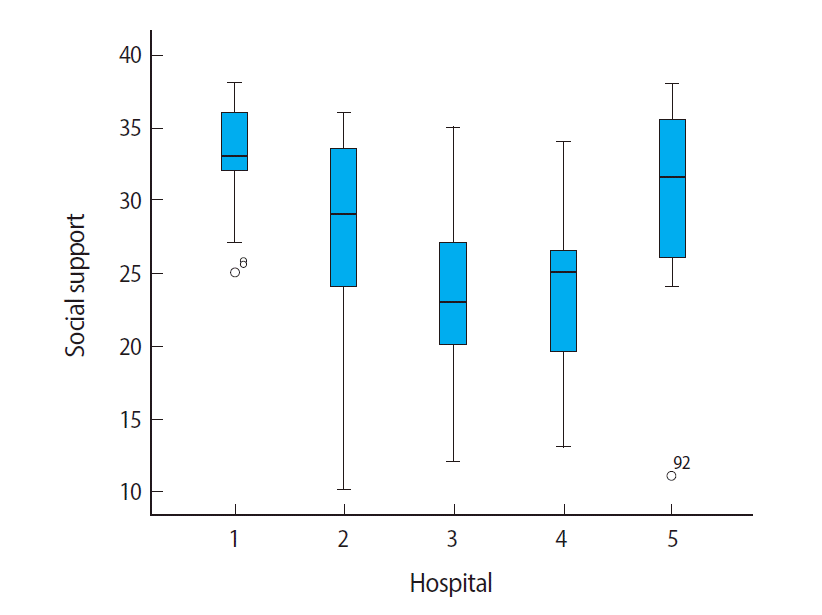
One hundred and four residents out of 120 have responded (86.7%) with 37 female and 67 male residents. Forty residents were enrolled in year one, 21 in year two, 19 in year three, and 24 residents in year four. Overall, the residents rated learning environment favorable for training, although there were some items, especially in social support domain, where improvements could be addressed. Except for two responses with higher mean value more than three, none of the responses crossed the mean value above two and there were some items below two showing in bold (Table 1). There are two items (Numbers 8 and11) in perception about autonomy and two items (Numbers 7 and 13) in perception about social support are “NEGATIVELY” worded question - so an agreement response more than two means that this feature needs to be corrected showing bold and italic in Table 1. The overall results showed 100.19±23.13 (Fig. 1) while autonomy showed 34.91±7.83 (Fig. 2), teaching 38.89± 9.80 (Fig. 3), and social support 26.38±7.04 (Fig. 4). Although there was no significant difference between male and female residents (Table 2) and among different years of study (Table 3), there were differences (p<0.05) considering the different teaching hospitals as regards to two domains of teaching and social support system (Table 4).
This study used PHEEM as a tool for assessing the learning environment of teaching hospitals for residency programs of pediatric specialty at six sites in Eastern Region of Saudi Arabia. Our study has covered six postgraduate teachings and training centers in Eastern Region while the previous study conducted in one teaching site involved all residents from year 1 through year 4 and all major specialties including pediatrics [5]. We mainly focused on only pediatric residents and tried to compare the learning environment among different hospitals for the same specialty in eastern region.
The overall maximum scores showed that there was no major issue present in the environment. The items that depict mean value less than 2 in this study were availability of an informative junior doctors handbook, workload, blame culture, and adequate catering facilities during on call. It means the participants in this study felt these issues are important and making problem for a good learning environment. While other similar study in Saudi Arabia showed that long working hours, unavailability of clinical protocols, inefficient use of training time, lack of constructive feedback, and presence of blaming culture were the major issues. Whereas another comparable study conducted among pediatric residents at Taiba University in Medinah Al-Manwara showed seven items that scored less than 2 mean scores such as: inadequate catering services; perform inappropriate tasks; bleeped inappropriately; suitable access to career advises; informative handbook; informative induction program; and senior staff utilize learning opportunities effectively [5, 6]. The comparison of the results show not much difference in our and above studies. The some of the low item points showed in our and other studies not hard to fix for example to give hands out, having good catering facilities because it is totally management issues, whilst it is difficult to manage the blame culture. The blame culture creates unhealthy environment for learning. And this requires behavior modification and training and need to change the attitude not only students but also all stakeholders, this issue could be embedded to culturally accept the process of feedback that may be considered as blaming, may needs further exploration. Nevertheless it is considered a very important barrier for making conducive environment for learning. Indeed it is a lengthy process to change the behavior but need to start from the identification of the problem and supposed that this study is a start-up point.
Majority items of PHEEM in our study counted as an average and scored around 2 but these results are better than other studies [6, 8-10] where most of the items received responses below 2 mean score. Conversely, a few of the responses have crossed the mean value more than three, which means that the residents were more satisfied with some of areas of the learning environment in all sites of study. These areas include that residents have good collaboration and they were given sufficient time to practice actively in educational events, when compared with other study we found almost similar results. There may be an argument that these results perhaps indicated biased response because these items are directly related to their participation in learning environment. In contrast, the other study that conducted in Medinah doesn’t show the same results but pediatric residents scored high in only one item that is they have the opportunity to provide continuity of care [5]. The overall comparison of the results among published studies indicated that learning environment in eastern region is more conducive, however, may need to have further comparison from other areas of the kingdom to draw any conclusion. The Saudi Commission for Health Specialties may play an important role taking consideration of students’ thoughts for future planning for enhancing the learning environment. We analyzed the questionnaire based on three domains [9-11]; therefore, we found that there is a significant difference (p<0.05) present among six teaching hospitals as regard to two domains of teaching and social support domains.
The mean score of their responses near or more than 3 mostly revealed in autonomy domain, while teaching and social support domains demonstrated only a few areas with high mean values. Therefore it seems that residents faced more obstacles in teaching and social domains. Apparently the residency training is often correlated with stress, depression and burnout mainly due to excessive working hours; sleep deprivation, challenging patients and an aggressive and challenging work environment [6, 12, 13]. Though PHEEM did not ask questions that directly addressed these aspects, but scores suggested that their social life during residency could be uninspiring, and their level of social interaction was unsatisfactory. Therefore it is important to highlight weaker items related to social support for improvement in learning environment.
Though this study has many strong points like conducted at six teaching hospitals, high response rate and enough sample size for generalization. Yet it has some limitations too, for example having sample from one region of the Kingdom thus difficult to generalize for the other regions that could be addressed to some extent by comparison of the results with other studies. However it is suggested to conduct the similar study on a large scale and covers as many as possible regions.
In conclusion, the overall learning environment in eastern region is decent still it needs improvement in certain individual areas and domains of teaching and social support.
ACKNOWLEDGMENTS
I thank Ann Verdine, who was project director at the time the analyzed data were collected; Jie Pu who was my evaluation mentor; and Albert Moreno for his leadership as CEO of National Community Health Partners that managed the capacity building assistance project described in the article. Funding for the capacity building assistance projects was provided by two successive grants from the United States Centers for Disease Control and Prevention (PS09-906, funded 2009-2014, and PS14-1403, funded 2014-2018), awarded to National Community Health Partners (Tucson, AZ).
REFERENCES
1. Roff S. The Dundee Ready Educational Environment Measure (DREEM)--a generic instrument for measuring students’ perceptions of undergraduate health professions curricula. Med Teach. 2005; 27:322–325. http://dx.doi.org/10.1080/01421590500151054.

2. Miles S, Swift L, Leinster SJ. The Dundee Ready Education Environment Measure (DREEM): a review of its adoption and use. Med Teach. 2012; 34:e620–e634. http://dx.doi.org/10.3109/0142159X.2012.668625.

3. Khan AS, Akturk Z, Al-Megbil T. Evaluation of the Learning Environment for Diploma in Family Medicine with the Dundee Ready Education Environment (DREEM) Inventory. J Educ Eval Health Prof. 2010; 7:2. http://dx.doi.org/10.3352/jeehp.2010.7.2.

4. Roff S, McAleer S, Skinner A. Development and validation of an instrument to measure the postgraduate clinical learning and teaching educational environment for hospital-based junior doctors in the UK. Med Teach. 2005; 27:326–331. http://dx.doi.org/10.1080/01421590500150874.

5. Algaidi SA. Assessment of Educational Environment for Interns Using Postgraduate Hospital Educational Environment Measure (PHEEM). J Taibah Univ Med Sci. 2010; 5:1–12.

6. Al-Marshad S, Alotaibi G. Evaluation of Clinical Education Environment at King Fahad Hospital of Dammam University using the Postgraduate Hospital Education Environment Measure (PHEEM) Inventory. Educ Med J. 2011; 3:e6–e14.

7. Al-Freihi . Perspective on the Saudi Council for health specialities. Saudi J Gastroenterol. 2003; 9:1–5.
8. Gooneratne IK, Munasinghe SR, Siriwardena C, Olupeliyawa AM, Karunathilake I. Assessment of psychometric properties of a modified PHEEM questionnaire. Ann Acad Med Singapore. 2008; 37:993–997.
9. Riquelme A, Herrera C, Aranis C, Oporto J, Padilla O. Psychometric analyses and internal consistency of the PHEEM questionnaire to measure the clinical learning environment in the clerkship of a Medical School in Chile. Med Teach. 2009; 31:e221–e225. http://dx.doi.org/10.1080/01421590902866226.

10. Boor K, Scheele F, Scherpbier AJ, Teunissen PW, Sijtsma K. Psychometric properties of an instrument to measure the clinical learning environment. Med Educ. 2007; 41:92–99. http://dx.doi.org/10.1111/j.1365-2929.2006.02651.x.

11. Wall D, Clapham M, Riquelme A, Vieira J, Cartmill R, Aspegren K, Roff S. Is PHEEM a multi-dimensional instrument? An international perspective. Med Teach. 2009; 31:e521–e527. http://dx.doi.org/10.3109/01421590903095528.

12. Collier VU, McCue JD, Markus A, Smith L. Stress in medical residency: status quo after a decade of reform? Ann Intern Med. 2002; 136:384–390. http://dx.doi.org/10.7326/0003-4819-136-5-200203050-00011.

13. Peterlini M, Tiberio IF, Saadeh A, Pereira JC, Martins MA. Anxiety and depression in the first year of medical residency training. Med Educ. 2002; 36:66–72. http://dx.doi.org/10.1046/j.1365-2923.2002.01104.x.

Fig. 1.
Box plot showing the Max - Q3 - Median - Q1 – Min at six hospitals as regard to all domains of Postgraduate Hospital Educational Environment Measure measured from residents at six teaching hospitals in the Eastern Region of Saudi Arabia from September to December 2013.

Fig. 2.
Box plot showing the Max - Q3 - Median - Q1 – Min at six hospitals as regard to autonomy domain of Postgraduate Hospital Educational Environment Measure measured from residents at six teaching hospitals in the Eastern Region of Saudi Arabia from September to December 2013.

Fig. 3.
Box plot showing the Max - Q3 - Median - Q1 – Min at six hospitals as regard to teaching domain of Postgraduate Hospital Educational Environment Measure measured from residents at six teaching hospitals in the Eastern Region of Saudi Arabia from September to December 2013.

Fig. 4.
Box plot showing the Max - Q3 - Median - Q1 – Min at six hospitals as regard to social domain of Postgraduate Hospital Educational Environment Measure measured from residents at six teaching hospitals in the Eastern Region of Saudi Arabia from September to December 2013.

Table 1.
Responses of residents on items of Postgraduate Hospital Educational Environment Measure questionnaire
Table 2.
Comparison in males and females residents based on domains of Postgraduate Hospital Educational Environment Measure in Saudi Arabia
Table 3.
Comparison mean scores given by different years’ residents as regard to three domains of Postgraduate Hospital Educational Environment Measure in Saudi Arabia
Table 4.
Comparison mean scores given at six hospitals as regard to three domains of Postgraduate Hospital Educational Environment Measure in Saudi Arabia


 PDF
PDF Citation
 Print
Print


 XML Download