Journal List > Prog Med Phys > v.32(4) > 1148713

Jin, Kang, Kang, and Choi: Synthetic Computed Tomography Generation while Preserving Metallic Markers for Three-Dimensional Intracavitary Radiotherapy: Preliminary Study

Abstract

Purpose

This study aimed to develop a deep learning architecture combining two task models to generate synthetic computed tomography (sCT) images from low-tesla magnetic resonance (MR) images to improve metallic marker visibility.

Methods

Twenty-three patients with cervical cancer treated with intracavitary radiotherapy (ICR) were retrospectively enrolled, and images were acquired using both a computed tomography (CT) scanner and a low-tesla MR machine. The CT images were aligned to the corresponding MR images using a deformable registration, and the metallic dummy source markers were delineated using threshold-based segmentation followed by manual modification. The deformed CT (dCT), MR, and segmentation mask pairs were used for training and testing. The sCT generation model has a cascaded three-dimensional (3D) U-Net-based architecture that converts MR images to CT images and segments the metallic marker. The performance of the model was evaluated with intensity-based comparison metrics.

Results

The proposed model with segmentation loss outperformed the 3D U-Net in terms of errors between the sCT and dCT. The structural similarity score difference was not significant.

Conclusions

Our study shows the two-task-based deep learning models for generating the sCT images using low-tesla MR images for 3D ICR. This approach will be useful to the MR-only workflow in high-dose-rate brachytherapy.

Introduction

Brachytherapy plays an essential role in cervical cancer treatment, as it can deliver a high dose to the tumor without sparing the surrounding normal tissue. For locally advanced cervical cancer, the treatment with a combination of concurrent chemotherapy and external beam radiation therapy followed by intracavitary radiotherapy (ICR) has been used, and it improves the overall survival [1,2].
Traditionally, ICR based on two-dimensional (2D) X-ray images were standardized by International Commission on Radiological Units Report 38 [3]. However, this protocol does not represent the characteristics of individual patients because of the point-based dose prescriptions. Recently, the advantages of image-guided three-dimensional (3D) ICR have been reported as reducing the late complication rates for cervical cancer [4]. Guidelines have been published by the brachytherapy Group of the Groupe Européen de Curiethérapie and European Society for Therapeutic Radiology and Oncology (GEC ESTRO) [5,6]. For the 3D image-based plans, the target and organs at risk (OAR) are delineated, and the dose was prescribed to the outermost point that covered the target.
The 3D imaging usage in the high-dose-rate (HDR) workflow using magnetic resonance imaging (MRI) image provides excellent soft tissue contrast, specifically in gynecologic diseases [7,8]. As the advantage in MR images, the images facilitate the target and OAR contouring during brachytherapy procedures. However, the actual localization of the brachytherapy applicator and radiation source on MRI still remains a challenge because MRI does not directly delineate the source path [9,10]. Therefore, computed tomography (CT) images are also required to define the source position and reconstruct the applicator using a metallic marker during treatment planning. This hybrid approach that needs both MR and CT images for the plan has limitations in the efficiency of brachytherapy, which is conducted in the clinical workflow [11]. For this reason, there are efforts to translate the procedure into only MRI, which could decrease the number of scans and associated patient discomfort as well as reduce the planning-related costs. Also, the uncertainty due to image registration between CT and MR images was excluded. However, the main limitation of migrating toward the MR-only workflow is that the implanted catheters are not reliably visualized on the MR images [12].
Several studies have been developed on the MR line marker, which is visualized on MR images. Shaaer et al. [11] proposed an MR line marker filled with a contrast agent and evaluated the robustness of visualizing the marker on the T1- and T2-weighted imaging MRI. Kim et al. [13] developed rubber-based MR markers with silicone oil to enhance the signal intensity in low-magnetic-field MRI. However, the markers have a limitation in representing a lower intensity signal than distilled water.
Recently, another approach has been proposed to directly convert MR images into synthetic CT (sCT) based on deep learning techniques in radiotherapy [14-18]. Previous studies using the deep learning model for MRI-to-CT conversion employed a supervised learning scheme [15]. The most commonly used neural network is the U-Net architecture, which is an encoder–decoder network with skip connections trained discriminatively. However, there are few studies of the sCT generation for 3D ICR.
In this study, we proposed a deep learning architecture combining two tasks (image generation and segmentation) to generate sCT images from MR images acquired from the low-magnetic-field MR scanner for improving metallic marker visibility.

Materials and Methods

1. Data acquisition

We retrospectively added patients treated with 3D ICR for cervical cancer in a single institution (Seoul National University Hospital, Seoul, Korea). This study was approved by the Institutional Review Board at our institution (1708-051-876), and the requirement for informed consent was waived. Planning CT images were obtained using Brilliance Big Bore CT scanner (Philips, Cleveland, OH, USA) with a 1-mm slice thickness, a 512×512 matrix, a 120-kVp tube voltage, and a YA convolution kernel with iDose level 3. MR images were obtained using a 0.35-T MRI scanner integrated with the radiation therapy system of the MRIdian MRgRT system (ViewRay, Oakwood, OH, USA) 15 minutes after the CT scan. The true fast imaging with steady-state-free precession (TRUFI) sequence was selected. The applicator with metallic and line markers for CT and MR scans, respectively, were placed in the same patient setup.

2. Preprocessing

The overall procedure of the study is presented in Fig. 1. We conducted image registration from the CT image set to the MR image set using a deformable registration algorithm implemented in ViewRay treatment planning system. The CT images are resampled to the same resolution as the MR image dimension of 334×300×288 pixels with voxel size at ≈1.5×1.5×1.5 mm3. For the CT image set, the connected-component labeling method was applied to remove the CT couch that was not presented in the MR images. The intensity of the CT image was normalized from [−1024 HU, 2048 HU] to [0, 1]. The MR images were corrected for low-frequency intensities and non-uniformities using the N4 bias field correction method. Because the MR images have different intensity ranges for different patients, we conducted normalized imaging using the 0% to 99% percentile value of the intensity distribution of each image to stabilize network training. X-ray dummy source markers in CT images were segmented by an intensity-based threshold method followed by a manual modification to provide marker position information to the deep learning model.

3. Synthetic computed tomography generation

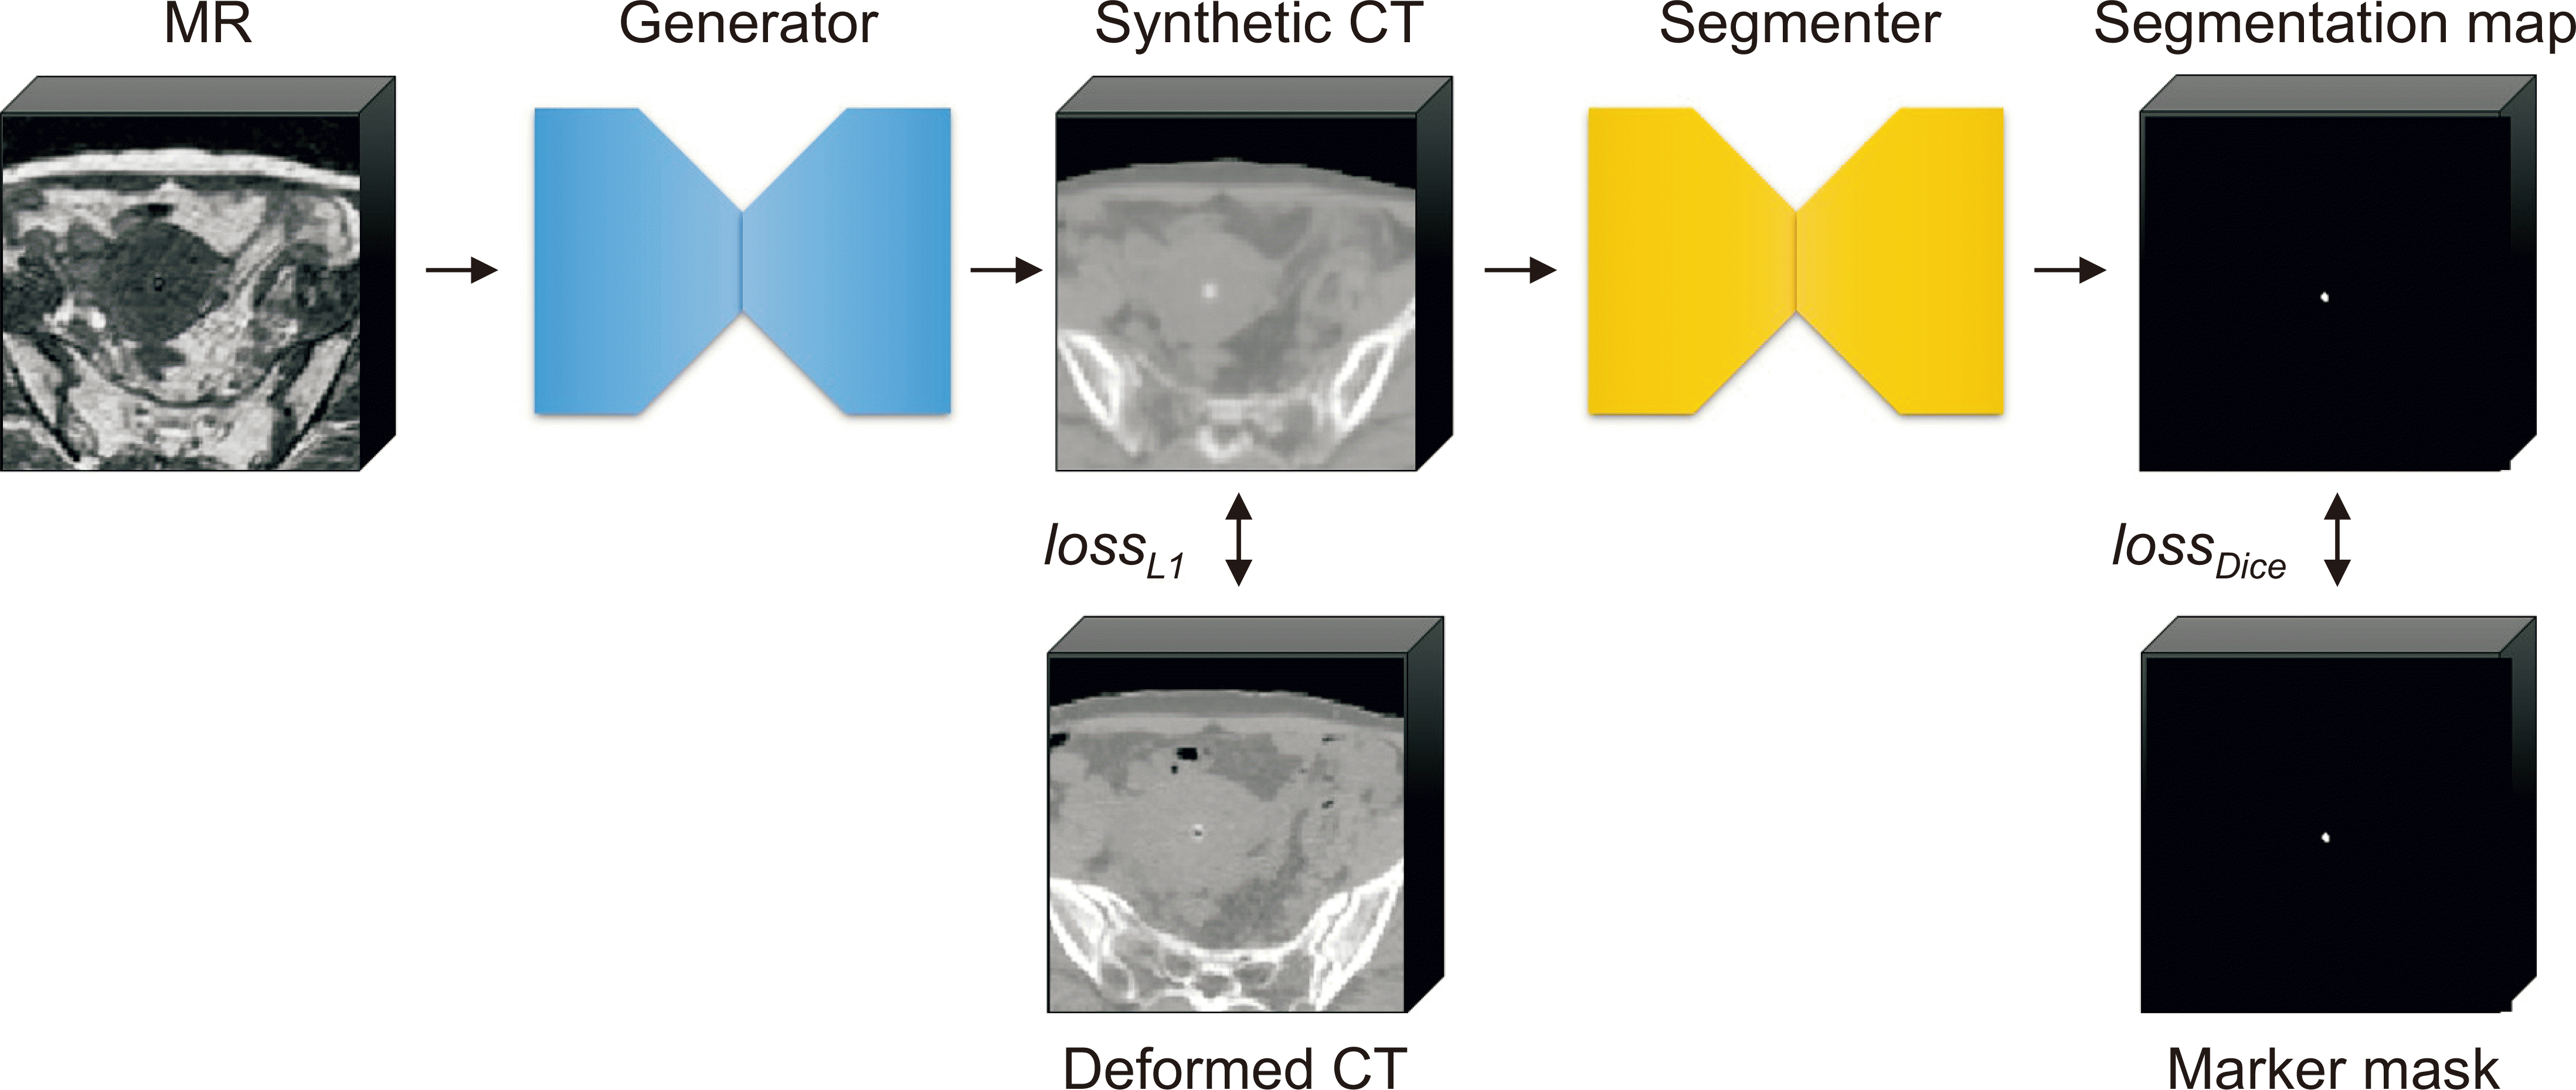
The overall architecture of the proposed models is illustrated in Fig. 2. The architecture comprises two fully convolutional 3D convolutional neural networks. The first one (Generator) performs as a sCT generation from MR image, whereas the second one (Segmenter) was used as the segmentation network. The Generator was based on the 3D U-Net with residual blocks. Owing to the graphical processing unit (GPU) memory constraints, we adjusted the number of filters at each level. The filter numbers were 8, 16, 32, 64, and 128 in the encoder for reducing the spatial dimensions by a factor of two by each layer and 128, 64, 32, 16, and 8 in the decoder for upsampling. The Segmenter uses the same 3D U-Net architecture as the Generator. This network performs voxel-wise classification using the softmax function. The output of the network is the segmentation map of the input patch. We defined the loss function (lossgen) of the Generator as follows:
(1)
lossgen=lossL1+αlossDice
where lossL1 is the mean absolute error (MAE) between the sCT and deformed CT (dCT) and lossDice is computed on the basis of the Dice coefficient between the predicted segmentation result from the sCT and the ground truth annotation. For the Segmenter, we chose the loss function as Dice loss between the dCT and the ground truth segmentation map. The weights and bias in the Generator layers as well as the Segmenter layers were jointly trained using adaptive stochastic gradient descent optimizers. The networks were trained for 2,000 epochs using 3,040 paired MRI–CT axial slices from 19 patients, defining the training cohort using a GPU NVIDIA GTX 1080Ti (11 GB). The remaining patients were considered the testing cohort.

4. Evaluation

The performance of the sCT generation models was evaluated quantitatively. We utilized three metrics to assess the accuracy of the image translation for the test set: the MAE, root mean square error (RMSE), and structural similarity (SSIM) between the sCT generated from the preprocessed MR images using the two deep neural networks and the dCT. The MAE and RMSE consider comparison of the pixel-wise difference between two images. The MAE and RMSE may be calculated respectively as:
(2)
MAE=1Ni=1Nxiyi
(3)
RMSE=1Ni=1Nxiyi2 
where i is a voxel within the body and N is the total number of voxels.
The SSIM represents a comparison of the luminance, contrast, and structure by computing a similarity score between two images. This metric may be calculated as:
(4)
SSIM=2μx2μy2+c12σxy+c2μx2+μy2+c1σx2+σy2+c2
where µx is the mean intensity of image x:
(5)
μx=1NiNxi
σx is an estimate of the signal contrast:
(6)
σx=1N1iNxiμx 212
σxy is a correlation coefficient between image x and y:
(7)
σxy=1N1i=1Nxiμxyiμy
and c1 and c2 are constants.

Results

The proposed method was applied to the low-tesla MR images, and their sCT images were produced. The representative case of a patient with cervical cancer was selected in the test set shown in Fig. 3. Fig. 3 shows the original CT images and the generated sCT images using the 3D U-Net and the proposed model. The metallic marker in the image of sCT generated using 3D U-Net was almost invisible, whereas it was visible in the sCT produced using the proposed model. Additionally, sCTs show soft tissue and dense structure, such as the pelvic bones and spine. These sCTs present smoother boundaries than the original CT images.
The MAE, RMSE, and SSIM between the dCT and sCT images calculated from the test set are summarized in Table 1. Generally, the sCT of our model showed smaller errors (MAE and RMSE) Generally, the sCT of our model showed smaller errors (MAE and RMSE) than the sCT of 3D U-Net. The MAE values were 7.94±2.31 HU and 7.49±2.10 HU for 3D U-Net and our model, respectively. However, the similarity score difference was insignificant.

Discussion

This study presented the feasibility of the sCT generation from the low-tesla MR image that improved the visibility of small metallic objects by employing the two-task-driven deep neural networks. Our method leverages a joint learning strategy that involves two networks: a Generator that converts MR images to CT images while preserving the region of interest and a segmentation network that predicts the segmentation mask of metallic dummy markers from the sCT images. Our findings show that the traditional U-Net model with loss function of pixel-wise difference has limited performance for generating small objects, such as the marker. Even though the region with the metallic markers in the CT images causes a large error in loss, the error is only a small portion of the total loss. Without incorporating the segmentation task in the deep learning architecture, the small objects were not preserved in the synthetic images, as shown in Fig. 2. For the proposed architecture, we designated the generated image as an input of the segmentation model and calculated the segmentation loss of the metallic objects to provide additional information to the generation model. As a result, the metallic markers could be well determined in the synthetic images of the proposed model than those of the 3D U-Net model.
The hybrid procedure currently used in the clinic for intracavitary gynecologic brachytherapy involves inevitable setup errors. To align the applicator position, rigid image registration was conducted between the CT and MR images to minimize the geometric distortion of the applicator. In this case, there is a disparity between the two images, such as on the location of internal organs. This effect could not be revealed in the dose calculation following the TG-43 protocol [19], which assumes a homogeneous water geometry. However, the influence might be emphasized when the model-based dose calculation according to TG-186 [20] is used, which assigns the tissue densities based on contoured organs. The MR-only workflow with sCT image can minimize the geometric discrepancy while accurately assigning the tissue mass densities derived from the sCT image for dose calculation.
Our study still has several limitations. We generated the sCT images from only the 0.35-T MR images acquired with TruFISP sequence used in radiation oncology. The MR images obtained using a higher-tesla machine of radiology could also be used for the 3D ICR treatment planning. The different image characteristics of the higher tesla MR scanners or other MR sequences affect the learning-based sCT generation model. Therefore, applying the proposed model to the MR-only ICR using other diagnostic MR images would be a valuable research endeavor in the future. Moreover, we evaluated the sCT images using only intensity-based comparison with original CT images. For clinical implementation, the sCT generation algorithm should be validated by comparing the dosimetric parameters between the ICR plans from original and synthetic images. The evaluation of the accuracy of the applicator reconstruction using the marker of sCT image is also necessary. These dosimetric and geometric considerations remained in further studies. Recently, it has been reported that adversarial loss using a generative adversarial neural network could increase the sharpness of the image compared with that using only the L1 or L2 loss. Therefore, the image quality of the sCT image might have the potential to be improved using other complex deep learning architectures or appropriate objective functions.

Conclusions

Our study presents the two-task-based deep learning models for generating the sCT images using low-tesla MR images for 3D ICR. This approach will be useful to the MR-only workflow in HDR brachytherapy.

Acknowledgements

This study was supported by a grant from the National Research Foundation of Korea (NRF) grant funded by the Korean government (MSIP) (No. 2019M2A2B4096540).

Notes

Conflicts of Interest

The authors have nothing to disclose.

Availability of Data and Materials

The data that support the findings of this study are available on request from the corresponding author.

Author Contributions

Conceptualization: Hyeongmin Jin and Chang Heon Choi. Data curation: Hyun-Cheol Kang. Formal analysis: Hyeongmin Jin. Funding acquisition: Chang Heon Choi. Investigation: Hyeongmin Jin and Seonghee Kang. Methodology: Hyeongmin Jin and Seonghee Kang. Project administration: Hyun-Cheol Kang and Chang Heon Choi. Resources: Seonghee Kang and Hyun-Cheol Kang. Software: Hyeongmin Jin. Supervision: Hyun-Cheol Kang. Validation: Hyeongmin Jin and Seonghee Kang. Visualization: Hyeongmin Jin. Writing–original draft: Hyeongmin Jin. Writing–review & editing: Seonghee Kang and Chang Heon Choi.

References

1. Chargari C, Magné N, Dumas I, Messai T, Vicenzi L, Gillion N, et al. 2009; Physics contributions and clinical outcome with 3D-MRI-based pulsed-dose-rate intracavitary brachytherapy in cervical cancer patients. Int J Radiat Oncol Biol Phys. 74:133–139. DOI: 10.1016/j.ijrobp.2008.06.1912. PMID: 18774656.
crossref
2. Tanderup K, Eifel PJ, Yashar CM, Pötter R, Grigsby PW. 2014; Curative radiation therapy for locally advanced cervical cancer: brachytherapy is NOT optional. Int J Radiat Oncol Biol Phys. 88:537–539. DOI: 10.1016/j.ijrobp.2013.11.011. PMID: 24411631.
crossref
3. Chassagne D, Dutreix A, Almond P, Burgers J, Busch M, Joslin C. 1985; International Commission on Radiological Units and Measurements Report No. 38: dose and volume specification for reporting intracavitary therapy in gynecology. J ICRU. 20:DOI: 10.1093/jicru/os20.1.Report38.
4. Kang HC, Shin KH, Park SY, Kim JY. 2010; 3D CT-based high-dose-rate brachytherapy for cervical cancer: clinical impact on late rectal bleeding and local control. Radiother Oncol. 97:507–513. DOI: 10.1016/j.radonc.2010.10.002. PMID: 21074881.
crossref
5. Pötter R, Haie-Meder C, Van Limbergen E, Barillot I, De Brabandere M, Dimopoulos J, et al. 2006; Recommendations from gynaecological (GYN) GEC ESTRO working group (II): concepts and terms in 3D image-based treatment planning in cervix cancer brachytherapy-3D dose volume parameters and aspects of 3D image-based anatomy, radiation physics, radiobiology. Radiother Oncol. 78:67–77. DOI: 10.1016/j.radonc.2005.11.014. PMID: 16403584.
crossref
6. Haie-Meder C, Pötter R, Van Limbergen E, Briot E, De Brabandere M, Dimopoulos J, et al. 2005; Recommendations from Gynaecological (GYN) GEC-ESTRO Working Group (I): concepts and terms in 3D image based 3D treatment planning in cervix cancer brachytherapy with emphasis on MRI assessment of GTV and CTV. Radiother Oncol. 74:235–245. DOI: 10.1016/j.radonc.2004.12.015. PMID: 15763303.
crossref
7. Tanderup K, Viswanathan AN, Kirisits C, Frank SJ. 2014; Magnetic resonance image guided brachytherapy. Semin Radiat Oncol. 24:181–191. DOI: 10.1016/j.semradonc.2014.02.007. PMID: 24931089. PMCID: PMC4147854.
crossref
8. Owrangi AM, Prisciandaro JI, Soliman A, Ravi A, Song WY. 2015; Magnetic resonance imaging-guided brachytherapy for cervical cancer: initiating a program. J Contemp Brachytherapy. 7:417–422. DOI: 10.5114/jcb.2015.55541. PMID: 26622249. PMCID: PMC4663219.
9. Hellebust TP, Kirisits C, Berger D, Pérez-Calatayud J, De Brabandere M, De Leeuw A, et al. 2010; Recommendations from Gynaecological (GYN) GEC-ESTRO Working Group: considerations and pitfalls in commissioning and applicator reconstruction in 3D image-based treatment planning of cervix cancer brachytherapy. Radiother Oncol. 96:153–160. DOI: 10.1016/j.radonc.2010.06.004. PMID: 20663578.
crossref
10. Haack S, Nielsen SK, Lindegaard JC, Gelineck J, Tanderup K. 2009; Applicator reconstruction in MRI 3D image-based dose planning of brachytherapy for cervical cancer. Radiother Oncol. 91:187–193. DOI: 10.1016/j.radonc.2008.09.002. PMID: 18977049.
crossref
11. Shaaer A, Paudel M, Smith M, Tonolete F, Nicolae A, Leung E, et al. 2020; Evaluation of an MR-only interstitial gynecologic brachytherapy workflow using MR-line marker for catheter reconstruction. Brachytherapy. 19:642–650. DOI: 10.1016/j.brachy.2020.06.007. PMID: 32712027.
crossref
12. Ning MS, Vedam S, Ma J, Stafford RJ, Bruno TL, Cunningham M, et al. 2020; Clinical utility and value contribution of an MRI-positive line marker for image-guided brachytherapy in gynecologic malignancies. Brachytherapy. 19:305–315. DOI: 10.1016/j.brachy.2019.12.005. PMID: 32265119.
crossref
13. Kim JH, Jung S, Kim JI. 2019; Low magnetic field MRI visibility of rubber-based markers. Prog Med Phys. 30:89–93. DOI: 10.14316/pmp.2019.30.4.89.
crossref
14. Fu J, Yang Y, Singhrao K, Ruan D, Chu FI, Low DA, et al. 2019; Deep learning approaches using 2D and 3D convolutional neural networks for generating male pelvic synthetic computed tomography from magnetic resonance imaging. Med Phys. 46:3788–3798. DOI: 10.1002/mp.13672. PMID: 31220353.
crossref
15. Han X. 2017; MR-based synthetic CT generation using a deep convolutional neural network method. Med Phys. 44:1408–1419. DOI: 10.1002/mp.12155. PMID: 28192624.
crossref
16. Kang SK, An HJ, Jin H, Kim JI, Chie EK, Park JM, et al. 2021; Synthetic CT generation from weakly paired MR images using cycle-consistent GAN for MR-guided radiotherapy. Biomed Eng Lett. 11:263–271. DOI: 10.1007/s13534-021-00195-8. PMID: 34350052.
crossref
17. Kazemifar S, Nguyen D, Mcguire S, Timmerman R, Nedzi L, Wardak Z, et al. 2018; Synthetic CT generation for MRI-only radiation therapy using deep learning. Med Phys. 45:E700.
18. Lei Y, Harms J, Wang T, Liu Y, Shu HK, Jani AB, et al. 2019; MRI-only based synthetic CT generation using dense cycle consistent generative adversarial networks. Med Phys. 46:3565–3581. DOI: 10.1002/mp.13617. PMID: 31112304. PMCID: PMC6692192.
crossref
19. Rivard MJ, Coursey BM, DeWerd LA, Hanson WF, Huq MS, Ibbott GS, et al. 2004; Update of AAPM Task Group No. 43 report: a revised AAPM protocol for brachytherapy dose calculations. Med Phys. 31:633–674. DOI: 10.1118/1.1646040. PMID: 15070264.
crossref
20. Beaulieu L, Carlsson Tedgren A, Carrier JF, Davis SD, Mourtada F, Rivard MJ, et al. 2012; Report of the Task Group 186 on model-based dose calculation methods in brachytherapy beyond the TG-43 formalism: current status and recommendations for clinical implementation. Med Phys. 39:6208–6236. DOI: 10.1118/1.4747264. PMID: 23039658.
crossref

Fig. 1
Schematic diagram of the overall procedure. CT, computed tomography; MR, magnetic resonance; dCT, deformed CT; MAE, mean absolute error; RMSE, root mean square error; SSIM, structural similarity.
pmp-32-4-172-f1.tif
Fig. 2
Proposed architecture. First, a 3D U-Net Generator network takes a 3D MR patch and generates a synthetic CT patch. The synthetic CT patch is inputted to a second 3D U-Net Segmenter network for metallic marker segmentation. MR, magnetic resonance; CT, computed tomography; 3D, three-dimensional.
pmp-32-4-172-f2.tif
Fig. 3
Example slices of (a) magnetic resonance (MR) image, (b) deformed computed tomography (CT), and synthetic CTs generated using (c) 3D U-Net and (d) the proposed model. The window settings were C/W 0/1000 HU in (b–d).
pmp-32-4-172-f3.tif
Table 1
Errors (MAE and RMSE) and similarity (SSIM) relative between synthetic CT and deformed CT in the test group
Metrics 3D U-Net Proposed model
MAE (HU) 7.94±2.31 7.49±2.10
RMSE (HU) 44.72±8.99 42.85±7.88
SSIM 0.92±0.02 0.92±0.02

Values are presented as mean±standard deviation.

MAE, mean absolute error; RMSE, root mean square error; SSIM, structural similarity; CT, computed tomography; 3D, three-dimensional.

TOOLS
Similar articles