

 PDF
PDF Citation
 Print
Print


INTRODUCTION
Over a year has passed since the coronavirus disease 2019 (COVID-19) was declared a global pandemic by the World Health Organization. However, global consumers are still facing unprecedented challenges in nearly every aspect of their lives. Despite increasing signals indicating that governments will be relaxing public health and social measures to curb the spread of infection due to the distribution of vaccines, ongoing changes will continue to force consumers to adapt to the “new normal.” The pandemic has substantially changed life from daily disruptions to tremendous social costs. It has also altered how people think about and experience the phenomenon in the marketplace, leading to a change in their behaviors. Protecting health and safety, first and foremost, has become the most important value to consider under emergency circumstances. These changes for consumers have been due to increased perceived susceptibility and risks toward the infection after the COVID-19 outbreak [1]. Coupled with health and safety issues, individuals also tend to endorse values representing a societal focus as most governments and public agencies have mandated public restrictions such as testing, quarantine requirements, and stay-at-home restrictions. Individuals have become more concerned about the social consequences of non-compliance with public measures [2]. Individuals have been also severely exposed to economic uncertainty related to job losses, asset market volatility, and future economic growth [3] and these factors have substantially influenced consumers' decision-making related to labor, financial behaviors, and consumption [4].
During the prolonged the COVID-19 pandemic, there is a growing body of evidence that individuals around the globe are changing their lifestyle-related behaviors to adjust to the new conditions [5]. COVID-19 has had a considerable effect on the global economy by driving a drastic decline in consumers' overall spending compared to the previous year [67]. The magnitude of the decline has been closely associated with the number of new daily COIVD-19 cases and deaths, and the severity of the spread in specific areas where consumers live or work [78]. However, the economic impacts of the pandemic on consumer spending have varied greatly across spending categories. For instance, spending in service sectors such as travel, transport, and accommodation have plummeted [7910], while expenditures on household supplies and utilities have increased as people have spent much more time indoors [11]. Despite the substantial drop in overall spending, there has been explosive growth in online transactions but a decrease in in-store sales [1213]. This disparity in spending changes across categories implies that individuals are adjusting their lifestyle-related behaviors in response to the current crisis.
In terms of a dietary-related lifestyle, few studies have explored how food-related spending and dietary behaviors and attitudes have changed since the COVID-19 outbreak. Most studies have analyzed spending and transaction data at an aggregate or at the individual level, making spending on grocery shopping, food delivery, and dining the most investigated items related to consumers' dietary lifestyle in existing studies. While there has been a dramatic decline in spending on most items after the outbreak, spending on groceries and food delivery increased significantly compared to previous years [914]. The food categories consumed have also changed, leading to changes in consumer food consumption patterns, such as increased consumption of items such as frozen food and canned food and decreased consumption of alcohol and dairy products [1516]. Interestingly, grocery spending initially increased sharply when COVID-19 cases began to rise and dropped slightly afterward, confirming that consumers were stockpiling items or they had panic buying behaviors [91017]. Government-mandated lockdown and stay-at-home orders also significantly accelerated the demand for food delivery [31819]. However, the food service sector including restaurants and bars were hit hard by the COVID-19 as a consequence of social distancing expectations [1620].
Evidence of spending changes related to dietary lifestyle during the outbreak period is inconsistent across spending categories. Unlike other types of consumption for basic needs such as shelter and clothing, research has shown that different dietary lifestyle patterns have been more prominent during the outbreak [7]. This lack of comprehensive evidence has resulted in a lack of understanding of dietary attitude and behavior changes attributed to the COVID-19 outbreak. Furthermore, the magnitude and direction of changes in spending are closely related to area-specific characteristics such as the local severity of COVID-19 outbreaks and public health measures imposed by the government.
To control for regional characteristics, this study focuses on Korean consumers. Koreans have experienced less stringent restrictions in their daily lives compared to many other countries, replacing lockdowns with widespread testing and self-quarantining [21]. Therefore, the underlying purpose of the present study is to explore changes in dietary attitudes and behaviors among Korean consumers after the COVID-19 outbreak. Analyzing survey data that can capture multifaceted aspects of dietary attitudes and behaviors can contribute to a more comprehensive understanding of consumers' dietary lifestyle from both qualitative and quantitative perspectives. Specifically, this study addresses behavior changes by investigating meal frequency, types of services, importance of attributes toward food and grocery shopping, and types of buying channels. We also identify changes in the 5S dietary attitudes (i.e., savor-oriented, safety-oriented, sustainability-oriented, saving-oriented, and socializing-oriented) as a measure of dietary attitudes. In addition, profiles of consumers are categorized based on changes in the 5S of dietary attitudes and the characteristics of each group. In previous studies, dietary attitudes were divided into three sub-dimensions: savor, safety, and saving [2223]. However, as interest in sustainable consumption has increased recently and the awareness that eating habits are more than just eating food is a social activity, sustainability and socializing dimensions that can include these dietary trends was added to the 5S model [24]. In fact, the 5S model is a comprehensive concept that can encompass an expanded dietary attitude than before. A study that identified factors affecting consumer choice about home meal replacement (HMR) using local food by applying alphabet theory measured dietary attitudes using the 5S model and demonstrated the effect of each factor on attitude toward HMR using local food [25].
The paper is organized as follow. The next section presents the methods including data collection, the research instrument, and statistical analysis. We then present the results from the analysis and concluding remarks.
Go to : 
SUBJECTS AND METHODS
Data collection
We conducted a survey to collect data from a sample of Korean adults aged 20 and older. The sample was recruited through an online survey administered by a third-party research company in Korea. This survey was conducted for the panels who were willing to respond the questionnaires by sending the link to the survey web page to the panel. For this study, participants were drawn using a quota-sampling so they were equally distributed by sex and age groups. Our sample may not be representative of Korean population since we did not consider a larger share of older people. However, a non-random sampling allowed us to secure an adequate sample size for each consumer group categorized by sex and age. Data were collected from Oct 12 to Oct 18, 2020, nearly eight months after the onset of the COVID-19 outbreak in Korea. The final sample includes responses from 549 participants. This study was approved by the Institutional Review Board (IRB) of Seoul National University, Seoul, Korea (IRB No. 2010/003-012).
Research instrument
To investigate the changes in dietary attitudes and behaviors among Korean consumers, we developed a questionnaire with three parts: changes in dietary behaviors related to food and grocery shopping, changes in the 5S of dietary attitudes, and socio-demographic information.
The first part of the questionnaire included items that measured changes in various aspects of dietary behaviors. To capture the quantitative changes in dietary behaviors, participants were asked whether they increased, decreased, or maintained their meal frequency for breakfast, lunch, and dinner (e.g., meal frequency).
With regards to qualitative changes in dietary behaviors, fourteen attributes related to food and grocery shopping were measured. We assessed taste, price, convenience of cooking, safety, healthiness, and freshness with questions asking to what extent participants changed their perceptions of the importance of each attribute after COVID-19 (e.g., the importance of attributes on food and grocery shopping). Participants chose among the following options: “more important,” “same as before COVID-19,” and “less important.”
Participants were also asked to choose the extent to which they agreed with each statement describing changes in serving food, cooking, HMR items, and delivery and take-out (e.g., types of service). For the types of HMR, the 2019 processed food segment market status report published by Korea Agro-Fisheries & Food Trade Corporation was referred to [26]. Also, in the case of delivery food types, the classification of major delivery companies was referred. Statements were “Do more after COVID-19,” “Started doing it after COVID-19,” “Same as before COVID-19,” “Do less after COVID-19,” and “Did not do before or after COVID-19.”
Lastly, participants were asked about changes in their use of online and offline retailers for food and grocery shopping after COVID-19. Changes were measured by asking the respondents whether they used specific channels more after the pandemic, started using specific channel after the pandemic, used the same channels as before the pandemic, used a channel less after the pandemic, or used neither channel before the pandemic. For these variables, the respondents answered nine questions specifying the respective online retailers including online open markets (e.g., Gmarket), online supercenters (e.g., E-mart mall), online grocery-specialized stores (e.g., Market Kurly), online platforms (e.g., Naver storefarm), online eco-friendly grocery stores (e.g., Hansalim), online local food-specialized stores (e.g. Post K mall), online group-buying (e.g., Naver café, blogs), online direct transactions market (e.g., Nong-ra café) and television home shopping (e.g., use of online retailers). In addition, eight questions were asked to measure their changes in the use of offline retailers including supermarkets, supercenters (e.g., E-mart, Lotte Mart), traditional markets, department stores, eco-friendly grocery stores (e.g., organic food stores), convenience stores, portable marketplaces (e.g., markets in apartments), and direct transactions (e.g., use of offline retailers).
The second part included fifteen questions to measure changes in the 5S of dietary attitudes. The 5S of dietary attitudes was designed to measure the extent to which individuals pursued each value associated with dietary behaviors, representing the 5S of savor, safety, sustainability, saving, and socializing. This scale was derived from previous studies [2527]. For example, the participants were asked to what extent they agreed with each statement on a 5-point Likert scale from 1 (strongly disagree) to 5 (strongly agree). A sample item is, “When choosing food or grocery items, I care about taste.”
To capture socio-demographic information, participants were asked to identify their sex, age, education, annual household income, employment, household composition as a composite measure based on marital status and children in the home. Chronic diseases indicating ever being diagnosed with any chronic disease, perceived healthiness, and perceived risk of COVID-19 (measured on a 5-point scale) also served as individual characteristics (Table 1).
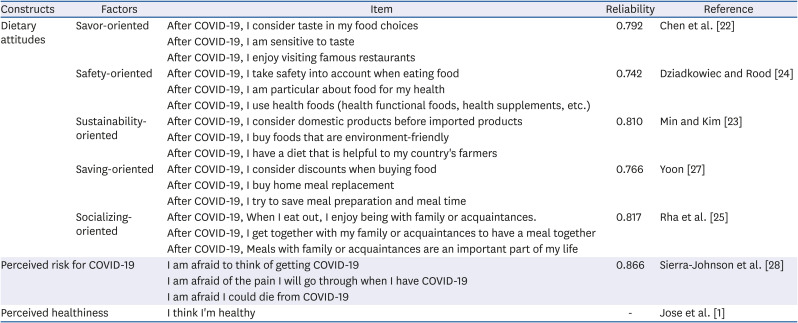
Table 1
Questionnaire items and results of reliability
| Constructs | Factors | Item | Reliability | Reference |
|---|---|---|---|---|
| Dietary attitudes | Savor-oriented | After COVID-19, I consider taste in my food choices | 0.792 | Chen et al. [22] |
| After COVID-19, I am sensitive to taste | ||||
| After COVID-19, I enjoy visiting famous restaurants | ||||
| Safety-oriented | After COVID-19, I take safety into account when eating food | 0.742 | Dziadkowiec and Rood [24] | |
| After COVID-19, I am particular about food for my health | ||||
| After COVID-19, I use health foods (health functional foods, health supplements, etc.) | ||||
| Sustainability-oriented | After COVID-19, I consider domestic products before imported products | 0.810 | Min and Kim [23] | |
| After COVID-19, I buy foods that are environment-friendly | ||||
| After COVID-19, I have a diet that is helpful to my country's farmers | ||||
| Saving-oriented | After COVID-19, I consider discounts when buying food | 0.766 | Yoon [27] | |
| After COVID-19, I buy home meal replacement | ||||
| After COVID-19, I try to save meal preparation and meal time | ||||
| Socializing-oriented | After COVID-19, When I eat out, I enjoy being with family or acquaintances. | 0.817 | Rha et al. [25] | |
| After COVID-19, I get together with my family or acquaintances to have a meal together | ||||
| After COVID-19, Meals with family or acquaintances are an important part of my life | ||||
| Perceived risk for COVID-19 | I am afraid to think of getting COVID-19 | 0.866 | Sierra-Johnson et al. [28] | |
| I am afraid of the pain I will go through when I have COVID-19 | ||||
| I am afraid I could die from COVID-19 | ||||
| Perceived healthiness | I think I'm healthy | - | Jose et al. [1] | |
![]()
Statistical analysis
We began with a descriptive analysis of each component related to dietary behaviors including changes in meal frequency, the importance of their attributes toward food and grocery shopping, types of food services, and use of online and offline retailers. The next stage of data analysis was based on consumer segments classified according to the changes in the 5S of dietary attitudes. To construct consumer segments, K-means cluster analysis was used, which is a non-hierarchical cluster analysis. Analysis of variance (ANOVA) and Scheffe's post-test were conducted to determine what differences were observed in the 5S components in the 4 groups. χ2 tests and ANOVA were performed to develop profiles of each consumer segment. All analyses were conducted using SPSS 25.0 for Windows (IBM Corp., Armonk, NY, USA).
Go to :
RESULTS
Sample characteristics
A description of our sample is outlined in Table 2. The sample was intentionally evenly divided by sex and age. The majority of our respondents had a college degree (71.9%). Less than half of the respondents had a household income between 3,000,000 and 6,000,000 KRW (46.3%). Nearly half of our respondents were married, divorced, or widowed with children.
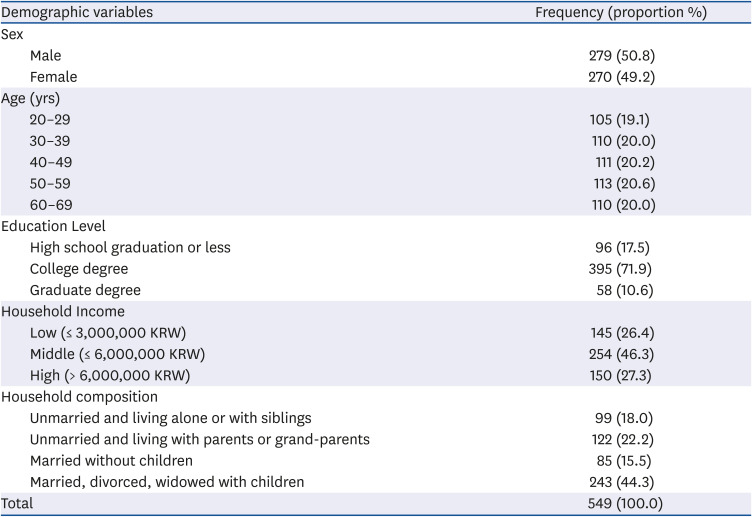
Table 2
Sample characteristics
![]()
Changes in meal frequency after COVID-19
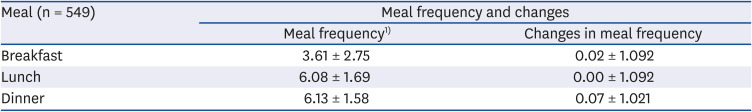
Table 3 shows the average and changes in the number of times participants ate breakfast, lunch, and dinner after COVID-19 outbreak. Consumers responded that they had lunch and dinners more than 6 times a week on average, while they had breakfast only about 4 times a week on average (3.61±2.75). However, the distribution of number of breakfast consumers had was bipolar, with 23.5% of all respondents who answered 0 breakfast per week (n=129), and 26.2% of all respondents answered that they had breakfast 7 times a week (n=144). Looking at the change in meal frequency, the number of lunches did not differ compared to before COVID-19, but the number of dinners increased by 0.07 per a week, and the number of breakfasts increased by 0.02 per a week.
Changes in the importance of attributes on food and grocery shopping after COVID-19
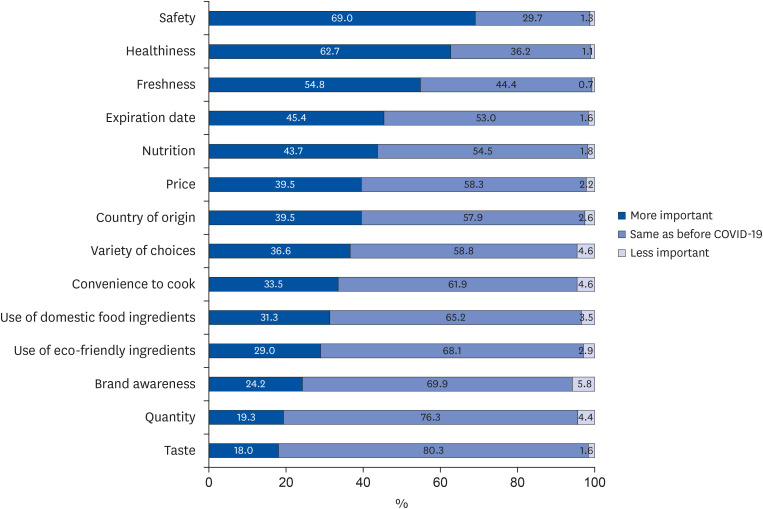
Fig. 1 presents the results of the changes in the importance of attributes that consumers considered when choosing food and grocery items after the outbreak of COVID-19. This suggests that a crisis such as COVID-19 could affect dietary choices and consumers may become more cautious. In particular, 69.0% of the 549 respondents answered that safety became more important when choosing food and groceries. Next was healthiness (62.7%), freshness (54.8%). Expiration date (45.4%), and nutrition (43.7%) had the highest response that it was similar to before COVID-19, but the response rate that it became more important was also large. On the other hand, compared to before COVID-19, brand awareness (5.8%), variety of choices (4.6%), and convenience to cook (4.6%) had relatively less importance.
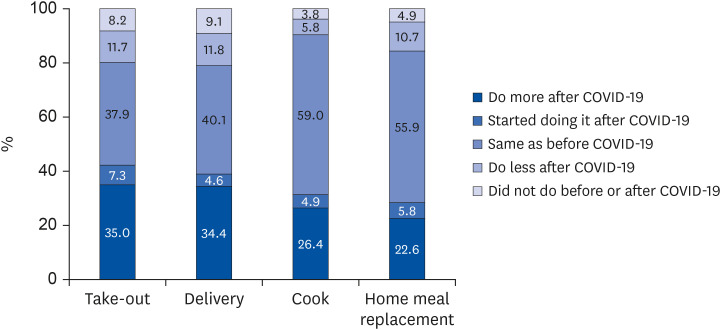
Changes in the type of services after COVID-19
Fig. 2 shows consumers' changes in the types of services they used for food and groceries. Overall, respondents reported that these two types of services were “the same as before the COVID-19 outbreak (delivery = 40.1%, take-out = 37.9%). However, the combined rate of those who responded “do it more after COVID-19” and “started doing it after COVID-19” were 42.3% for take-out and 39.0% for delivery, which were more than whose who answered that it was the same as before COVID-19. In terms of cooking and purchasing HMR, more than half of the respondents answered that cooking (59.0%) and purchasing HMR (55.9%) were the same as before the COVID-19 outbreak. However, the combined rate of “do more after COVID-19” and “started doing it after COVID-19” was much larger (cooking = 31.3%, purchasing HMR=28.4%) than the rate of “do less after COVID-19” (purchasing HMR = 10.7%, cooking = 5.8%) and “did not do before or after COVID-19” (purchasing HMR = 4.9%, cooking = 3.8%).
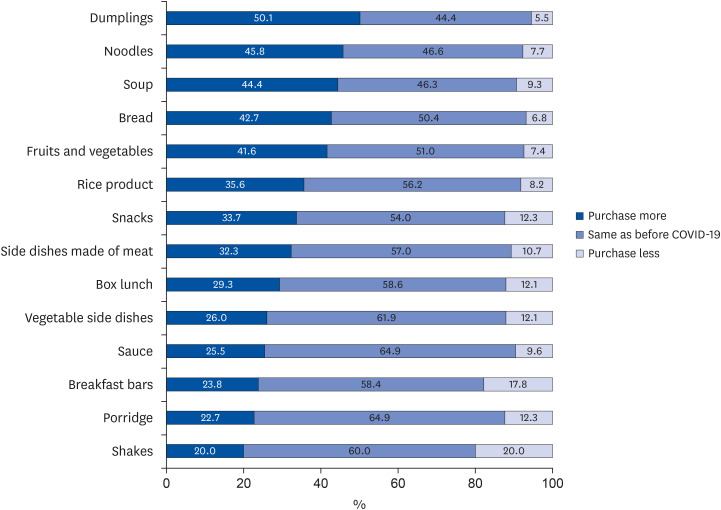
Changes in purchase of HMR after COVID-19
The results indicated that purchases HMR items increased. Thus, we further examined the types of HMR purchases in detail. The results are shown in Fig. 3 indicating significant increases in purchases of dumplings (50.1%), noodles (45.8%), soup (44.4%), bread (42.7%), and fruits and vegetables (41.6%) although the majority of responses were that purchases of all items except dumplings (44.4%) were the same as before COVID-19. These types of HMRs could supplement a meal or could be used as a snack or dessert, but they do not completely replace a whole meal. The largest decrease was purchases of meal replacement snacks for meals such as shakes (20.0%) and breakfast bars (17.8%).
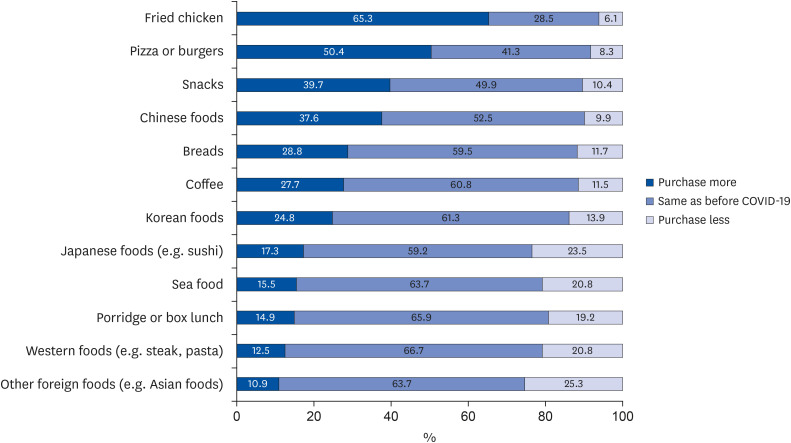
Changes in food delivery after COVID-19
Consumers were also more likely to use food delivery after the COVID-19 outbreak. Fig. 4 presents the results for the types of food delivered with increased purchases. In all items except fried chicken (28.5%) and pizza or burgers (41.3%), the highest response was the same as before COVID-19. Respondents especially bought more of two items after COVID-19: Fried chicken (65.3%) and pizza or burgers (50.4%). The proportion of responses that the purchase of snack food (39.7%) and Chinese food (37.6%) increased was also relatively high compared to other items. However, respondents reported that they bought less foreign food such as other foreign food (e.g., Asian/Chinese food), Japanese food, and Western food.
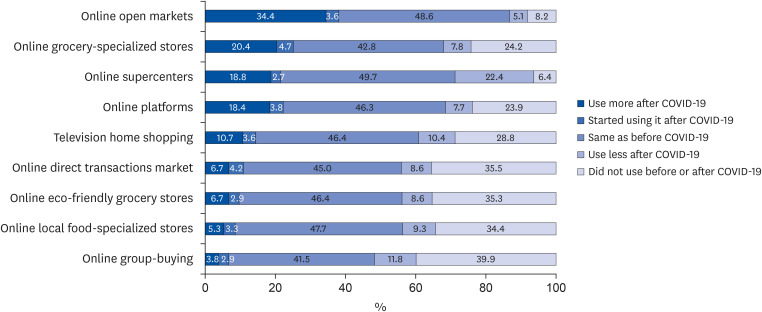
Changes in retail channels after COVID-19
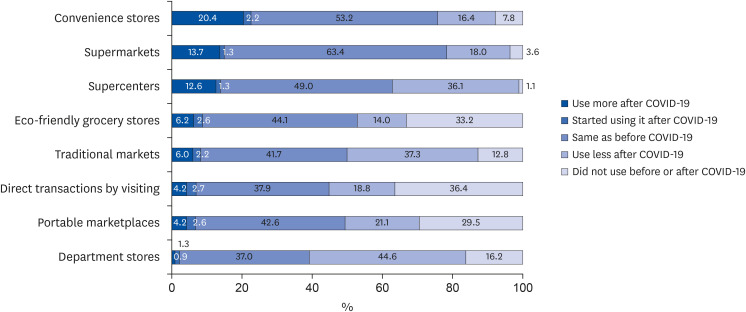
The strategy of consumers' retail channel choices also changed due to restrictions on external activities such as lockdowns due to the COVID-19 outbreak. Therefore, this study investigated changes in buying from online and offline retailers. Behavior changes in online retailer choices are shown in Fig. 5. While the overall response was the same as before COVID-19, there were several retail channels with a large response that usage increased or started to use after COVID-19. This trend was particularly remarkable for large retailers. The proportion of respondents who responded that they were more likely to use online open markets after COVID-19 was the highest (34.4%). Participants said that their online specialty grocery store purchases increased 20.4%, online supercenters increased 18.8%, and online platforms increased 18.4%. However, participants responded that they purchased from online supercenters less, and the percentage of respondents who responded that they used less after the COVID-19 outbreak was the highest among all types of retailers. In contrast, for online group-buying using blogs, social media (39.9%), and television home shopping (28.8), the percentage of respondents who did not use it before COVID-19 outbreak was high, and the percentage of those who were less likely to use these channels after COVID-19 was also high (online group-buying using blogs, social media = 11.8%, television home shopping = 10.4%).
Unlike online retail channels, the proportion of participants who responded that they were more unlikely to use offline retail channels after COVID-19 was relatively high. This empirical result indicated that consumers' restricted external activities due to COVID-19 also affected their retailer choices. This downward trend in usage was particularly noticeable in channels that traditionally dominated the retailing environment before COVID-19, including department stores (44.6%), traditional markets (37.3%), and supercenters (36.1%). Interestingly, convenience stores were the only offline retail channel that had a higher proportion of respondents who said their usage increased (20.4%), compared to those who said their usage decreased after the COVID-19 outbreak (16.4%) (Fig. 6).
Typology of consumers based on changes in 5S dietary attitudes
Table 4 shows the classification of consumer types according to changes in 5S dietary attitudes (i.e., savor-oriented, safety-oriented, sustainability-oriented, saving-oriented, and socializing-oriented) and the average values of the five components of dietary attitudes by group.
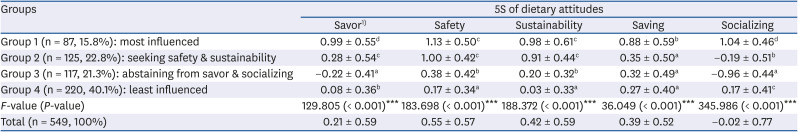
Table 4
Results of cluster analysis according to changes in the 5S of dietary attitudes
Values are presented as mean ± SD. Different letters within the same column represent significant differences between among groups according to Scheffe's multiple range test.
1)Unit of measure: points.
***P < 0.001.
![]()
In group 1, the scores of all five components of dietary attitudes were above average (savor-oriented = 0.99 ± 0.55, safety-oriented = 1.13 ± 0.50, sustainability-oriented = 0.98 ± 0.61, saving-oriented = 0.88 ± 0.59, and socializing-oriented = 1.04 ± 0.46). This group was named “most influenced” with 87 respondents (15.8%) belonging to this group. Group 2, named “seeking safety and sustainability” was a group whose average values of safety-oriented (1.00 ± 0.42) and sustainability-oriented (0.91 ± 0.44) attitudes were higher than average, with 125 (22.8%) of the respondents belonging to this group. Group 3 was named “abstaining from savor and socializing” because their savor-oriented (−0.22 ± 0.41) and socializing-oriented (−0.96 ± 0.44) scores were significantly lower than those of the other groups. The number of respondents belonging to this group was 117, accounting for 21.3% of the total. Lastly, in Group 4, the average values of the five components were similar to the overall average or had little change, so this group was named “least influenced” with 220 respondents (40.1%) in this group.
The combined proportion of the groups showing significant changes in the 5S of dietary attitudes after COVID-19 (groups 1, 2, and 3) was about 60% of the total, accounting for a greater proportion than the consumer group that did not change their behaviors (group 4). This indicates, once again, that consumers' dietary behaviors could change based on exogenous variables such as the pandemic.
In this study, χ2 tests and ANOVA were conducted to identify the characteristics of the four groups and to establish their profiles. The results are shown in Table 5.
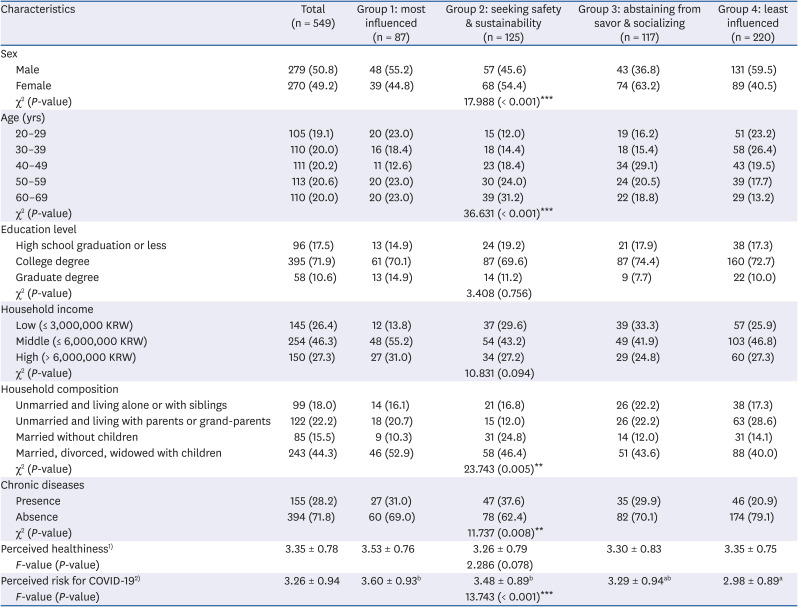
Table 5
Profiles of each group classified based on changes in the 5S of dietary attitudes
Values are presented as mean ± SD or number (%). Different letters within the same column represent significant differences between among groups according to Scheffe's multiple range test.
COVID-19, coronavirus disease 2019.
1)Perceived healthiness is a subjective perception of one's overall health (1: strongly disagree, 5: strongly agree).
2)Perceived risk for COVID-19 is the perception of being infected with COVID-19, the pain or fear of death from infection (1: strongly disagree, 5: strongly agree).
**P < 0.01, ***P < 0.001.
![]()
This study demonstrated that there were differences in the demographic factors among the groups based on sex, age, and household composition. In terms of sex, the percentage of men in the “most influenced” group was higher compared to women. However, women were more likely to be in the group that valued safety and sustainability (i.e. “seeking safety and sustainability”), or they gave up hedonic elements of diet such as flavor and socializing (i.e., savor and socializing abstained). Examining the differences based on age, respondents in their 20s, 50s, and 60s belonged to the “most influenced” group. In particular, the proportion of survey subjects in their 50s and 60s compared to other age groups was higher in the “seeking safety and sustainability” group. More respondents in their 40s compared to other age groups tended to reduce savor or socializing oriented activities due to the outbreak of COVID-19. In contrast, young people in their 20s or 30s relative to other age groups did not change their food-related lifestyle after the COVID-19 outbreak. In the case of the twenties, the change in 5S dietary attitudes showed a bipolar tendency. In other words, due to COVID-19, all 5S dietary attitudes became important (23.0%), or conversely, there was no change in 5S dietary attitudes (23.2%). There were also differences among groups according to household composition. In addition, respondents who were married with no children were most often in the “seeking safety and sustainability” group. In contrast, single-person households or respondents living with siblings were relatively more likely to belong to the “abstaining from savor and socializing” group that had given up hedonic elements of dietary attitudes. The proportion of respondents who were not married and lived with their parents or grandparents, was relatively high in the “least influenced” group.
In addition to demographic variables, the findings demonstrated differences among groups by consumer-related characteristics. First, there was a statistically significant difference based on whether or not they had a chronic disease. Relatively high proportions of respondents who had a disease were in the “most influenced” group or “seeking safety and sustainability” group. For those without a chronic disease, many respondents belonged to the group with no change in food-related lifestyle after the outbreak of COVID-19.
Lastly, the results revealed that there were differences among groups based on their perceived risk for COVID-19. The ANOVA showed that the “least influenced” group had the lowest perceived risk for COVID-19, which was also statistically significant. The perceived risk level for COVID-19 in this group was 2.98 ± 0.89, which was lower than the average level of concern. In contrast, the “most influenced” and “seeking safety and sustainability” groups showed a statistically significantly higher perceived risk level for COVID-19 compared to the other groups. In particular, the ““most influenced”” group had the highest average value of perceived risk level for COVID-19 (3.60 ± 0.93) among the four groups. These results imply consumers' dietary behavior could change in a variety of ways based on environmental factors such as COVID-19.
Go to :
DISCUSSION
The COVID-19 outbreak around the world fundamentally altered the way we think and behave in the marketplace. Recent papers on changes in dietary behaviors have focused on how spending and transactions related to dietary behaviors quantitatively changed and were influenced by the COVID-19 pandemic. This study analyzes survey data drawn from Korean consumers to investigate various aspects of dietary behaviors and attitudes at a deeper level to depict changes in Korean consumers' dietary lifestyle since the COVID-19 outbreak.
The major results and implications can be summarized as follows. Respondents reported that they increased the number of times they ate dinner while breakfast and lunch remained unchanged since the COVID-19 pandemic. Nutritional evidence indicates that there are many health benefits to having regular meals [2829], which implies that Korean consumers have been concerned more about health issues as the fear of COVID-19 persists. This is also supported by our finding that safety, healthiness, and freshness attributes have been considered more important than before the outbreak when choosing food and grocery items.
Among the types of food and grocery services, the findings indicate that the use of delivery and take-out increased more compared to cooking and HMR since the outbreak. This is consistent with research that has highlighted a sharp increase in spending on food delivery [1430] as well as a small increase in grocery shopping during the the pandemic [914]. This also agrees with the notion that groceries for home-cooking behaviors are a basic human need and thus are the least affected by economic and social shocks such as the pandemic [3].
Our results further exhibit that the greatest increase in home delivery items after COVID-19 were fried chicken, pizza or burgers, and snacks. These foods are fast food items, which are characterized by the fast speed food can be served with minimal preparation. Previous studies have reported that fast food is high in calories and high in saturated fatty acids and sodium with few fruits and vegetables, implying a lack of vitamins and minerals, resulting in irregular dietary habits and obesity [3132]. Fast food is also high in meat and fat, and can cause nutritional imbalances with an unhealthy effect, especially in young children and adolescents in their growing years who have not fully formed their dietary habits [333435]. Therefore, this finding calls for future research on how the pandemic has influenced unhealthy dietary behaviors and nutritional imbalance.
Consistent with past studies on changes in online and offline spending since the outbreak [36], our findings suggest that the use of online channels such as online open markets, online grocery-specialty stores, online platforms, and online supercenters have significantly increased compared to other types of online and offline retailers. A substantial rise in the use of convenient stores for food and grocery shopping suggest the tendency to avoid crowded stores as a consequence of social distancing and safety-seeking behaviors [37].
Four clusters are profiled based on socio-demographic factors, subjective and objective health conditions, and perceived risk for COVID-19. The fact that the proportion of groups that changed dietary attitudes and behaviors accounted for more than half of the population suggests that exogenous effects may have led to changes in dietary lifestyle, and the changes occurred in various ways. In particular, risk perception has been discussed as an essential component in predicting safety and health-related behaviors [36]. Consumers who are aware of a specific risk take more preventive actions to avoid threats [3738]. In addition, perceived risk is a key factor that encourages consumers' safety-oriented and health-promoting behaviors. The results of this study show that a change in safety and sustainability was the highest among the five factors of dietary attitudes. In addition, about 40% of the respondents whose attitudes and behaviors changed were in the “seeking safety and sustainability” group. These results imply that changes in consumers' dietary attitudes and behaviors toward safety and health can vary depending on their risk perception of the outbreak. This finding presents empirical evidence to support the existing discussion on the relationship between risk perception and consumer behavior.
The present exploratory study does not attempt to test the significance of the effects of the COVID-19 pandemic on dietary attitude and behavior variables. Thus, readers should be cautious in interpreting our findings as evidence of causal effects and relationships with the pandemic since we did not isolate the effects of individual preferences and overall market trends. Therefore, future work should consider applying more rigorous methodology to examine the extent to which changes in dietary attitudes and behaviors such as increases in delivery or online shopping are actually driven by the pandemic.
Another limitation of current study concerns that we did not consider psychological and cognitive factors that might affect the dietary attitudes and behaviors during the pandemic. Considering their significances in dietary research and social and environmental changes occurred during the pandemic, psychological and cognitive factors could be examined by future work to describe changes in dietary attitudes and behaviors in the post-corona era.
This study is one of the few to look at both behavioral and attitudinal changes in dietary lifestyle simultaneously and examine consumer segments clustered based on dietary attitudes. Understanding changes in dietary behaviors and attitudes driven by exogenous shocks such as the COVID-19 pandemic is important when considering significant disparities in market growth across grocery and food-related industries. This study contributes to this line of research by providing initial insights on changes in dietary attitudes and behaviors brought on by COVID-19.
Go to :
 XML Download