

 PDF
PDF Citation
 Print
Print


INTRODUCTION
Employee food safety practices, such as maintaining good personal hygiene, are critical to preventing foodborne illness [1]. Despite rapid technological development in the food service industry, many parts of food processing are still handled by restaurant employees. A study showed that 300 cases of foodborne illnesses were associated with poor personal hygiene, including bare hand contact with food [2]. Food safety should be practiced at all times at all food establishments [13]. Previous pandemic diseases have highlighted the importance of personal hygiene, one of the critical points in food safety. The recent outbreak of coronavirus disease 2019 (COVID-19) has highlighted the importance of personal hygiene and social distancing [4]. Consumers anxious to avoid COVID-19 have reduced or eliminated trips to dine at a restaurant [5] and are instead purchasing their food at the grocery store as a substitute food away from home (FAFH) [6].
The food service industry has expanded non-contact delivery methods to increase delivery service and maintain business [6]. Consumers avoided eating at foodservice establishments during the COVID-19 pandemic. The foodservice industry adopted governmental recommendations to encourage customers to resume eating out post-COVID. They include government regulations such as distancing tables and chairs and using signs such as ‘please leave this table/chair empty.’ Groups of more than 4 people are not allowed to dine together. However, average sales decreased almost 50% compared to the same month the previous year [7]. People are concerned about the spread of the coronavirus and are cautious of contaminated surfaces. Food delivery was already mainstream in the foodservice industry, but it peaked during and after the pandemic. Before the pandemic, food delivery involved contact between those who ordered the food and those who delivered it. However, the pandemic has encouraged non-contact delivery methods in which food is left at the door and payment processed online.
Some caution that food safety issues still exist in food delivery systems, which might negatively affect foodservice businesses. One characteristic of FAFH is that customers are unaware of how food is prepared and cooked, which is in a line with employee food handling practices. Hence, this new hygiene grade certificate scheme can be a good indicator for customers who wish to be informed of the food safety practices at restaurants.
The protection motivation theory (PMT) was originally developed to study behavioral changes triggered by protection motivation in the face of fear-inducing information [8]. Protection motivation, an intention to perform a health behavior, is measured by threat and coping appraisal. It is synonymous with the intention to behave [9] and induced by threat and coping responses that influence behavioral changes. Threat appraisal consists of severity and vulnerability increasing the adaptive coping process, which leads to adopting the recommendation. A higher threat level leads to a greater possibility of adopting the recommendation [10] For example, a threat may convince an individual to reduce their skin cancer risk by avoiding sunbathing [11]. For this study, vulnerability was defined as how susceptible the individual was to contracting a foodborne illness from eating at a restaurant with unsanitary conditions. Severity was defined as how grave the symptoms would be if they contracted a foodborne illness from eating at an unsanitary restaurant. However, the benefits of not following the recommendation and the cost of following the recommendation would negatively influence protection motivation [12]. If reasonable prices at a restaurant with a lower certificate rating attract consumers, they are not going to a restaurant with a higher certificate rating.
A coping appraisal is one's ability to follow recommendations by altering their behavior. It is a strong predictor of intention than threat appraisals [9]. Coping appraisals consist of response efficacy and self-efficacy, which both lead to the adaptive response [10]. The response cost prevents a person from adopting the recommendations [12]. Response efficacy is defined as an individual's faith that adopting a recommendation (in this study, going to a restaurant with a higher certificate rating) would prevent negative outcomes. Self-efficacy is an individual's belief that they can follow a recommendation. In this study, self-efficacy was one's perceived ability to choose a food-safe restaurant. Cost can be defined as all monetary and non-monetary values. Dining at a restaurant with a higher rating incurs a higher cost, and thus the consumer might not visit this restaurant.
The Republic of Korea started a restaurant hygienic grade certificate (RHGC) program in 2017. This new program is based on a restaurant's voluntary participation to ensure 3 purposes: promote hygienic food practices, ensure consumers of food safety practices at restaurants, and create a healthy environment without foodborne illnesses. This certificate has 3 different levels based on inspection results, such as excellent with 3 stars (90 +), very good with 2 stars (85–<90), and good with 1 star (80–<85) [13].
In the U.S., various forms are used to report food safety practices at a restaurant, including a numeric grade, alphabetical grade, or narrative reports. In the UK, more than 100 local authorities are currently publishing an online 5-star rating system. Other systems in use involve smiley faces or traffic lights [14].
The hygiene grade certificate system's effects on preventing foodborne illness and consumer response to the certificate system are unknown. However, consumers’ cautious approaches to food safety are promising. For instance, consumers are unwilling to choose unsafe restaurants [15]. How consumers perceive food safety during food delivery should set a precedence for safe food delivery. This study uses PMT variables to investigate if the new hygienic grading system affects consumers' restaurant selections. Previous experience with a foodborne illness at a restaurant affects an individual's protection motivation using PMT variables. Lastly, this study measured the effect of PMT variables, certificates, and foodborne illness experience on protection motivation.
Go to : 
SUBJECTS AND METHODS
Sample
Before we used an online survey to collect data, we sought ethical approval from the research Institutional Review Board (1041549-200407-SB-95). We distributed online questionnaires to 378 individuals over 3 months and collected 310 responses. Before the survey, we explained the purpose of the study and received consent. The survey took 10 min to complete was on the goggle survey platform. There were 3 different questionnaire forms: one presented a hygienic grade of ‘excellent,’ a second presented a grade of ‘very good,’ and the third present a grade of ‘good.’ To verify that the respondents read the hygienic grades correctly, we asked them what grade appeared on the questionnaire before more questions were answered. Questionnaires with 10 incorrect answers were eliminated and a total of 287 were further analyzed.
Research instrument
Questions were adopted from previous research [81617]. The survey used 3 versions of the questionnaire. Each version showed a different level of a restaurant hygienic certificate, ‘excellent,’ ‘very good,’ or ‘good.’ Section 3 was the only one related to the different hygienic certificates, showing one of the 3. Questions regarding PMT were asked on a 5-point Likert scale (1: strongly disagree to 5: strongly agree) and were adopted from previous studies [1617]. We also asked about demographic characteristics, such as health status, previous experiences of contracting foodborne illnesses, and weight and height measurements to calculate their body mass indexes (BMIs). BMIs were categorized into low weight (< 18.5), normal weight (18.5–22.9), overweight (23–24.9), and obese (> 25) [18].
Statistical analysis
All data were entered into Excel and analyzed using Software Package for the Social Sciences for Windows (version 23, 2019; SPSS Inc., Chicago, IL, USA). The construct validity of the PMT variables was assessed by exploratory factor analysis using maximum likelihood estimation. Cronbach's alphas were computed for the internal consistency of the PMT variables. Tukey honestly significant difference (HSD) was conducted to find significant differences by different certificate levels on PMT variables. A Mann-Whitney U test was conducted to find significant differences in experiences of foodborne illness from eating at restaurants. Those who have experienced foodborne illnesses from eating at restaurants were coded as “1,” otherwise individuals were coded as “0.” The χ2 was run on respondents' health conditions for statistical significances among PMT variables. Multiple regression was used to investigate if the PMT variables influenced respondents' protection motivation. Lastly, descriptive analyses were run to determine the respondents' previous experience with foodborne illnesses and general health conditions.
Go to :
RESULTS
Demographic characteristics
Table 1 shows the respondents' demographic characteristics. Of all respondents, 45.5% were male and 54.5% were female. Most were single (63.1%), while 36.9% were married. More than half of the respondents were between the ages of 20–29 years old (56.4%), while 16% were age 40–49, 13.9% were between the ages of 50–59 years old, 11.1% were age 30–39, and 2.4% were age 60 and over. The majority of the respondents were attending college (42.2%), while others had a bachelor’s degree (24.7%), a Master's degree and above (11.5%), an associate degree (10.8%), and a high school diploma or less (10.5%). Regarding BMI, 75% of the respondents were of normal weight, while 18.5% were overweight, 4.2% were underweight, and 2.2% were obese. About half of the respondents (55.7%) earned less than 2 million won per month. Interestingly, the majority of the respondents (82.5%) had not contracted a foodborne illness from eating at a restaurant, and most of the respondents (51.4%) considered their health condition as good.
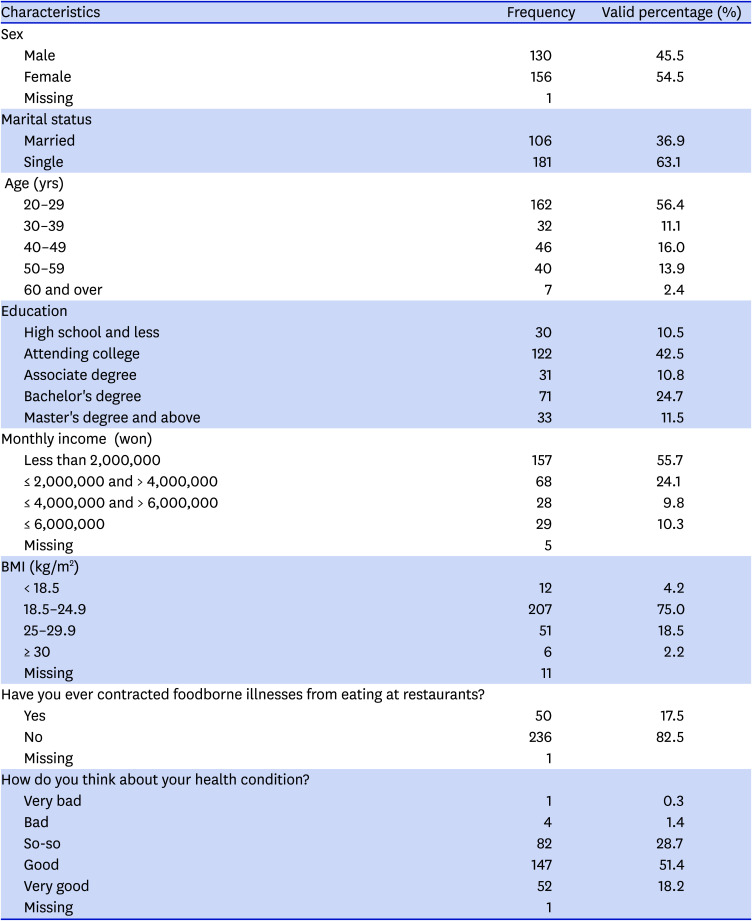
Table 1
Characteristics of demographics and eating out behaviors (n = 287)
![]()
Comparisons of perceptions of different levels of certificates by PMT variables
We ran an exploratory factor analysis using maximum likelihood rotation with the varimax rotation on 21 items to determine the structure of the PMT and the 5 factors of threat, coping, benefit, cost, and protection motivation (Table 2). We measured the internal consistency of the variables. The Cronbach’s alpha for each variable were threat (0.826), coping (0.827), benefit (0.908), cost (0.645), and protection motivation (0.640). According to Nunnally [19], values acceding 0.6 would be acceptable.
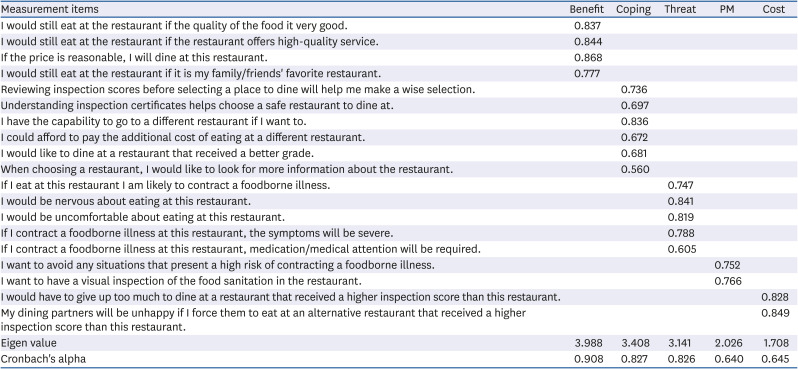
Table 2
Exploratory factor analysis of the PMT variables (n = 284)
![]()
The perceptions of the PMT variables were measured and compared among the 3 different certificate levels of good, very good, and excellent using the Tukey HSD (Table 3). Threat (P < 0.001) and benefits (P < 0.001) showed significant differences among the 3 different certificate levels. For threat, the good certificate (m = 2.763, SD = 0.715) received higher levels of perception than very good (m = 2.379, SD = 0.643) and excellent (m = 2.105, SD = 0.632). For benefit, the good certificate (m = 3.490, SD = 0.800) received lower perception levels than very good (m = 3.992, SD = 0.670) and excellent (m = 4.361, SD = 0.516).
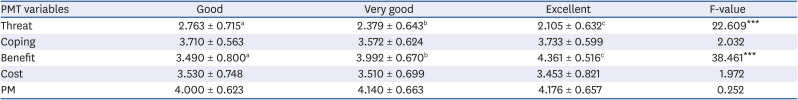
Table 3
Comparisons of the PMT variables by levels of certificates
Values are presented as mean ± SD. Variables were determined using Tukey honestly significant difference. Different alphabets indicate significantly different from each other.
PMT, protection motivation theory; PM, protection motivation.
***P < 0.001.
![]()
The perceptions of PMT variables were compared by respondents' experience with foodborne illnesses from eating at restaurants. The results of a Mann-Whitney U test are shown in Table 4. Threat (P < 0.05) and protection motivation (P < 0.01) showed significant differences. Respondents who had foodborne illnesses from eating at a restaurant showed higher levels of threat (m = 0.608, SD = 0.588) than those who did not (m = 2.393, SD = 0.736). For protection motivation, respondents with previous experiences of foodborne illness had higher protection motivation (m = 4.310, SD = 0.533) than who did not (m = 4.098, SD = 0.649).
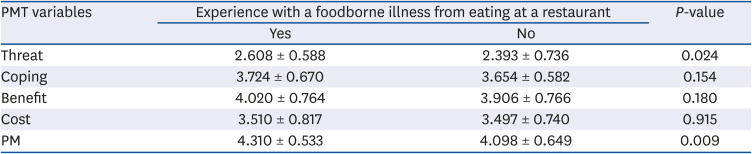
Table 4
Comparisons of the effect of the experience of a foodborne illness from a restaurant on PMT variables
Variables were determined using Mann-Whitney U test. P-values at 0.05.
PMT, protection motivation theory; PM, protection motivation.
![]()
Regression analysis for PMT variables
Levels of certificates, experience with foodborne illnesses, threat, coping, benefit, and cost were regressed on protection motivation (Table 5). Previous experience with foodborne illnesses contracting at a restaurant (B = 0.209, SE = 0.090, P < 0.05), coping appraisal (B = 0.503, SE = 0.065, P < 0.001), and benefit (B = 0.153, SE = 0.055, P < 0.01) influenced protection motivation. The certificate level, threat, and cost did not have an impact on protection motivation.
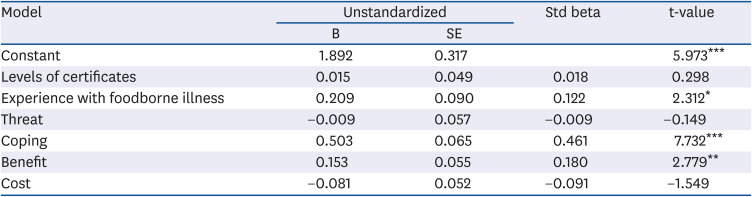
Table 5
Results of regression analysis of PMT variables, certificates, and experience with foodborne illness influencing PM
PMT, protection motivation theory; PM, protection motivation; Std, standardized.
F = 17.535, P = 0.000, R = .530, R2 = .281, adjusted R2 = .265.
*P < 0.05, **P < 0.01, ***P < 0.001.
![]()
Go to :
DISCUSSION
This study examined if an RHGC reflects restaurant food safety to consumers using PMT variables. The 3-tier certificates showed significant differences in threat and benefits. The results indicate that consumers perceived threats differently based on the 3-tier certificates. Consumers considered the 3-tier certificates differently regarding how vulnerable they are to unsanitary restaurant conditions. Perceptions of illness severity affected consumers by certificate level. A restaurant rated as excellent received the lowest threat among the 3 certificates, and each certificate was significantly different based on threat perception. It can be concluded that consumers distinguish the 3 certificates differently based on threat. Consumer responses were impacted by the benefits of selecting a restaurant that received a better grade. With the same benefit level, consumers prefer restaurants that received a higher grade.
However, coping appraisal, cost, and protection motivation did not differ by certificate level. Three-tier certificates were not perceived differently when consumers considered the messages that the certificates convey. The cost of choosing a restaurant might not be different based on the certificate grade. The protection motivation was high for all 3 certificates, and individuals may have the same level of motivation to protect themselves from contracting a foodborne illness at a restaurant regardless of the certificate grade levels. Interestingly, higher certificate grades were associated with a higher perception of protection motivation. A higher grade may have induced consumers with more interest in food safety to have a higher protection motivation.
Threat and protection motivation differed between respondents who had experience with a foodborne illness from a restaurant and those that had not. Consumers who had previously contracted a foodborne illness were more threatened by the consequences of contracting another foodborne illness. They also formed higher protection motivation than those who had not experienced a foodborne illness from a restaurant.
In this study, experience with a foodborne illness, coping appraisal, and benefits affected protection motivation. Previous experiences affected self-protection against the possibility of getting sick. The coping appraisal had an impact on protection motivation, which was usually stronger than threat appraisal [16]. In this study, threat appraisal was not a predictor of protection motivation, as previous research found that threat appraisal of food terrorism attacks was not a strong factor in foodservice directors' intentions of a food defense program [20]. Intentions of eating at a restaurant that received a ‘good’ certificate were lowest when the same benefits were provided. Consumers consider food safety before any other benefits.
The new 3-tier certificate system does help communicate the importance of food safety violations with managers [21]. This study suggests that consumers are influenced by the words/symbols used in the certificates. The 3 certificates convey similar meanings. The wording ‘excellent,’ ‘very good,’ and ‘good’ can be categorized as ‘good.’ It would be courteous of health departments to not alert consumers of a bad certificate grade, as this would affect business. Using symbols (stars) and simple words helps consumers and managers understand the grading system. It was previously noted that managers prefer a letter grade or a numeric score [21]. The format influenced the way consumers evaluated the information [22]. Therefore, the current 3-tier system considers both consumers and restaurant managers. However, consumers would not differentiate this enumeration of ‘good’ for the motivation to protect themselves. For example, the levels A, B, and C with different colors which is used in some areas of the United States might be more effective.
This study has some limitations. We used an online survey, which did not require face-to-face interactions. Hence, respondents might have had some difficulty understanding some of the questions. Also, this study used PMT theory to verify consumer responses to the newly adopted 3-tier restaurant hygiene certificate system. PMT was originally developed for health communications, and other theories may be better suited to investigate consumer responses to the certificates. Therefore, PMT is limited in predicting consumer behaviors and responses to restaurant hygiene certificates. Lastly, not all of the consumers in the Republic of Korea are aware of this 3-tier certificate system, so an expanded study sample will be required in future research.
Go to :
 XML Download