

 PDF
PDF Citation
 Print
Print


INTRODUCTION
Polymyalgia rheumatica (PMR) is an inflammatory rheumatic disease affecting the elderly. The prevalence of PMR varies across countries and regions; it is relatively common in Western countries, especially among Caucasian patients, but is considered a rare disease in Korea.123 In addition, the risk of concomitant giant cell arteritis is relatively low in Korean PMR patients.3 Consequently, less attention has been paid to Korean patients with PMR and their management than in Western countries.
The treatment of PMR is primarily based on glucocorticoids (GCs). Methotrexate (MTX) and tocilizumab have also shown some benefits for PMR patients.456 Although the symptoms of PMR are typically well-controlled by a low dose of GC, relapses are frequent when GC is tapered or discontinued. Therefore, a considerable number of PMR patients receive prolonged GC treatment including periods after restarting GC due to relapse,7 which may lead to adverse events such as osteoporosis and osteoporotic fracture.
Despite the risks associated with long-term use of GC in PMR patients, and the well-known adverse effects of GC on bone metabolism,8 the issue of fractures in PMR patients has been less studied, especially in Asia. There are no data available regarding fracture risk and risk factors in Asian patients with PMR, and there has been little discussion about the pattern of practice for fracture prevention in PMR patients. Geographical variation in fracture epidemiology, and cultural variation in strategies for fracture prevention, have heightened the need for further studies in Asian patients with PMR.910
Therefore, we aimed to evaluate osteoporotic fracture risk and fracture risk factors in Korean patients with PMR.
METHODS
Study population
We conducted a retrospective cohort study of patients with PMR who visited a rheumatology clinic at a tertiary referral hospital in Korea between March 2005 and March 2018. Patients were included based on the 1984 Healey criteria or the 2012 European League Against Rheumatism/American College of Rheumatology criteria for PMR.1112 Patients with other rheumatic diseases and diseases requiring GCs or immunosuppressive therapy were excluded.
The index date was defined as the first date of diagnosis of PMR. If patients were diagnosed with PMR in the referring hospital, the first date of observation was taken as the index date. All enrolled patients were observed until the time of their last visit, or December 2020. Patients with short follow-up durations (< 3 months) were excluded.
Data collection
We collected demographic information (age and sex), disease-specific clinical information (disease duration, laboratory tests, and PMR-related medications), and osteoporosis or fracture related factors (history of prior fracture, medications associated with fracture prevention) by medical chart review.
In terms of medication, we recorded the non-steroidal anti-inflammatory drugs (NSAIDs), MTX, calcium/vitamin D (Vit.D) supplements, and anti-osteoporotic medications that were prescribed during the initial 6 months. The initial dose of GC was identified as the peak dose in the first month of treatment. All types of systemic GC (intravenous or oral) were included, and calculated as prednisolone-equivalent doses. Anti-osteoporotic medications included pharmacological agents that have clear evidence of efficacy for fracture prevention such as bisphosphonates, selective estrogen receptor modulators (SERMs), receptor activator of nuclear factor kappa B ligand (RANKL) monoclonal antibody, and parathyroid hormone.
Bone mineral density measurement as a tool to assess risk of fracture
In addition to the use of anti-osteoporotic agents, we considered the performance of the bone mineral density (BMD) test as a potential first step in fracture prevention. Hence, we collected information about the performance of the BMD test during the early treatment period. Patients were divided into two subgroups: those for whom baseline BMD was assessed between 1 year before and 6 months after diagnosis were placed in the BMD test group, and all others in the no BMD test group. We further divided the BMD test group into 3 subgroups according to the World Health Organization T-score criteria, based on the lowest T-score among those for the lumbar spine, femoral neck, and total hip (normal bone; T-score > −1.0 standard deviation [SD], osteopenia; T-score −1.0 to −2.5 SD, and osteoporosis; T-score ≤ −2.5 SD).13
Identification of new osteoporotic fractures
Osteoporotic fractures were defined as fractures occurring after low-energy trauma (e.g., a fall from a standing height or less). Patients presenting with a fracture occurring following high-energy trauma and pathological fracture were not included.
We systematically reviewed radiology and medical records for the entire observation period. Fractures newly detected on radiographs were identified as new osteoporotic fractures. If a previous image was not available for comparison, radiographically proven fractures requiring medical management including admission, visit to emergency room, operation, or new prescription were counted as new osteoporotic fracture cases. Fractures on radiology were identified by a musculoskeletal radiologist. If the patient received medical care for a fracture in another institution, we only included the fracture if the medical records identified the fracture site.
The fracture date was defined as the date that the fracture was detected in radiographs. Data on the fracture site, and clinical outcomes of the fractures, were also collected.
Statistical analyses
Demographic and clinical characteristics of patients were described in a descriptive analysis. We compared the characteristics of the BMD test group and the no BMD test group using Student's t-tests for normally distributed data and the Mann-Whitney U test for non-normally distributed data. Dichotomous variables were analyzed by χ2 tests. The incidence rates of osteoporotic fractures were calculated per 100 person-years (PYs) with 95% confidence intervals (CIs). To identify independent risk factors associated with the occurrence of fractures in PMR patients, we calculated unadjusted and adjusted incidence rate ratios (IRR) using Poisson regression analysis. Variables significant at the P < 0.2 level in the univariable model and certain clinically significant variables were advanced to multivariable Poisson regression models.
All analyses were performed using SPSS (version 26.0; SPSS Inc., IL, USA). P < 0.05 was considered statistically significant.
RESULTS
Demographic and clinical characteristics of patients with PMR
A total of 95 PMR patients were included in the study (Fig. 1). The demographic and clinical characteristics of the patients are summarized in Table 1. The median (interquartile range [IQR]) age of the patients was 64.0 (56.0–72.0) years, and the proportion of females was 72.6%. The median (IQR) disease duration from symptom onset was 7.0 (3.6–10.0) months, and the patients were observed for a median (IQR) of 40.5 (22.8–77.3) months from the index date. With regard to medications, all of the study population were on GCs, and the median (IQR) initial dose and cumulative dose over the first 6 months were 10.0 (5.0–15.0) mg and 0.9 (0.6–1.2) gram, respectively. Forty-seven patients (49.5%) were prescribed MTX. In addition, 29.5% of the patients were taking calcium/Vit.D supplements and 22.2% were taking anti-osteoporotic medications.
Fig. 1
Flow chart of patient selection.
PMR = polymyalgia rheumatica, RPGN = rapidly progressive glomerulonephritis.
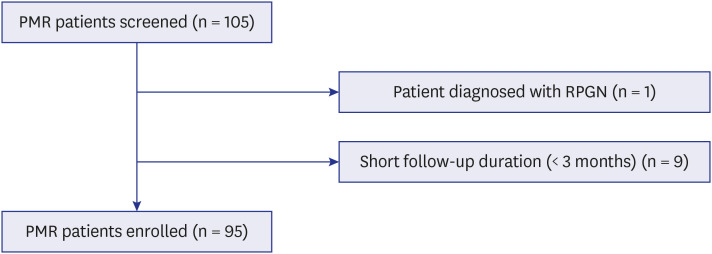
Table 1
Demographic and clinical features of the study population
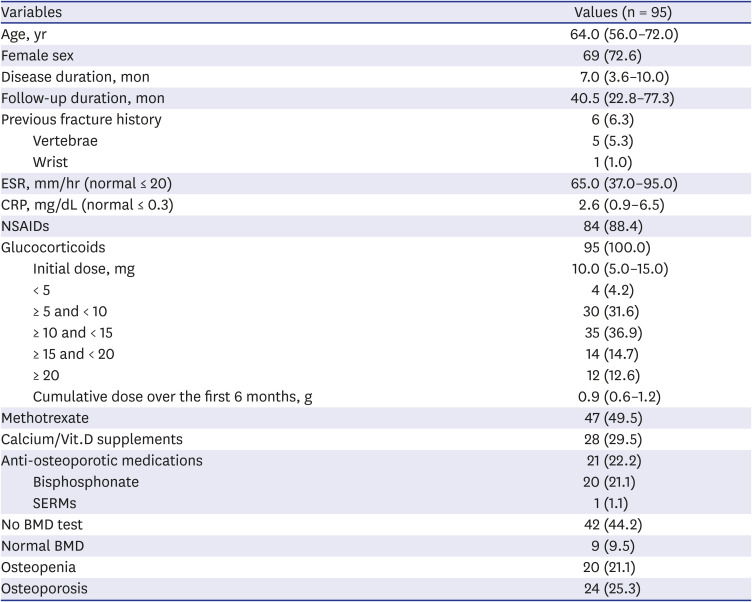
Numerical quantitative data are presented as medians (IQR) and categorical data are presented as frequencies (%).
IQR = interquartile range, ESR = erythrocyte sedimentation rate, CRP = C-reactive protein, NSAIDs = non-steroidal anti-inflammatory drugs, Vit.D = vitamin D, SERMs = selective estrogen receptor modulators, BMD = bone mineral density.
Patterns of fracture prevention
As shown in Table 1, baseline BMD was measured in 53 (55.8%) patients. The most common diagnosis following BMD measurement was osteoporosis (n = 24, 25.3%), followed by osteopenia (n = 20, 21.1%) and normal (n = 9, 9.5%).
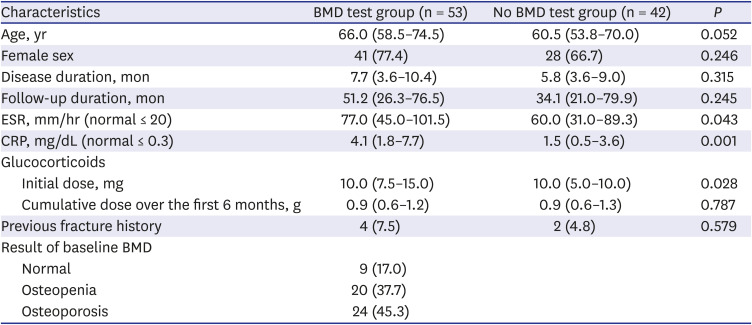
Patients who underwent baseline BMD screening had a higher erythrocyte sedimentation rate (ESR) and higher C-reactive protein (CRP) level than those without baseline BMD (77.0 [45.0–101.5] mm/hr vs. 60.0 [31.0–89.3] mm/hr, P = 0.043; 4.1 [1.8–7.7] mg/dL vs. 1.5 [0.5-3.6] mg/dL, P = 0.001). And the median (IQR) initial GC dose was higher in the BMD test group than the no BMD test group (10.0 [7.5–15.0] mg vs. 10.0 [5.0–10.0] mg, P = 0.028). Patients in the BMD test group tended to be older than those in the no BMD test group, but the difference did not reach statistical significance (66.0 [58.5–74.5] years vs. 60.5 [53.8–70.0] years, P = 0.052). There were no significant differences in disease duration, follow-up duration, and cumulative dose of GCs over the first 6 months (Table 2).
Table 2
Characteristics of patients according to baseline BMD screening
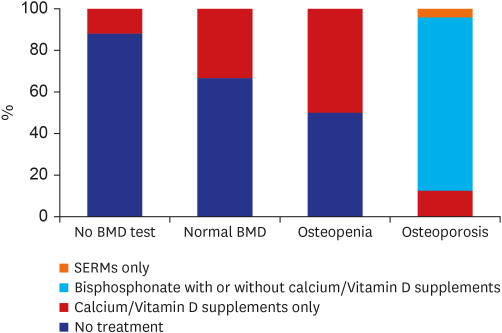
Fracture prevention patterns differed according to BMD (Fig. 2). More efforts seemed to be made to prevent fractures in the patient groups in the following descending order: osteoporosis group, osteopenia group, normal BMD group, and no BMD test group. Only 11.9% (5/42) of patients in the no BMD test group were treated with calcium/Vit.D supplements, while 33.3% (3/9) of the normal BMD group received calcium/Vit.D supplements. In the osteopenia group, 50.0% (10/20) of the patients were on calcium/Vit.D supplements, while in the osteoporosis group all the patients received calcium/Vit.D and/or anti-osteoporotic medications (calcium/Vit.D supplements only, 12.5% [3/24]; bisphosphonate with or without calcium/Vit.D supplements, 83.3% [20/24]; SERMs only, 4.2% [1/24]). Anti-osteoporotic medications such as bisphosphonate and SERMs were prescribed only in the osteoporosis group.

Incidence rates of osteoporotic fracture in patients with PMR
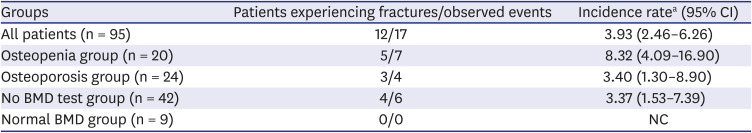
During a median (IQR) follow-up duration of 40.5 (22.8–77.3) months and a total of 433.1 PYs, 17 fractures were observed in 12 patients. Seven (41.2%) fractures occurred in the osteopenia group, 4 (23.5%) in the osteoporosis group, and 6 (35.3%) in the no BMD test group. No fractures were observed in the normal BMD group. The overall incidence of fracture was 3.93 (95% CI, 2.46–6.26)/100 PYs. Incidence rates of fracture in the osteopenia group, osteoporosis group, and no BMD test group were 8.32 (95% CI, 4.09–16.90)/100 PYs, 3.40 (95% CI, 1.30–8.90)/100 PYs, and 3.37 (95% CI, 1.53–7.39)/100 PYs, respectively (Table 3). The incidence rates of hip and vertebral fractures are shown in Supplementary Table 1.
Table 3
Incidence rates of osteoporotic fractures in patients with PMR
Of the twelve patients who experienced fractures, the majority were female (n = 11, 91.7%). The median (IQR) duration from enrollment to the first fracture event was 23.1 (6.0–103.6) months. Patients experiencing fracture had longer median (IQR) follow-up duration than those not experiencing fractures (81.4 [38.2–127.9] months vs. 39.2 [21.7–64.3] months, P = 0.047). Three of the five osteopenia patients who experienced fractures had received calcium/Vit.D supplements only. The other two osteopenia patients did not receive any calcium/Vit. D supplements or anti-osteoporotic medication. Two of the three osteoporosis patients who experienced fractures were on anti-osteoporotic medications, and the other was on calcium/Vit.D supplements only. No medications associated with fracture prevention were prescribed in the no BMD test patients who experienced fractures.
The most prevalent fracture sites were vertebrae (10 cases), followed by hip (4 cases) and rib, elbow, and wrist (1 case each). Regarding the clinical outcomes of osteoporotic fracture, 13 fracture cases (76.5%) required hospital admission, nine of which (52.9%) required surgery. The detailed characteristics of the patients who experienced osteoporotic fractures are presented in Supplementary Table 2.
Risk factors for osteoporotic fracture in patients with PMR
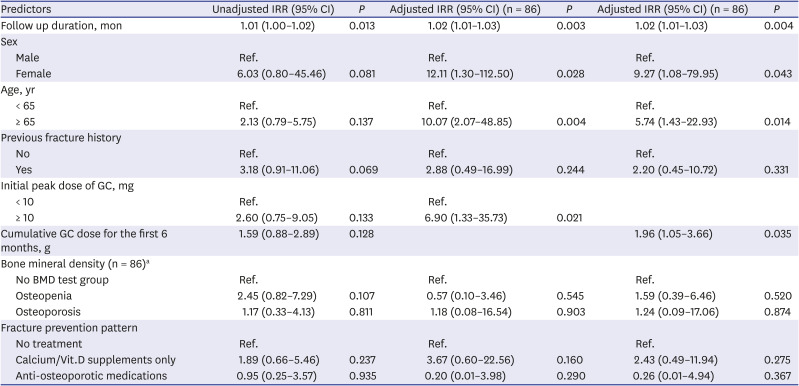
As shown in the crude analysis of Table 4, longer follow-up duration was associated with increased fracture risk (unadjusted IRR, 1.01; 95% CI, 1.00–1.02; P = 0.013). In a multivariable analysis including initial peak dose of GC, longer follow-up duration (adjusted IRR, 1.02; 95% CI, 1.01–1.03; P = 0.003), female sex (adjusted IRR, 12.11; 95% CI, 1.30–112.50; P = 0.028), age ≥ 65 years (adjusted IRR, 10.07; 95% CI, 2.07–48.85; P = 0.004), and initial dose of GC ≥ 10 mg (adjusted IRR, 6.90; 95% CI, 1.33–35.73; P = 0.021) were risk factors for fracture. Similar results were found in a multivariable analysis including cumulative GC dose over the first 6 months. Longer follow-up duration (adjusted IRR, 1.02; 95% CI, 1.01–1.03; P = 0.004), female sex (adjusted IRR, 9.27; 95% CI, 1.08–79.95; P = 0.043), age ≥ 65 years (adjusted IRR, 5.74; 95% CI, 1.43–22.93; P = 0.014), and higher cumulative dose of GC over the first 6 months (adjusted IRR, 1.96; 95% CI, 1.05–3.66; P = 0.035) were associated with increased overall osteoporotic fracture risk.
Table 4
Predictors of osteoporotic fracture in PMR patients
The predictors of hip and vertebral fractures (Supplementary Table 3) were the same as those for overall osteoporotic fractures.
DISCUSSION
In this retrospective cohort study, we calculated the incidence rate of osteoporotic fractures and identified risk factors for fracture in Korean patients with PMR. We also described patterns of prevention of fractures in these patients. Baseline BMD screening was conducted in a relatively small number of patients with PMR (55.8%), and the incidence of total fractures in patients with PMR was 3.93 (95% CI, 2.46–6.26) per 100 PYs. Anti-osteoporotic medications such as bisphosphonate and SERMs were prescribed only to patients with osteoporosis. However, fractures occurred most commonly in osteopenia patients. Longer follow-up duration, female sex, age ≥ 65 years, initial GC dose ≥ 10 mg, and higher cumulative GC dose over the first 6 months were associated with increased fracture risk in Korean PMR patients.
Since the presence of increased fracture risk is confirmed in inflammatory rheumatic diseases,14 osteoporosis and osteoporotic fractures are becoming increasingly important areas of study in the field of rheumatology. The mechanisms underlying increased fracture risk in rheumatic disease are multifactorial, including both the disease itself and treatment-related factors. Several lines of evidence indicate that inflammation plays an important role in bone resorption leading to osteoporosis. Pro-inflammatory cytokines such as tumor necrosis factor-α, interleukin (IL)-1, and IL-6 can act as osteoclastogenic cytokines.15 The detrimental effect on bone health of long-term use of GCs, which are widely used in inflammatory diseases, is well-documented.8 In addition, general risk factors for osteoporotic fracture including greater age, female sex, cigarette smoking, previous fracture history, and increased risk of falls are significant in patients with rheumatic disease.16
However, fracture risk in patients with PMR has received less attention than in those with other rheumatic diseases. The finding of increased fracture risk in patients with PMR is consistent across studies.1718 A study of 232 PMR patients using population-based data from the United States indicated that vertebral, femoral, and hip fractures were 2–5 times more frequent in PMR patients than in age- and sex- matched controls. Age at PMR diagnosis, cumulative dose of GCs ≥ 1,800 mg, and female sex were independent risk factors for fracture.17 In a retrospective Italian study of 222 PMR patients with a mean follow up time of 60 months, 31 (13.9%) patients developed osteoporotic fractures, and cumulative dose of GC was associated with occurrence of fracture.19 In a national multicenter cross-sectional and longitudinal observational study from Italy including 91 PMR patients, the incidence of osteoporotic fractures during GC treatment was 10%.20 More recently, a population-based retrospective study from the United Kingdom quantified the risk of fracture in PMR patients for the first time and found that the incidence rate of fracture was 148.05 (95% CI, 141.16–155.28) per 10,000 PYs, while the adjusted hazard ratio was 1.67 (95% CI, 1.49–1.88), compared to age-, sex-, and practice-matched controls. Also, patients in the highest quintile of GC average daily dose had a higher risk of fracture compared to the lowest quintile.18 Here, we report the incidence rate of osteoporotic fracture in Korean PMR patients to be 3.93 per 100 PYs. This appears to be higher than reported in the Italian population, and in the general Korean population aged over 50 years: 1,635 per 100,000 PYs from 2005 to 2008.21 In addition, it seems to be higher than the incidence rate of osteoporotic fractures reported in our previous study of Korean patients with rheumatoid arthritis (RA): 2,926.3 per 100,000 PYs.22 However, to obtain a more reliable comparison of the risk of osteoporotic fracture in patients with PMR and RA, a matched-cohort study is needed, since these groups may differ in disease characteristics, the most-affected age group, and the typical dosage of GC.
We also calculated incidence rates of fracture according to BMD results. Interestingly, the incidence rate of fracture was highest in the osteopenia group, not in the osteoporosis group. This unexpected result may be associated with the adjusting effects of anti-osteoporotic medications. Half of the osteopenia patients was prescribed only calcium/Vit.D supplements while all of osteoporotic patients were treated with calcium/Vit.D supplements and or anti-osteoporotic medications. Anti-osteoporotic medication was provided only to patients with osteoporosis, though the types of anti-osteoporotic medication were limited to bisphosphonates and SERMs, because anti-osteoporotic medication is covered by the Korean National Health Insurance Service (NHIS) only when the T-score is ≤ −2.5 SD, or an osteoporotic fracture is newly detected by radiography. During the study period, RANKL monoclonal antibody and parathyroid hormone were provided only to more restricted cases such as those with recurrent osteoporotic fractures. However, the insurance policies for anti-osteoporotic medications have recently been relaxed, and NHIS has covered some anti-osteoporotic medication for partial GC users with osteopenia since 2018. Therefore, we expect to see clinicians placing a greater focus on patients with osteopenia, who are at high risk of fracture but have previously not received appropriate management.
Interestingly also, the incidence rate of fracture in the no BMD test group was lower than those in the osteoporosis and osteopenia groups. This may be explained by indication bias: baseline BMD screening was conducted in patients who appeared to be at high risk of fracture, those with increased levels of ESR and CRP consequently receive increased doses of GC with the possibility of long-term use of GC. In addition, baseline BMD screening was conducted more actively in patients of advanced age, which is one of the main determinants of fracture risk and also a poor prognostic factor for fracture outcome.23 However, the pattern of practice observed in our cohort was different from those in previous studies. Claims-based studies have shown that the BMD screening rate is particularly low in the very elderly (> 80 or > 85 years), or declines with increasing age.2425 This paradox might be explained by several misconceptions including the idea that the osteoporosis is part of the normal process of aging or that it is too late to make an impact in elderly patients.26 This alteration of practice pattern in BMD screening associated with advancing age might also be due to the characteristics of our study population: cohort was established in a referral hospital for rheumatic disease and included only two very elderly patients (> 85 years).
Osteoporosis is a silent disease until a fracture occurs. Therefore, the ultimate goal of osteoporosis treatment is to prevent fractures and their consequences, such as morbidity, economic burden, and death.2728 The mainstay of traditional strategies of fracture prevention is to screen for osteoporosis by measuring BMD and then to treat selected individuals with anti-osteoporotic medications.29 In line with this, we observed that once baseline BMD screenings have been conducted, the efforts to prevent fracture were subsequently made according to BMD results. Patients with worse BMD results were likely to get more attention paid to prevent fractures. And interestingly, more patients who were confirmed to have normal BMD were treated with calcium/Vit.D supplements than those without baseline BMD. This may reflect that fracture risk assessment is the first step toward fracture prevention.
However, even with advances in osteoporosis detection and treatment options, low BMD screening rates are among several barriers to achieving effective fracture prevention. Low BMD screening rates have consistently been reported (12% to 56%), although their range is wide due to variable definitions of baseline BMD and the characteristics of the study populations.24303132 Our baseline BMD screening rate of 55.8% is in the upper range of the published values. In addition to its inflammatory characteristics, prevalent sex and age and use of GC may be additional important risk factors for fractures in patients with PMR. Therefore, BMD measurement should be performed in all patients with PMR. However, nearly half of patients did not undergo baseline BMD screening, and appeared to be at higher fracture risk than those with normal BMD. In addition, empirical treatment for osteoporosis was rarely initiated without BMD measurement. Collectively, we should accept that clinicians are missing at-fracture risk patients and should try to detect them for better fracture prevention.
We identified non-BMD clinical risk factors for fracture in PMR patients after adjusting for BMD results. Non-BMD clinical risk factors in the present study were consistent with those previously documented. Female sex and advanced age are widely known as major risk factors for osteoporotic fracture.2333 In addition, we confirmed the detrimental effect of GCs on increased fracture risk at a dose of ≥ 10 mg as well as higher cumulative GC dose. The cut off GC dose associated with adverse effects is highly variable among studies. However, increased fracture risk has been noted even in association with low doses of GCs, such as 2.5 mg/day.34 Consequently, current guidelines for GCs-induced osteoporosis have recommended calcium/Vit.D supplement therapy for patients taking GCs at a dose of ≥ 2.5 mg/day for ≥ 3 months.35
The first fracture occurred in the first year of treatment among relatively high proportion (41.7%) of fracture-experienced patients, while the range of duration for the first fracture events was broad (5.2–187.0) and longer follow-up duration is shown as one of the predictors for the osteoporotic fractures. One possible explanation is the rapid effect of GC on decreases in bone mass. The risk of fracture was found to increase rapidly after the first 3–6 months of GC treatment.36 The high frequency of fracture in the early period of PMR treatment was consistent with the results of a recent population-based study, in which the fracture risk was highest within the first year of diagnosis.18 A previous study found that the highest fracture risk in PMR patients occurred during the first six months of GC therapy, when the dose is highest.37 On the other hand, another study reported that osteoporotic fractures occurred more frequently in PMR patients treated for over 2 years compared to those treated for less than 2 years.19
The present study had several limitations. First, we conducted a retrospective single center study of a rare disease. Comprehensive data for other risk factors, such as smoking and low body mass index, were not available. Our study population was small, although we reviewed data collected over a period of 13 years. Therefore, the results need to be interpreted with some caution, especially for broad confidence intervals. In addition, the practice pattern described in our study may not represent current practice or be generalizable to all of Korea. The follow up duration was relatively short, so we cannot draw conclusions about long-term fracture risk following PMR. Considering that the length of follow up was longer in patients with fracture than those without fracture in our cohort and the longer follow up duration was associated with increased osteoporotic fracture risk, the long-term fracture risk in PMR patients might be even greater than we noted. And we only included fractures detected in radiographs. Not all fractures are detected, especially vertebral fractures. The risk of undetected vertebral fractures is higher in patients with rheumatic disease than in the general population,38 and it is possible that the fracture risk in PMR patients was underestimated. One recent study reported a frequency of vertebral fracture in patients with PMR of 30.2%.39 Finally, the fracture-risk assessment tool (FRAX) and trabecular bone score (TBS) were developed during our study period, and were not available or were unfamiliar to clinicians during the early part of the study. Therefore, we only used BMD. However, a discrepancy between the BMD and the incidence of osteoporotic fracture was noted,40 and recent guidelines for GC-induced osteoporosis suggest that clinicians consider assessing fracture risk within 6 months when initiating long-term GC treatment using FRAX.35 Furthermore TBS has been shown to be a useful parameter for predicting vertebral fractures in patients with PMR.39 Further studies focusing on FRAX or TBS are needed. Despite these limitations, the present study provides valuable real-world data for Korean PMR patients that has rarely been discussed. We evaluated the incidence rate of fracture and its contributors in this population. Our results have implications for strategies for fracture prevention and the policy of Korean health insurance system. Moreover, this study will serve as a base for further intervention studies. And we believe that greater awareness of fracture risk, fracture risk factors, and daily clinical practice can lead us to improved strategies for fracture prevention in PMR patients.
In conclusion, the incidence rate of fracture in Korean patients with PMR was 3.93/100 PYs. Longer follow-up duration, female sex, advanced age, and increased initial dose and cumulative dose of GCs were risk factors for osteoporotic fractures. Compared to fracture rate, baseline fracture risk has not been sufficiently assessed. With better knowledge and awareness of fracture risk and fracture risk factors, the paradigm of fracture prevention should shift to more comprehensive and personalized strategies in Korean patients with PMR.
 XML Download