

 PDF
PDF Citation
 Print
Print


INTRODUCTION
Sodium plays an important role in cellular homeostasis and physiological function, including cell membrane voltage, maintenance of osmotic pressure and fluid balance, and regulation of acid-base balance and nerve impulse delivery [1]. The addition of sodium to food reduces unpleasant flavors while it enhances texture and preserves foods by controlling bacterial action and fermentation [2]. Dietary sources of sodium differ across countries. In Asia, including Japan and China, soy sauce appears to be the main source of sodium, besides table salt and extra salt added during home cooking. Cereals, breads, and red meats are the main sources of dietary sodium in the U.K. and the U.S. [3].
The World Health Organization (WHO) predicts that mortality from cerebrovascular and stroke disease will continue to increase by 2030 [4]. In Korean, among the major causes of death, heart and cerebrovascular diseases related to hypertension rank as the second and the third, respectively [5]. In particular, the mortality rate from hypertensive disease is 11.3 per 100,000 population [5]. Moreover, the number of patients with cardiovascular diseases and related deaths will increase because the number of patients with high blood pressure is continuously increasing. According to the 2017 Korea Health Statistics, hypertension was prevalent in 32.3% of men and 21.3% of women [6].
Excessive sodium intake is known to cause hypertension, a major risk factor for cardiovascular diseases and stroke [7]. Excessive intake of sodium increases the blood volume and causes the secretion of hormones that regulate sodium excretion and adrenomedullary hormones involved in vasoconstriction [8]. In addition, high amounts of salt in the diet increase the risk of gastric cancer [9] and osteoporosis by increasing bone resorption and calcium excretion from bone [10]. Thus, the increased prevalence of hypertension and various other related diseases due to excessive sodium intake have emerged as major health issues to be managed for the health of public. As a result, most countries have committed to reducing sodium contents in processed foods. The Dietary Approaches to Stopping Hypertension (DASH) diet guideline recommends 1,500 mg/day of sodium as an upper limit for adults [11]. Meanwhile, the WHO and the Food and Agriculture Organization (FAO) recommend consuming ≤ 2,000 mg/day of sodium [12]. In Korea, the intake goal of sodium is a value set for avoiding health risks associated with the over-consumption of sodium rather than the recommended intake. In this context, the Dietary Reference Intakes for Koreans (KDRIs) targets a sodium intake of < 2,000 mg/day [13]. However, according to the 2017 Korea Health Statistics, Koreans consumed 3,477.2 mg/day of sodium, which is more than 1.5 times the target intake (2,000 mg/day) [6].
Identifying a reliable strategy to reduce sodium intake should rely on analyzing the sodium source based on the dish unit rather than food because sodium is added in large quantities as salt and soy sauce during cooking in Korea [14].
Although the sodium intake in Koreans has reported using the 1998–2010 Korea National Health and Nutrition Examination Survey (KNHANES) data [15], more recent data might show some differences. Therefore, the present study evaluated the trends in dietary sodium intake and the main sources of sodium in a representative Korean population using the Korea National Health and Nutrition Examination Survey (KNHANES) data from 2013 to 2017.
Go to : 
MATERIALS AND METHODS
Subjects
This study analyzed data from KNHANES V and KNHANES VI, covering the years of 2013–2017. KNHANES is a large-scale, nationwide, representative cross-sectional survey that provides information about the health and nutrition status of Korean. The survey consists of a health interview, a health examination, and a nutrition survey. KNHANES participants (aged ≥ 1 year) are selected using a stratified and multistate clustered probability sampling method. This study analyzed the data of 34,878 Korean participants (15,410 men and 19,468 women). This study was approved by the Institutional Review Board of Ewha Womans University (No. ewha-201907-0003-01).
Dietary intake assessment
The nutrition survey was performed by KNHANES to identify dietary behavior, and food and dietary intake [16]. The present study analyzed the 24-h dietary recall data to evaluate the daily food intake. This study analyzed sodium intake by subjects, food groups and dish groups which contribute to sodium intake.
Sodium intake by subjects' age
Age was classified into 8 groups: 1–9, 10–18, 19–29, 30–39, 40–49, 50–59, 60–69, ≥ 70 yrs, based on the 2017 Korea Health Statistics [6]. The average daily sodium intake was analyzed by gender and age.
Food groups contributing to sodium intake
In the KNHANES, a total of 18 food group were categorized with prepared and processed foods groups and other groups. Sixteen food groups were based on the food classification of the Rural Development Administration's food composition table. In this study, food codes based on these classification criteria were used [17]. The average sodium intake consumed according to the subjects' sex and age was calculated for each food group.
Main dish groups contributing to sodium intake
The dish groups contributing to sodium intake were classified using the second and third digits of the five digit food codes in the raw data, resulting in a total of 29 dish groups [15]: (1) rice, (2) bakery and confectioneries, (3) noodles and dumplings, (4) porridges and soups, (5) soups, (6) stews, (7) steamed food, (8) grilled dishes, (9) pancake (jeon), (10) stir-fried dishes, (11) glazed foods, (12) fried food, (13) seasoned vegetables, (14) raw vegetables, (15) kimchi, (16) salted seafood, (17) pickled vegetables, (18) paste and seasonings, (19) dairy products, (20) teas and other non-alcoholic beverages, (21) alcohol (22) fruits, (23) sugars, (24) grains and potatoes, (25) legumes and seed nuts, (26) vegetables and seaweed, (27) fish, and (28) fats and oils. For each of the top three-dish groups, the average sodium intakes were calculated according to the subjects' sex and age.
Data analysis and processing
The calculated data applied individual weights to reflect Korea's demographic structure in order to calculate national statistics. The intake ratio of each food group or dish group (sodium intake from each food group or dish group / total sodium intake per day × 100) contributing to the total intake of sodium was calculated. To identify the major dishes contributing to the sodium intake ratio, the top three dishes were selected in each dish group. At this time, foods considered to be similar in terms of the main ingredients or recipe were classified as being the same food (e.g., cabbage doenjang-guk, spinach doenjang-guk). SPSS 21.0 (IBM SPSS Statistics for Windows Version 21.0; IBM-SPSS, Inc, Chicago, IL, USA) was used for all statistical analyses. Descriptive statistical processing was analyzed by using PSU, KSTRATA, and nutrition weights was performed through complex sample analysis.
Go to :
RESULTS
Distribution of subjects by year
The subjects (n = 7,242, 6,801, 6,628, 7,040, and 7,167, respectively) are distributed by gender and age group for each year from 2013 to 2017 in Table 1. Women slightly outnumbered men, and the subjects' age distribution varied slightly across the 5 yrs, although the ratio was higher among the age group 40–49 or 50–59 yrs.
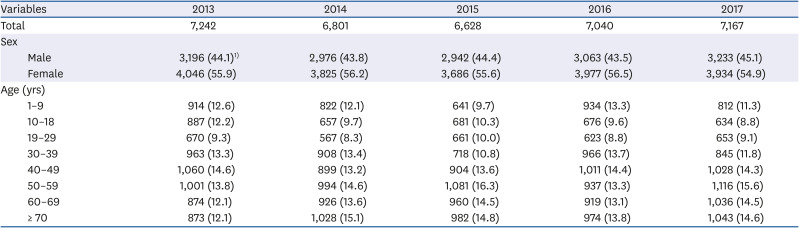
Table 1
Number of subjects by sex and age, KNHANES 2013–2017
All values are expressed as number of subjects (%).
KNHANES, Korea National Health and Nutrition Examination Survey.
1)Sampling weight was applied to all values.
![]()
Sodium intake of subjects by sex and age
As shown in Table 2, the average daily sodium intake per person in Korea between 2013 and 2017 has been about 3,500–3,900 mg, which is 1.5–2.0 times of the desired level (2,000 mg/day). Although the average daily intake of sodium in the subjects showed no change between 2013 and 2015 (3,862.1 ± 43.7 mg and 3,889.6 ± 62.1 mg, respectively), it decreased in 2016 (3,668.9 ± 48.6 mg) and further in 2017 (3,477.2 ± 39.4 mg). However, the sodium intake in men was 4,619.8 ± 102.3 mg in 2015, which was about 2.5 times higher than the desired target of 2000 mg/day. Despite decreasing to 4,355.9 ± 66.6 mg in 2016 and 4,063.4 ± 56.4 mg in 2017, it was still overconsumed by men at about two-fold of the targeted level. In women, it reduced slightly from 3,215.1 ± 45.4 mg in 2013 to 2,888.3 ± 40.8 mg in 2017.
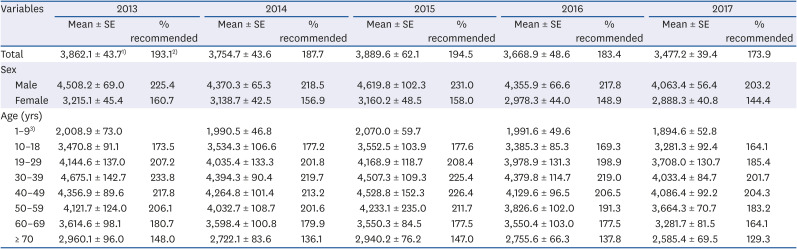
Table 2
Daily sodium intake of subjects by sex and age, KNHANES 2013–2017
All values (mg) are expressed as mean ± SE.
KNHANES, Korea National Health and Nutrition Examination Survey.
1)Sampling weight was applied to all values. 2)Percent daily intake goal of sodium. 3)Not presented as no daily intake goal of sodium for under 1–9 years old.
![]()
In the context of the subjects' age group, the individuals aged 30–39 or 40–49 years had the highest sodium intakes consuming over 4,000 mg/day of sodium or, in other words, twice the preferred intake for the entire 5 yrs. Although the sodium intake was lower in 2017 than in 2013 in all age groups, the average sodium intake exceeded the desired level in all subjects except those aged 1–9 yrs.
Major food groups contributing to sodium intake during 2013–2017
When the major food groups contributing to sodium intake from 2013 to 2017 were considered (Tables 3 and 4), the rankings were seen to remain unchanged, for example, seasonings followed by vegetables, cereal grains, fish and shellfish, and meat. In both men and women, the intake rate of seasonings decreased from 48.4% in 2013 to 45.9% in 2017, and remained the same for vegetables (19.6%) (Table 3). The intake rate of cereal grains increased from 15.0% in 2013 to 17.0% in 2017. The subtotals of the top three food groups were not changed much over 5 yrs.
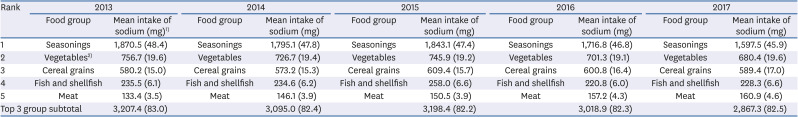
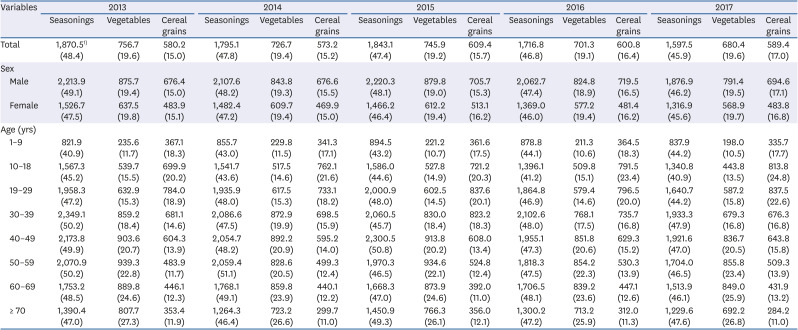
Table 3
Major food groups contributing to sodium intake, KNHANES 2013–2017
All values are expressed as mean intake of sodium (mean % of total sodium intake).
KNHANES, Korea National Health and Nutrition Examination Survey.
1)Sampling weight was applied to all values. 2)Fermented vegetables such as Kimchi were included in vegetables group.
![]()
Table 4
Top 3 food groups contributing to sodium intake by sex and age, KNHANES 2013–2017
All values are expressed as mean intake of sodium (mean % of total sodium intake).
KNHANES, Korea National Health and Nutrition Examination Survey.
1)Sampling weight was applied to all values.
![]()
For all eight age groups, across all 5 years, the sodium contribution rate of cereal grains was the highest in the group aged 10–18 yrs (Table 4). The sodium intake from cereal grains increased from 20.2% in 2013 to 24.8% in 2017 in the subjects aged 10–18 yrs.
Dish groups contributing to sodium intake
The dish groups that contributed to sodium intake by year are presented in Table 5. The top three dish groups were noodles and dumplings (14.6–6.0%), kimchi (13.2–14.0%), and soups (10.2–11.1%). The sodium intake from noodles and dumplings decreased from 573.2 mg in 2013 to 536.7 mg in 2017, but the intake ratio increased from 14.8% to 15.4%. Although the sodium intake from kimchi decreased from 539.6 mg in 2013 to 487.3 mg in 2017, the intake rate remained the same (14.0%). The sodium intake from soups decreased from 428.9 mg in 2013 to 367.6 mg in 2017, and the intake rate decreased slightly from 11.1% to 10.6%. The rankings of the top three dish groups remained unchanged across the 5 yrs, whereas the rankings of the other dish groups showed some differences. The ratio of the subtotal of sodium intake from the top three dish groups remained consistently at around 40% for all 5 yrs from 2013 to 2017.
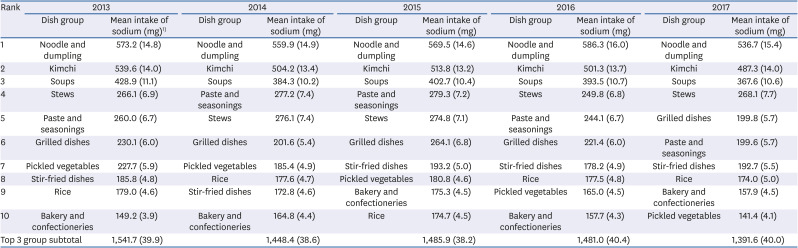
Table 5
Major dish groups contributing to sodium intake, KNHANES 2013–2017
All values are expressed as mean intake of sodium (mean % of total sodium intake).
KNHANES, Korea National Health and Nutrition Examination Survey.
1)Sampling weight was applied to all values.
![]()
The top three dish groups that contributed to sodium intake according to gender and age across all 5 yrs (2013–2017) are displayed in Table 6. In men, the sodium intake from noodles and dumplings decreased from 696.8 mg in 2013 to 616.1 mg in 2015, increased to 719.8 mg in 2016, then decreased to 655.6 mg in 2017. In women, the sodium intake from noodles and dumplings peaked at 471.2 mg in 2015 and decreased to 417.3 mg in 2017. Although slight differences occurred between the annual contributions sodium intake from kimchi, no obvious trend existed. The sodium intake from kimchi consumption decreased consistently between 2013 and 2017 in men (from 618.7 mg to 573.2 mg) and women (from 460.4 mg to 400.9 mg).
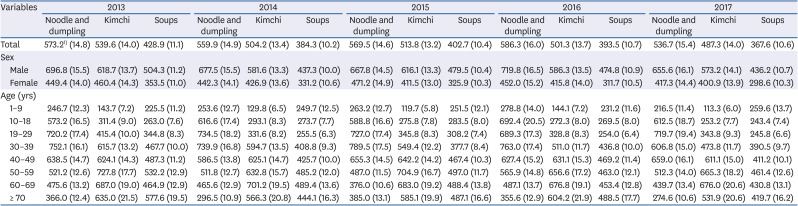
Table 6
Top 3 dish groups contributing to sodium intake by sex and age, KNHANES 2013–2017
All values are expressed as mean intake of sodium (mean % of total sodium intake).
KNHANES, Korea National Health and Nutrition Examination Survey.
1)Sampling weight was applied to all values.
![]()
Throughout 2013 to 2017, the sodium intake from noodles and dumplings was highest in the individual aged 19–29 and 30–39 yrs. It showed an increasing trend over the 5 yrs in the subjects aged 10–18 yrs (from 573.2 mg to 612.5 mg) and those aged 40–49 yrs (638.5 mg to 659.0 mg). Except for those two age groups, the sodium intake from noodles and dumplings was lower in 2017 than in 2013. Nonetheless, the contribution rate of noodles and dumplings to sodium intake increased most in the age group 10–18 yrs (from 16.5% to 18.7%), followed by the subjects aged 19–29 yrs (from 17.4% to 19.4%).
The subjects with the highest sodium intake from kimchi were aged 50–59 and 60–69 yrs. Kimchi contributed less to the sodium intake in 2017 (15.0%) than in 2013 (14.3%) in all age groups, except for the group with aged 40–49 yrs. The greatest declines were seen in the subjects 10–18 (from 9.0% to 7.7%) and 30–39 yrs (13.2% to 11.7%). Although the mean sodium intake from kimchi decreased, the contribution rates in the subjects aged 40–49, 50–59, and 60–69 yrs were higher in 2017 than in 2013. Kimchi and soups showed the highest contribution rates in the subjects aged ≥ 70 yrs. Another notable finding was the increased sodium intake from soups in 2017 (13.7%) than in 2013 (11.2%) in the subjects aged 1–9 yrs. As a result, noodles and dumplings was the most contributing dish of sodium intake in aged 10–39 yrs and kimchi was in aged over 50 yrs.
Major sources of the top three dish groups contributing to sodium intake
The three main food sources of sodium (ramyeon, baechukimchi, and doenjang-guk) in the top three dish groups (noodles and dumplings, kimchi, soups) remained constant each year (Table 7). Among each dish's ingredients, ramyeon and guksu had the highest sodium levels in noodles and dumplings and contributed the most to the daily sodium intake. Throughout the 5 yrs, the intake rate of ramyeon was about 5.2% (5.1% in 2013, 4.9% in 2016, to 5.5% in 2017). And the intake of Guksu was slightly different (2.5% in 2013, 3.2% in 2016, 3.0% in 2017). In the kimchi group, baechukimchi, followed by kkakduki, and yeolmukimchi, remained the top three sources of sodium intake each year. In particular, baechukimchi accounted for over 7% of the sodium intake [284.7 mg (7.4%) in 2013 to 298.7 mg (8.6%) in 2017] from the total sodium intake. Doenjang-guk and miyeok-guk accounted for the majority of the sodium intake from soups. The sodium intake from doenjang-guk decreased from 140.8 mg (3.6%) in 2013 to 93.0 mg (2.7%) in 2017.
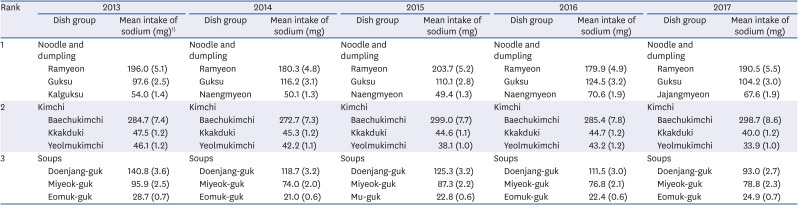
Table 7
Major sources of the top 3 dish groups contributing to sodium intake, KNHANES 2013–2017
All values are expressed as mean intake of sodium (mean % of total sodium intake).
KNHANES, Korea National Health and Nutrition Examination Survey.
1)Sampling weight was applied to all values.
![]()
The top three foods that contributed to the annual sodium intake according to sex and age are shown in Table 8. Despite the slightly lower sodium intake from ramyeon in 2017 than in 2013, the contribution rate of sodium intake from ramyeon increased in both men and women and all age groups, except for those aged under 9 yrs and 30–39 yrs. The greatest increase occurred in the subjects aged 19–29 yrs (from 8.6% to 10.5%). In 2013 and 2017, sodium intake from baechukimchi was the highest in the age group 50–59 yrs and 40–49 yrs, whereas the sodium intake from doenjang-guk was the highest in the subjects aged ≥ 70 yrs and 60–69 yrs. There was a higher contribution rate of sodium intake from baechukimchi in most age groups in 2017 compared with 2013, but the greatest increase occurred in the individuals aged 40–49 yrs (8.7% to 11.2%). By contrast, the contribution rate of sodium intake from doenjang-guk decreased markedly in most groups, except in the subjects aged 1–9 and 60–69 yrs. Notably, in those aged ≥ 70 yrs, the contribution ratio of doenjang-guk was markedly lower in 2017 (4.1%) than in 2013 (6.3%). As a result, ramyeon was the most contributing dish in sodium intake in aged 10–29 yrs and baechukimchi was in aged 30–69 years, and doenjang-guk was in aged over 60 yrs.
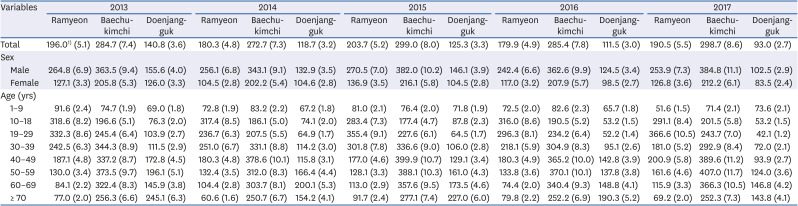
Table 8
Top 3 sources of the dish groups contributing to sodium intake by age and sex, KNHANES 2013–2017
All values are expressed as mean intake of sodium (mean % of total sodium intake).
KNHANES, Korea National Health and Nutrition Examination Survey.
1)Sampling weight was applied to all values.
![]()
Go to :
DISCUSSION
As a result of examining the sodium intake status in Koreans from 2013 to 2017, the sample population was shown to consume about twice of intake goal. The food and dish sources of sodium were various, but the top ranked food and dish sources were consistent across all age groups. Mainly, ramyeon, baechukimchi, and doenjang-guk showed a high sodium intake contribution throughout the 5 yrs.
The average daily intake of sodium in Koreans during 2013–2017 peaked in 2015, and had since decreased. It was lower during these 5 yrs than between 1998 and 2010, in which the average daily sodium intake was 4,572.6–5,498.9 mg/day [15]. However, the average daily sodium intake was about 3,500 mg in 2017, which was still 1.5 times higher than the sodium intake goal (2,000 mg/day), according to the KDRIs [13]. According to the U.S. NHANES (2009–2012), the sodium intake was higher at the age of 19–50 yrs than > 51 yrs [18]. Sodium intake was reported to decrease during 1995–2016, but remain high in Japan [19]. Thus, reducing sodium intake remains a major nutrition goal in most countries.
In particular, men (4,063–4,619 mg/day) consumed more sodium than women (2,883–3,215 mg/day) during the 5-yrs period, which was consistent with the previous study [20]. Men did typically check the sodium content in nutrition labels, which may be one reason for the higher sodium intake in men than women. When analyzed by the subjects' age, all age groups, except for the 1–9 yrs, consumed high levels of sodium (1.3–2.3 times higher than the intake goal). However, the highest levels were consumed by the subjects aged 30–39 and 40–49 yrs during the 5 yrs. This result might be related to the recent increase in meals consumed outside of the home [21], a dietary practice proposed previously to explain the excessive sodium intake in Korean middle-aged office workers [22]. In particular, the sodium intake tended to increase dramatically in men in their 30s [6]. It suggests that nutrition education is necessary for middle-aged men to reduce sodium intake during eating out. Although the daily mean intake of sodium in Koreans decreased slightly in 2013–2017 compared with the 1998–2010 KNHANES data, continued attention to these two age groups (20–39 and 40–59 yrs) might be needed because of the relatively higher sodium intake that remains in these groups.
In the present study, we ranked the food groups that contributed to the sodium intake in Koreans as seasonings, vegetables, cereal grains, and fish and shellfish, which was consistent with the previous study of the 1998–2010 KNHANES data [15]. Although the ranking of the existing food groups contributing to sodium intake in Koreans did not change throughout the 5 yrs between 2013 and 2017, the sodium intake from meats was higher in 2017 than in 2013. In addition, the absolute sodium intake was reduced, whereas the intake rate of the top three food groups remained constant. The consumption of sodium from seasonings is still high, thus eating and cooking food while reducing dietary sodium intake by using low-sodium salt seasoning remains a priority [23].
Kimchi and ramyeon are major foods consumed in Korea. As shown in this study, the corresponding food groups (vegetables and cereal grains, respectively) were the largest contributors to the sodium intake. Particularly, the contribution rate and sodium intake from cereal grain products increased in 2017 compared with 2013 in the subjects aged 10–18 yrs. Children and adolescents prefer and frequently eat ramyeon [24]. Combined with the knowledge of the increasing consumption of processed foods worldwide, and that processed foods contain a large amount of salt for storage stability and flavor acceptability [25], this might explain the increased sodium intake from ramyeon in individuals aged 10–18 yrs. Therefore, it is also necessary to establish a method and database to identify the sodium intake from processed foods preferred by teenagers [26].
Dish groups contributing to sodium intake during 2013–2017 were noodles and dumplings, kimchi, and soups. The top three dish groups were consistent with previous studies [1427]. These results suggested that the food sources of sodium in Koreans have not changed much in recent years. Compared with the 1998–2020 KNHANES data [15], the results showed a decreased sodium intake from kimchi and increased sodium intake from noodles and dumplings. Kimchi is a very important food in controlling the sodium intake of Koreans, because it is one of Korea's representative foods of daily meals. Moreover, the increased sodium intake and contribution ratio from kimchi in middle-aged Koreans occurs because of the decreased variety of food intake in the elderly in Korea [28]. Although kimchi's contribution to sodium intake has been recognized, the absolute sodium intake from kimchi is still high. The main source contributing to the sodium intake from kimchi was baechukimchi, which contributed 7.4% in 2013 and increased to 8.6% in 2017. Many kinds of food include kimchi. In this context, a previous study suggested using an alternative salt in kimchi to decrease the sodium intake in Koreans [29].
In addition, the sodium intake from doenjang-guk was high in individuals aged 60–69 and ≥ 70 yrs compared with the other age groups. In the elderly, a high intake of soups is related to weakened digestion and chewing function, which leads to a less diverse diet compared with other age groups [30]. It suggests that age group differentiated approaches are considered when preparing a plan to reduce the sodium intake in the Korean population. Another key factor contributing to the total sodium intake in Koreans is the high intake of broth from noodles and soups. In this regard, it is necessary to reduce the intake of sodium by reducing the size of soup or stew bowls [31] or providing education on reducing the amount of sodium in cooking. It should also be noted that the consumption of home meal replacement (HMR) products of soups and stews has increased remarkably in Korea recently [32]. Although the label of HMR products lists the nutritional components, there is still no database for the sodium contents in these products [32]. Therefore, a multi-faceted approach to reducing sodium intake is needed.
As a result of identifying the major sources contributing to the sodium intake in the top three dish groups, the contribution rate of ramyeon (4.8–5.5%) was not only the highest, but the ratio of sodium intake from ramyeon appeared to increase from 2013 to 2017. Ramyeon also stood out in previous examination of the food groups contributing to sodium intake using the KNHANES data from 1998 to 2010 [15]. The sodium intake and contribution ratio from noodles and dumplings in the subjects aged 10–18 yrs was higher in 2017 than in 2013 and highlighted the high preference for ramyeon consumption among adolescents [33]. Moreover, the contribution of sodium due to ramyeon was increased in the middle-aged population, suggesting that ramyeon was highly preferred in most age groups. Therefore, a low-sodium seasoning or reduced amount of seasoning should be considered during the cooking of ramyeon to lower the sodium intake from this product [34].
There are numerous efforts to reduce sodium intake worldwide, including regulating the salt content in processed foods and fast foods in the U.S. Singapore has focused on education promoting fruits and vegetable intakes. Canada has obligated to marking the sodium content on food labels. In Finland, it is recommended to use an alternative salt called “Pansalt®,” one of the three most sold Finnish foods in 20 countries. Finland succeeded in reducing sodium intake by establishing a high sodium food labeling system and providing continuous education on sodium intake. Korea proposed a different low-salt strategy to reduce the sodium amount while maintaining the flavor and taste of fermented foods. It relies on using salt-enhancing substitutes instead of unconditionally reducing the amount [35].
The WHO suggested improving blood pressure by increasing the intake through the consumption of fresh fruits and vegetables. In general, although a high intake of vegetables can increase the potassium intake, kimchi both occupies a dominant position in the vegetables intake in Koreans and has a relatively high sodium/potassium (Na/K) ratio [36]. Therefore, it is important to increase the potassium intake by consuming low-salt kimchi, potassium-rich beans, nuts, and various fruits. Finally, it is necessary to provide nutrition education for the public about food selection and cooking methods to reduce the Na/K ratio [36].
The present study has some limitations. The food intake survey of the KNHANES was a one-day 24-h recall method. This method can have recall bias because it depends on the short-term memory of the respondents, so achieving high accuracy of the sodium intake analysis is difficult [37]. However, this study analyzed sodium's average intake in a large population, thus avoiding distorting the study results by the survey method. It would be valuable to have the 24-h collected urinary sodium data to improve the sodium intake analysis accuracy in future work.
In conclusion, the sodium intake in Koreans has decreased in recent years, but remains higher than the intake goal. Reducing the intake of kimchi and broth is an effective way to decrease sodium intake. In addition, efforts to reduce sodium intake through practical ways, including the guidance of a low-salt kimchi intake and reduction of the size of soup bowls, are necessary. A stratified analysis and strategy based on gender and age may be needed to develop foods with less sodium content for each targeted group and to establish strategies to consume less sodium. Future study is also required to develop a database of sodium intake from processed food and HMR food. To date, the same education on low sodium intake has been performed for all public. However, it is necessary to apply personalized nutrition education and policies depending on the subject's age, considering the different major food and dish sources of sodium across the age groups. The results from the present study can be applied to nutritional intervention programs and nutritional policies.
Go to :
 XML Download