

 PDF
PDF Citation
 Print
Print


INTRODUCTION
Rapid physical and emotional growth during adolescence makes it the second-fastest developmental growth period. Therefore, a balanced diet is very important. Obstacles preventing consumption of a balanced diet are high-calorie·low-nutrition (HCLN) snacking between meals [1], lack of sleep [2], excessive intake of nutrients and calories from frequently eating-out [3], and sugar-based meals from convenience stores [456].
Due to the accelerated growth during adolescence, insufficient nutritional intake at meals must be made up by snacks. However, with the rapid growth in the food industry and changes in consumers' lifestyles, choosing the right foods is too difficult for adolescents, especially those exposed to an unhealthy food environment, such as aggressive advertising from the food industry. Moreover, due to increases in schoolwork and dual-income parents, the frequency of snack purchases from school stores or convenience stores has increased to replace meals eaten at home. This habit results in the decreased nutritional intake of carbohydrates and lipids, which lead to nutritional imbalances. In addition, intake biased toward simple sugars and lipids is associated with obesity and various chronic diseases in adolescents [78].
In a study that investigated the eating habits of adolescents, 33.7% of the respondents said they purchased snacks more than once a day and only 1.3% of the respondents said that they did not eat snacks. Taste was reported to be the most important snack selection criterion by 77.7% of the respondents and 50.3% of the respondents reported that they do not check the nutrition label when choosing a snack. The snacks frequently chosen by adolescents were fruits, cookies, bread, chocolate, ice cream, and carbonated beverages. These foods are low in protein and high in sugar, as well as lipids, designating them as HCLN foods [9]. Eating many of these HCLN foods may cause obesity, diabetes, tooth disease, attention deficit-hyperactivity disorder, and nutritional imbalances [1011]. Therefore, nutrition-based educational activities encouraging smart and healthy snack choices for adolescents are needed.
Not only are beverage sales higher in convenience stores but the increase in vending machines also play a big role in HCLN food consumption in adolescents [12]. The market share of the beverage industry in the domestic food manufacturing industry increased from 11.6% in 2010 to 12.5% in 2015. Beverage consumption per capita was ranked in the order of carbonated beverages, fruit and vegetable beverages, and coffee beverages [13]. Moreover, a strong correlation between carbonated beverage consumption and bone fracture rate has been reported and the consumption of beverages high in sugar and caffeine is inappropriate for growing adolescents. Carbonated beverages have a sugar content of 19.9 g per 200 mL, more sugar than in other snacks. The World Health Organization (WHO) recommends sugar intake at 10% of the total calories to prevent chronic diseases [14]. In a study investigating the nutrient adequacy ratio (NAR), mean adequacy ratio (MAR), and index of nutritional quality (INQ) of groups that did or did not consume carbonated beverages, the carbonated beverage consumption group showed lower quality nutritional intake [15]. When calorie consumption was compared according to the intake of carbonated beverages by adolescents, the carbonated beverage consumption group consumed higher calories (2,071.6 kcal) than the no-carbonated beverage group (1,880.97 kcal) [16].
The sleeping time of adolescents can also affect nutrient intake [16]. The U.S. National Sleep Foundation (NSF) suggests 7–8 h as the appropriate sleep duration for adolescent, 8–10 h as the recommended and less than 7 h as the not recommended sleep time duration [17]. However, most adolescents in Korea reported sleeping less than 7 h [18] and their body mass index (BMI) significantly decreased as sleeping time increased [19]. Sleep-deprived adolescents are likely to make less healthy food choices and consume fewer vegetables and fruits [20]. In a study conducted with students in the Gwangju area, the sleep-well group showed a higher frequency of fruit juice, apple, strawberry, and banana consumption, whereas the sleep-deprived group more frequently consumed ramen, tteokbokki, kimbab, chicken, bread, cookies, or candy. In addition, snacks in the sleep-deprived group were higher in calories than those in the sleep-well group [2]. Adolescents who suffer from sleep deprivation due to earlier rising, as well as late bedtime due to mobile phone or computer use, tended to consume more beverages high in sugar or caffeine and consume them more frequently [18]. Moreover, their lifestyle tended to be imbalanced, shown by such activities as oversleeping on weekends to compensate for sleep deprivation. If sleep deprivation continues, not only decreased concentration but problems with concentration memory, declaration memory, and procedure memory can result and adversely affect academic achievement [13]. The above studies found that sufficient sleep duration and healthy snack consumption had strong effects on cultivating a healthy dietary lifestyle in adolescents.
Eating location also affected the quality of adolescent diets quality [1621]. School meals help adolescent to foster healthy dietary life by supplying 30–35% of the daily energy intake and providing a healthy eating environment. Meanwhile convenience store meals could be attributed to unhealthy dietary quality of adolescents, suggesting that convenience store meals are rich in lipids and sugar [22]. In addition, the behavior of healthy eating partners helps adolescents who eat together to choose healthy foods and foster intentions to consume healthy foods [23]. Considering these points, eating location is important for adolescent to select healthy foods and to form consumption behaviors.
In Korea, a very limited study was done to compare the nutritional intake of adolescents according to snack type, sleep hours, and eating place. Therefore, the purpose of this study was to evaluate the nutritional intake levels of adolescents according to snack type, sleeping hours, and eating place and to evaluate the adequacy of the intake and quality of the diet by measuring the NAR, MAR, and INQ.
Go to : 
SUBJECTS AND METHODS
Subjects and period
Students of 2 middle schools located in Seoul and Gyeonggi-do participated in the study. A total of 320 adolescents participated in a survey from March 19 to May 11, 2018. Questionnaires were collected from 256 students and 19 questionnaires poorly written were excluded from the study, thus 237 (response rate of 74.1%) were finally used for the data analysis. This research was conducted with approval by the Research Bioethics Committee of Dankook University (IRB number 2018-03-003).
Questionnaire contents
The questionnaire was developed by referring to previous studies on snack intake patterns [24], the relationship between nutritional intake and sweetened food intake [15], the eating and snacking habits of adolescents [9], and the 2017 National Health and Nutrition Survey Examination in Korea [25]. The survey consisted of 2 sections with 8 items. Five items asked general information on the respondents and 2 items concerned food intake [3]. The first section of the general information consisted of 5 questions on gender, grade, weight and height, and sleeping hours of the respondents. Gender (woman and man) and grade (1st, 2nd and 3rd) were categorized variables. Weight, height and sleeping hours were asked with open-ended questions. BMI was calculated with weight and height, and categorized based on BMI-for-age percentile: underweight (less than the 5 percentile), normal (the 5th percentile to less than the 85 percentile), overweight (the 85th percentile to less than the 95 percentile) and obesity (equal to or greater than the 95 percentile). Sleeping hours was categorized on the guideline of the U.S. NSF [17].
The second section of the food intake report sheet includes 3 variables of eating place, meal classification, and food consumption, based on the 2017 National Health and Nutrition Survey Examination [25]. Eating place was a categorical variable consisted of home, snack shop, bakery, school, fast food, delivery food, street cart, restaurant, convenience store, and etc. Meal classification was also a categorical variable consisted of breakfast, lunch, dinner and snack. All foods including beverage and snacks consumed from the respondents were asked to report as their food intake for 1 day, the day before the surveyed date, using the 24-h recall method. The ingredients and quantity of the food were queried and the processed foods or beverages were consumed, the name of the manufacturer was asked to report. The questionnaire was completed by a self-evaluation from the respondent with the help of a trained interviewer. Among food intake information, snacks or beverage consumption data were extracted to determine whether the food or beverage is a healthy or a HCLN snack. For this, the online tool suggested by the Ministry of Food and Drug Safety [26] was used.
Evaluation of nutritional intake and dietary quality
To evaluate the nutritional intake and its adequacy, nutrient intake was calculated with CAN Pro 5.0 (The Korean Nutrition Society, Seoul, Korea). The adequacy of nutrient intake was evaluated by calculating the NAR, MAR, and INQ.
NAR
Based on the intakes recommended for Korean [27], the intake adequacy ratios for 9 nutrients (protein, vitamin A, vitamin B1, vitamin B2, niacin, vitamin C, iron, folic acid, and calcium) were calculated by the following formula.
An NAR over 1 is considered to meet the recommended intake and was recorded as 1 in this study. For NARs less than 1, the exact value was displayed to indicate the gap from the recommended intake.
MAR
The MAR, which was the overall intake of nutrients by the adolescents, was estimated by calculating the mean of the 9 NAR values as follows.
INQ
The INQ is an indicator of nutrient density used to assess the quality of meals or foods. Based on the dietary reference intakes for Korean [27], the nutrients (protein, vitamin A, vitamin B, vitamin B2, niacin, vitamin C, iron, folic acid, and calcium) with recommended intakes were calculated using the formula below. A meal with an INQ of 1 or more contains a higher density of nutrients and indicates a good quality meal.

Statistical analysis
The data were analyzed using the Statistical Package for Social Science (SPSS) version 23.0 (IBM Corp., Chicago, IL., USA). Frequency, percentage, and descriptive statistics (mean, standard deviation) were used to analyze the general information of the subjects. Independent t-tests were used to analyze the nutritional status, NAR, MAR, and INQ between the 2 groups. Analysis of variance was used to analyze the nutrient intakes according to the meal eating places. Significance between the mean value of the groups was analyzed by least significance difference at P < 0.05.
Go to :
RESULTS
Demographic profiles of the respondents
The general information of the respondents is shown in Table 1. The 237 total respondents were compromised of 112 boys (47.3%) and 125 girls (52.7%), consisting of 55.7% first grade, 25.3% second grade, and 19.0% third grade students. The height of the respondents was significantly different by grade and gender (P < 0.05). The BMI of the respondents were: 70.4% normal, 10.7% underweight, 9.0% overweight, and 9.9% obese. Approximately 38.4% of the respondents reported that they slept 7–8 h or less, followed by more than 8 h (25.9%), and less than 7 h (25.7%). The average sleep time for boys (7.7 h) was longer than that of girls (7.1 h) (P < 0.05).
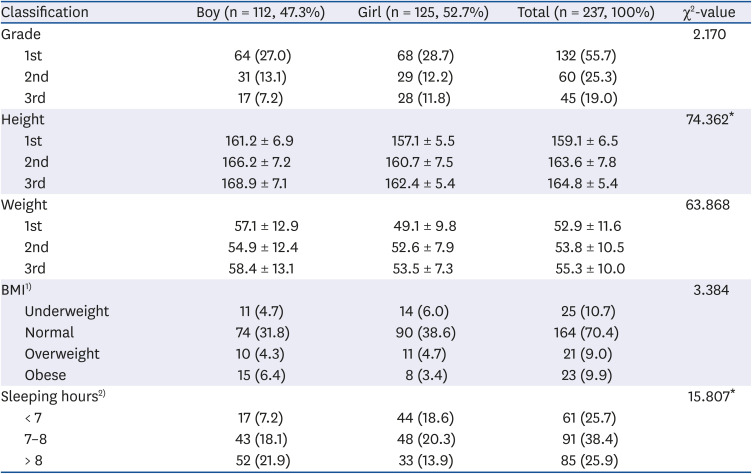
Table 1
Profile of the respondents
Values are presented as number (%) or mean ± SD.
BMI, body mass index.
1)BMI = weight/height2; underweight: BMI < 5th percentile; normal: 5th percentile ≤ BMI < 85th percentile; overweight: 85th percentile ≤ BMI < 95th percentile; obese: 95th percentile ≤ BMI. 2)Average of sleeping hours by group: (1) the group less than 7 h: 5.8 h for boy and 5.9 h for girl; (2) the group 7 h to less than 8 h: 7.3 h for boy and 7.3 h for girl; (3) the group more than 8 h: 8.6 h for boy and 8.4 h for girl.
*P < 0.05.
![]()
Comparison of the nutrient analysis between healthy snacks and HCLN snacks
The snacks consumed by students were divided into healthy snacks and HCLN snacks (Table 2). Healthy snacks consumed by the adolescents included dairy products, fruit juices, walnut cookies, ionized drinks, fruits, sandwiches, honey, sweet potatoes, salads, dumplings, and kimchi-jeons. The HCLN snacks included carbonated fruit drinks and vegetable juices with sugar, ice cream, chips, hamburgers, cakes and cookies, bread, ramen, jelly/chocolate/candy, iced tea, pizza, fries, canned coffee, hot dogs and sausage, and cheese sticks. Among the total respondents (n = 230), 109 students consumed snacks. In total, 21 (19.3%) students reported eating healthy snacks (healthy snack group) and 88 (80.7%) ate HCLN snacks (HCLN snack group). The total frequency of healthy snacks was 52 (25.9%) and that for HCLN snacks was 149 (74.1%). The energy intake of adolescents from the healthy snacks was 370.4 kcal, whereas it was 641.7 kcal from HCLN snacks. The HCLN snack group consumed higher energy (641.7 kcal), carbohydrates (92.1 g), fats (22.8 g), and protein (17.1 g) compared to the healthy snack group but the healthy snack group consumed higher vitamin A (147.5 μg retinol activity equivalents [RAE]), vitamin C (17.4 mg), iron (3.3 mg), and calcium (171.3 mg). However, there were no statistically significant differences between the 2 groups.
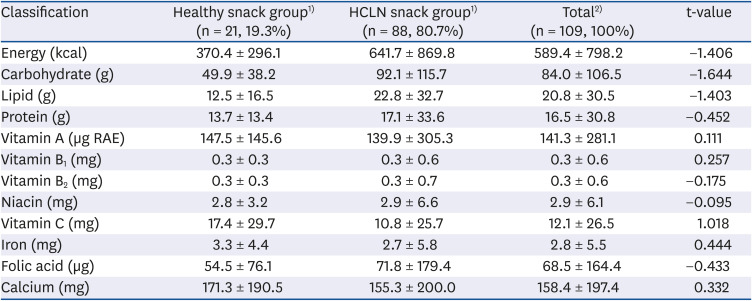
Table 2
Nutrient intake from snacks by the healthy snack and the HCLN snack group
Values are presented as mean ± SD.
HCLN, high-calorie·low-nutrition; RAE, retinol activity equivalents.
1)Data collected with a 24-h recall method from those who consumed healthy snack or HCLN snack. A total of 52 food items for healthy snacks and 149 food items for HCLN snacks were analyzed for nutrient intake. 2)Healthy snack group represents adolescent consumed healthy snacks such as dairy products, fruit juices, fruits, sandwiches, salads, etc. While HCLN snack group means adolescent consumed ice cream, chips, cookies, ramen, jelly/chocolate/candy, iced tea, canned coffee etc. Frequency and percent were presented for the groups.
![]()
Nutrient intake from meals
The nutrient intake of boys and girls is shown in Table 3. Except for 7 students whose daily caloric intakes were below 500 kcal or above 4,000 kcal, the nutrient intake from 1 day's meals was analyzed. The nutrient intake of boys was 1,914.8 kcal for energy, carbohydrate 246.2 g, fat 66.8 g, and protein 78.6 g, whereas for girls, the energy intake was 1,752.7 kcal, carbohydrate 232.8 g, fat 60.0 g, and protein 67.5 g per day. The ratio of carbohydrate:fat:protein in the average daily energy intake (1,829.5 kcal) was 52.3%:31.5%:15.9%. In terms of nutrient intake by gender, only protein and niacin intake were significantly higher in boys than in girls (P < 0.05).
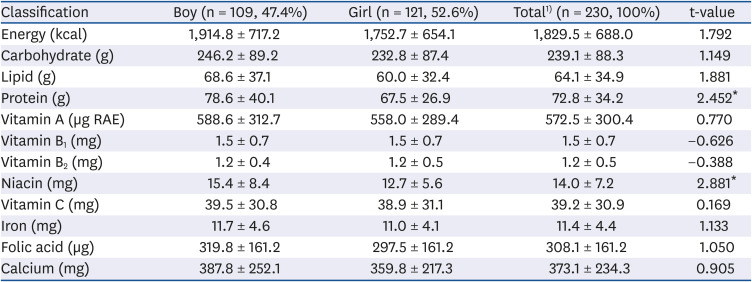
Table 3
Nutrient intake status of the respondents
Values are presented as mean ± SD.
RAE, retinol activity equivalents.
1)Excluded 7 samples (4 samples uncompleted the 24-h recall survey, and 3 samples whose energy intake are either less than 500 kcal, or more than 4,000 kcal).
*P < 0.05.
![]()
Nutrients intake status by snack type, sleep hours, and eating place
The nutrient intake of adolescents by snack type, sleeping hours, and meal place is presented in Table 4. The energy intake for the healthy snack group was 1,951.9 kcal (21 students, 19.3%) and 2,118.2 kcal (88 students, 80.7%) in the HCLN snack group. The healthy snack group consumed more vitamin A (644.3 μg RAE), vitamin B1 (1.7 mg), iron (12.4 mg), folic acid (342.1 μg), and calcium (467.8 mg) than the HCLN snack group, but the intakes were not significantly different (P > 0.05).
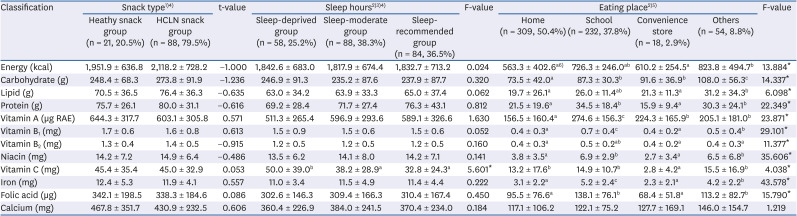
Table 4
Nutrient intakes by snack type, sleep hour and eating place
Values are presented as mean ± SD.
HCLN, high-calorie·low-nutrition.
1)Data from 109 samples who consumed healthy snack or HCLN snack; 2)Excluded 7 samples including whose energy intake are either less than 500 kcal, or more than 4,000 kcal, n = 230; 3)Sleep-deprived group: less than 7 h ; Sleep-moderate group: 7 h to less than 8 h; Sleep-recommended group: more than 8 h; 4)Nutrient analysis for one day (3 meals); 5)It belongs to the nutrient intake analysis for one meal; The total frequency for eating places is 613 due to the multiple choice question. 6)Different superscript letters are statistically different at P < 0.05 by least significance difference test.
*P < 0.05.
![]()
Comparison of nutrient intake according to sleeping hours (Table 4) showed that only vitamin C intake (50.0 mg) in the sleep-deprived group was significantly higher (P < 0.05) than that in the moderate sleep group (38.2 mg) and the recommended sleep group (32.8 mg). Other nutrient intakes were not statistically different between the 3 groups.
The eating places for each meal were categorized into home, school, convenience store, and others (neighbors, restaurants, snack shops, fast food shops, snack cart, bakeries, and delivery foods). Most of the students who ate breakfast ate at home (164/168, 97.6%). For lunch, almost all students (232/233, 99.6%) ate at school. However, the eating place for dinner varied. In total, 212 students responded that they ate dinner and 145 (68.4%) adolescents reported that they ate at home, 53 (25.0%) at other places, and 14 (2.3%) at convenience stores. Among a total of 613 meals consumed by the adolescents, 309 meals (50.4%) were eaten at home, 232 (37.8%) at school, 54 (8.8%) at other places, and 18 meals at convenience stores (2.9%).
Except for calcium, the other nutrient intakes showed significant differences depending on the eating place, indicating that the place where a meal was consumed was a major factor determining dietary quality. The energy intake for adolescents was the highest for meals consumed at others places, including restaurants or buffets (823.8 kcal), followed by school (726.3 kcal), convenience stores (610.2 kcal), and home (563.3 kcal). The protein intake from school meals (34.5 g) and other places (30.3 g) was higher than home (21.5 g) and convenience stores (15.9 g) (P < 0.05). The intake of vitamin A, vitamin B1, vitamin B2, niacin, iron, and folic acid from school meals was the highest among the eating places. The lowest intakes of vitamin C and protein were consumed in meals eaten at convenience store. The ratio of carbohydrate:fat:protein ratio were: school meals (48.1%:32.2%:19.0%), other places (52.4%:34.1%:14.7%), meals at home (52.2%:31.5%:15.3%), and convenience store meals (60.0%:31.4%:10.4%). All meals, regardless of place consumed, showed fat intakes exceeding the upper limit of 30% [27] calories from fat. Therefore, adolescents need to reduce their fat intake, especially from meals eaten at school and other places.
NAR, MAR, and INQ by gender, snack type, sleep hours, and eating place
Table 5 shows the NAR, MAR, and INQ according to gender, snack type, sleeping hours, and meal place. In the NAR of boys and girls, the nutrients with insufficient intake were vitamin C (0.4 boys and girls), calcium (0.4 boys and girls), iron (boys 0.8, girls 0.7), vitamin A (boys 0.8, girls 0.9), and folic acid (boys 0.9, girls 0.8). The intake of vitamin B2 and niacin was significantly different (P < 0.05) between boys and girls. The intake of vitamin B2 was only insufficient in boys (boys 0.8, girls 1.0). Niacin intake was only insufficient in girls (0.8 for girls, 1.0 for boys). The MAR was low in both boys and girls at 0.9. In terms of INQ, the intake of vitamin C and calcium was less than 0.5 in both boys and girls and iron intake was lower for girls than boys (P < 0.05).
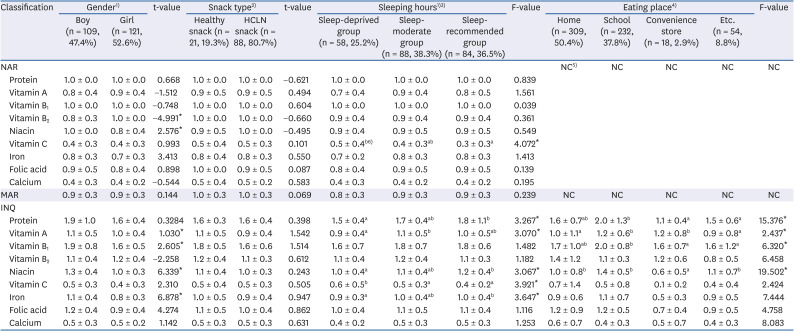
Table 5
NAR, MAR, INQ by snack types sleeping hours and eating places
Values are presented as mean ± SD.
HCLN, high-calorie·low-nutrition; NAR, nutrient adequacy ratio; MAR, mean adequacy ratio; INQ, index of nutritional quality; NC, not calculated because of one meal.
1)Excluded 7 samples including whose energy intake are either less than 500 kcal, or more than 4,000 kcal, n = 230; 2)Data from 109 samples who consumed healthy snack or HCLN snack; 3)Sleep-deprived group: less than 7 h; Sleep-moderate group: 7 h to less than 8 h; Sleep-recommended group: more than 8 h; 4)The frequency for eating places is a total of 613 due to the multiple choice response question; 5)NAR and MAR were not calculated, because the data was just nutrient intake from one meal not one day by eating places; 6)Different superscript letters are statistically different at P < 0.05 by least significance difference test.
*P < 0.05.
![]()
Comparison of the NARs between the healthy snack and HCLN snack groups showed deficiencies in both groups in vitamin C (0.5), calcium (0.5), iron (0.8), and vitamin A (0.9). However, there were no significant differences in the nutrient intake between the groups. The MAR was 1.0. in the group that consumed snacks, indicating better nutrient intake than in those who did not consume snacks (0.9). In the INQ, the vitamin C and calcium intake qualities were lower than 1 and there were no significant difference in nutrients depending on the snack type (P > 0.05).
In terms of sleeping hours, only vitamin C intake was significantly higher in the sleep deprivation group (0.5) than in the recommended sleep group (0.3) (P < 0.05). The MAR showed lower than the recommended intake in all 3 sleep groups (sleep deprivation 0.8, adequate sleep 0.9, and recommended sleep 0.9), but the differences were not significant. The most under-consumed nutrients in the INQ were vitamin C (0.4–0.6) and calcium (0.4–0.5). Nutrients less than 1 in the INQ were vitamin A, vitamin C, and iron, with significant differences among the 3 groups. The INQ of vitamin C in the sleep deprivation group was higher (P < 0.05), but vitamin A and iron were lower than those of the other groups (P < 0.05).
In terms of diet adequacy by eating place, the NAR and MAR were not calculated because they are calculated as the ratios of 1 day's nutrient intake to the recommended intake. The INQ values of protein, vitamin A, B1, and niacin differed (P < 0.05) according to the eating place. The INQs of protein (2.0) and niacin (1.4) from school meals were the highest and those of convenience stores were the lowest (protein 1.1, niacin 0.6) among the 4 eating places. The INQ of vitamin A was in the order of school (1.2), convenience stores (1.2), home (1.0), and other places (0.9), indicating that the nutrient density was low in meals consumed at home and other places. Vitamin B1 was sufficiently consumed in school (2.0), at home (1.7), in convenience stores (1.6), and other places (1.6). Thus, the intake of vitamin B was sufficient in meals consumed in all places. The lower density nutrients in the INQ were vitamin C, calcium, iron, and folic acid. School meals had INQs with densities higher than 1, except for vitamin C and calcium, whereas convenience store meals had lower densities of nutrients, especially in vitamin C, calcium, iron, folic acid, and niacin.
Go to :
DISCUSSION
In this study, the average energy intake of adolescents was 1,829 kcal and the ratio of carbohydrates:lipids:protein was 52.3:31.5:15.9. The results of the NAR showed that calcium and vitamin C intakes were the most deficient in both boys and girls, followed by vitamin A, iron, and folic acid. According to the 2017 Korean National Health and Nutrition Survey Examination [25] and the Adolescent Health Behaviors report [2829], the energy intake of adolescents is 2,027 kcal and the ratio of carbohydrates:lipids:protein is 62.2:22.9:14.9. In terms of the ratio of actual nutrient intake to recommended nutrient intake, protein, iron, vitamin B1. Vitamin B2, and niacin, met the recommended intake, but vitamin C, calcium and vitamin A did not [29]. Comparing the published guidelines with our study, our study samples showed less caloric intake and higher lipid intake. However, similar results were found in the insufficient intake of vitamin C and calcium and lower intake of vitamin A, iron, and folic acid. Thus, considering that Westernized dietary habits are associated with a high risk of obesity [30], action plans for eating fewer lipids below 30% of total calorie need to be developed to improve the dietary quality of adolescents, as well as meal plans formulated to increase the intake of vitamin C and calcium for adolescents.
This study showed that 109 (47.4%) out of the 230 adolescents surveyed consumed snacks. A previous study suggested that nearly 60% of adolescents and adults consumed 3 meals, as well as snacks each day and nearly 10% of their representative samples consumed more than 50% of their daily calories from snacks [31]. In comparison, the students in our study sample showed a lower snack consumption rate. Among the students who snacked, only 19.3% (21 students) consumed healthy snacks, whereas 80.7% (88 students) consumed HCLN snacks. Snacks frequently consumed by the adolescents were very similar to those reported in the previous study [9]. The study reported their favorite snacks of the students to be fruit, dairy products, cookies, bread, ramen, ice cream, chocolate, carbonated beverages, chicken, pizza, and hamburgers.
In our study, there were no significant differences in nutrient intake between the healthy snack group and the HCLN snack group, inconsistent with results of a previous study [1] that reported higher intakes of energy, protein, lipids, and carbohydrates in the HCLN snack group than the healthy snack group. Even though data were not presented as Table, this study found that the adolescents who consumed snacks (MAR = 1.0) had much better nutrient intakes than those who did not consume snacks (MAR = 0.9) and the sugar intake of the adolescents was about 14.3% of the total energy intake. These results indicate that not only providing snacks between meals to adolescents is crucial to compensate for the insufficient nutrient intake from meals, but also adolescents need to consume less sugar and need proper nutritional education. To foster healthy snack consumption, nutritional education or healthy environments that promote increases in the intake of vitamin A, vitamin C, iron, folic acid, and calcium should be provided. According to the Korean Ministry of Food and Drug Safety's report on the sugar content of breads industry, one-serving size of bread is approximately 149 g and its sugar content is an average of 23 g. This accounts for 46% of the recommended sugar intake of 50 g a day [32]. As the WHO recommends sugar intake below 10% of the total energy intake (i.e., less than 50 g of sugar intake in 2,000 calories), the sugar intake of Korean adolescents aged 12 to 18 was reported to be 11.1% of the total energy [33] and that of elementary students was 75.7 g equivalent to 12.1% [10]. Compared with this point, the adolescent in our study consumed higher sugar intake from the snack.
The average sleep time of the adolescents in this study was 7 h and 42 min for boys and 7 h 6 min for girls. The results are similar to that of the 2017 Youth Total Survey [29] that reported adolescents aged 13 to 18 slept 7 h and 28 min on weekdays and 8 h 57 min on weekends. The U.S. NSF suggest 7–8 h for appropriate sleep hours in adolescents and 8–10 h for the recommended sleep hours [17]. Based on the guideline, 7.2% of the boys and 18.6% of the girls in our study did not meet the criteria because they slept less than 7 h. Specifically, too many girls did not meet the adequate sleep time requirement and their sleep habits need improving.
A previous study examined the relationship between self-reported sleep duration and dietary quality in adolescents. They found that short sleep duration was associated with lower dietary quality [131634] and food consumption patterns [3536]. The well-slept group consumed less late-night snacks and more fruits than the not-well-slept group, from the study to identify the relationship between snack intake and sleep quality in Korea [13]. Adolescents slept more than nine hour consumed higher intake of riboflavin, niacin, and vitamin C in terms of NAR [36]. In addition, short sleep showed the more frequent consumption of calorie-rich foods and lower nutrient-dense food [35]. Short sleep was also associated with increased odds ratio of fast food consumption and decreased vegetable and fruit consumption, compared to those who slept more than 9 h [20]. The group with good sleep quality consumed milk more frequently, but the poor sleep quality group had higher intakes of carbonated beverages [34].
Our study found that the INQ of protein, vitamin A and iron in the sleep deprivation group was lower than those of the other groups (P < 0.05), supporting the positive association between adequate sleep and diet quality. Surprisingly, however, the sleep deprivation group in our study had higher intakes of vitamin C rather than the appropriate sleep and the recommended sleep groups, even though all 3 groups did not meet the reference intake (P < 0.05). This result may be attributed from the point that the sleep deprivation group is more likely to feel frequent fatigue and tend to more consume vitamin C-fortified beverages (e.g., Vita 500 drink, Oronamin C drink) to relieve their fatigue. A study conducted with high school students suggested a relationship between sleep and snack intake based on eye blinking, where students who blinked more consumed more frequent snacks [2]. The results suggest that lack of sleep not only induced blinking but increased the intake of snacks and affected fatigue, psychological disorders, and attention disorders. Other studies have pointed out that short sleeping hours could induce hormonal changes, which increased perceived hunger by inhibiting the secretion of leptin and stimulating the release of ghrelin, leading to an increase in appetite, higher consumption of energy-rich foods, and obesity. The tendency was reported to be stronger in men than in women [235].
Our study verified that the eating place was a key determinant affecting the quality of adolescent diets, indicated by different nutrient intakes (except calcium) in different eating places (P < 0.05). Schools provided balanced diets and higher-quality diets compared to the other places. This result is consistent with a previous study [521]. In convenience store meals, the nutrients showing less than 1 in the INQ were vitamin C, calcium, iron, folic acid, and niacin, and were lower than foods consumed in other places. Moreover, when adolescents ate at convenience stores, the ratio of carbohydrates: lipids: protein was 60.0%:31.4%:10.4%, indicating less protein intake. These results showed that the more frequently meals are consumed at convenience stores, the higher the risk of insufficient intake of protein, vitamin C, calcium, iron, and folic acid vital for adolescents' growth. A study assessing the dietary habits of Canadians by eating location and occasion [31] found that the total energy consumption for adolescents who ate at home was 2,307 kcal for boys and 1,615 for girls, whereas for fast food, including fast food outlets and take-out, boy consumed 1,082 kcal and girls 692 kcal. In all other places, including restaurants with servers, schools, and non-school cafeterias, boys consumed 796 kcal and girls 673 kcal [31].
Our study had some limitations. The study used a convenience sampling methodology as a cross-sectional study, so it was not representative of all Korean adolescent samples and did not explain the causal findings. Therefore, this limitation should be considered when interpreting the results. Another limitation was that only 1-day dietary intake data, as well as data from self-reported surveys, were used for the analyses. Even though we tried to improve the consistency in reporting by providing a leaflet with representative one-serving sizes, the study was still limited to 1-day dietary intake and depended on the adolescents' memories. Nonetheless, this study had some strengths. It examined the nutrient intakes for adolescents according to eating place, snack type, and sleep hours and tested the adequacy of the dietary intake and quality by measuring the NAR, MAR and INQ.
In conclusion, this study found that adolescents' nutrient intake was partially different by eating place and sleep hours. The nutrient intake of boys was 1,914.8 kcal and 1,752.7 kcal for girls. Boys consumed more niacin and protein than girls and all students consumed less calcium and vitamin C than recommended. According to snack types, even though the healthy snack group consumed more vitamin A, vitamin C, iron, and calcium and less energy, carbohydrates, and fats compared to the HCLN snack group, there was no statistical difference. According to sleep amount, the INQs of protein, vitamin A and iron were significantly lower in the sleep-deprived group than the sleep-appropriate and sleep-recommended groups. Meanwhile, vitamin C intake in the sleep deprivation group was higher than the other groups due to consumption of vitamin C fortified drinks (P < 0.05), but, no group met the recommended intake of vitamin C. Depending on the eating place, nutrient intake, except for calcium, was significantly different. School meals showed a higher nutrition intakes in terms of protein, vitamin C, vitamin A, vitamin B1, vitamin B2, niacin, iron, and folic acid, whereas convenience store meals had the lower density of nutrients, especially for vitamin C, calcium, iron, folic acid, and niacin.
From the study, meal places and sleep hours were verified to have an impact on the food choices of adolescents. Therefore, policies and action plans to educate the importance of sufficient sleep and proper food choice habits to adolescents are needed. More study is also needed to identify the relationship between higher intake of vitamin C and short sleep.
Go to :
 XML Download