

 PDF
PDF Citation
 Print
Print


INTRODUCTION
Early-life postnatal nutrition plays a critical role in optimal infant growth and development, and can have long-term health implications [1]. In addition to providing “general” macronutrients that satisfy the normal growth and development of the infant, human breastmilk (HBM) is a rich source of bioactive compounds that protect against infection, support brain, gastrointestinal, and immune development [2], and contribute to long-term benefits such as reducing the risk of obesity and type-2 diabetes [3].
Among the macronutrients present in HBM, lipids are important nutritional components constituting the major energy source for the consuming infant. Some essential nutrients such as “essential fatty acids” (FAs), which cannot be synthesized in the body but are required for biological processes, are all provided by the HBM; these include α-linolenic acid (ALA), linoleic acid, and long-chain (LC) poly unsaturated fatty acids (PUFA) [4]. LCPUFA, especially docosahexaenoic (DHA) and arachidonic acid (AA), play a crucial role in functioning of the immune system and neurodevelopment. DHA, AA and other PUFAs rapidly accumulate in the brain of infants, and have been implicated in neural, visual cognitive and motor development [5]. It is well documented that maternal characteristics such as body mass index (BMI) [67] influence the FA composition and concentration in HBM. Moreover, reports indicate that maternal BMI impacts the HBM macronutrient composition, omega n-6:n-3 ratio, expression of inflammatory markers, gut microbiota, and the immunological profile [8910]. Thus, exploration of the general and specific HBM composition during the first months of life is critical for a full understanding of the health implications of the infant and later development in life.
HBM composition and intake has been extensively studied [111213141516]. However, methodology and the timing of HBM collection in existing studies vary dramatically, and some studies on human milk FA composition are limited to the first week of life [1718]. This study therefore aimed to establish a mother and child cohort in the Chinese population, and investigate the HBM composition during the first 3 mon of life. The study further determined the association of maternal BMI and HBM composition, and its relationship with infant growth and development.
Go to : 
SUBJECTS AND METHODS
Study design
Totally, 101 healthy Chinese mother and infant pairs were recruited at the Changsha Maternal and Child Health (MCH) Hospital. Mothers were enrolled postpartum, and requested to fill out detailed health history questionnaires. Exclusive breast-feeding up to 3 mon of age was an inclusion criterion for the study. The exclusion criteria included maternal use of tobacco and alcohol, suffering from disorders such as hypertension, pre-eclampsia, infections, hypo- or hyperthyroidism and hepatic renal diseases, consumption of a non-conventional or vegan diet, and premature infants or infants with other neonatal disease. Mothers were interviewed by a trained investigator at 3 time points: mon 1 (T1), mon 2 (T2), and mon 3 (T3). All mothers agreed to provide an HBM sample during the first 3 mon of lactating, and corresponding anthropometric (height, weight and BMI) measurements of mothers were collected. Growth measurements of infants were also recorded by trained investigators, which included the infant's weight, length, BMI and head circumference (HC). Characteristics of the participants are summarized in Table 1. The mother-child pairs from the cohort were further classified according to the maternal BMI after childbirth [1920]: Low BMI (18 kg/m2 ≤ BMI ≤ 20 kg/m2, n = 25) and High BMI (BMI ≥ 25 kg/m2, n = 23). The present study was conducted at the Changsha MCH Hospital, China. The study protocol was reviewed and approved by the Medical Ethics Research Board of Changsha BCH hospital (approval No. CSE20160021). The study was performed in accordance with the principles of Declaration of Helsinki. All enrolled participants provided written informed consent for the study.
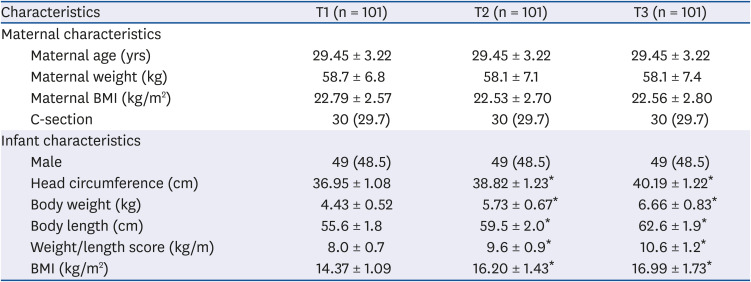
Table 1
Characteristics of subjects included in the Xiang maternal and child cohort
Values are presented as number (%) or mean ± SD.
BMI, body mass index; T1, 1 mon; T2, 2 mon; T3, 3 mon.
*Significantly from baseline, P < 0.05 (analysis of variance and the Bonferroni post hoc test).
![]()
HBM collection
Morning HBM samples were collected over a 3-mon period, using a modified published methodology [21]. Subjects fully pumped the milk from one breast into a bottle, and the bottle was inverted 6 times; 10 mL of the HBM was transferred into a 15 mL polypropylene tube. The sample was subsequently frozen (−20°C) and transported to the hospital on ice within 1 week, and subsequently stored at −80°C until processing.
Macronutrient concentration and osteopontin (OPN) analysis
The concentration of total fat, protein, energy, and true protein were measured by an MIRIS HMA breast milk automatic analyzer (Miris Holding AB, Uppsala, Sweden) via a medium infrared transmission spectroscopy technique. Before analysis, samples were thawed and homogenized by an ultrasonic homogenizer. OPN was measured using the Quantikine Human OPN ELISA kit (R&D Systems, Minneapolis, MN, USA), validated for quantitative determination of OPN in human milk, as per the protocol of Bruun et al. [22].
FA profiles analysis
The FA composition of individual breast milk samples was determined according to the method as described by Chisaguano et al. [23]. FA methyl esters (FAMEs) were prepared with sodium methylate in methanol (0.5 M) and boron trifluoride methanol solution (15% v/v). They were then resolved and quantified by gas chromatography (GC) using an HP-6890 Series GC system equipped with flame ionization detector (FID), and a fused-silica capillary column (100 m 0.25 mm internal diameter, 0.2 µm thickness) coated with a 100% bis-cyanopropyl polysiloxane stationary phase (Supelco, Saunderton, UK). A standard solution of Supelco 37-component FAME mix (Sigma-Aldrich, St. Louis, MO, USA) was used to identify peaks of interest. FAs were then quantified by standard normalization and expressed as a percentage of the total FAs (% total FA). Total FAs were determined by adding the corresponding single FA to saturated FAs (SFAs), monounsaturated FAs (MUFAs) and PUFAs, n-6 PUFAs and n-3 PUFAs, and the n-6 to n-3 ratio were subsequently determined for analyses.
Matrix-assisted laser desorption/ionization time-of-flight (MALDI-TOF) mass spectrometry (MS) measurements
The milk samples were defrosted at room temperate (20–24°C) and centrifuged at 13,000 g for 10 min at 4°C. The fat fraction was carefully removed, and the supernatant collected. For MALDI-TOF-MS polypeptide profiling measurements, each defatted breast milk sample was mixed with a solution of 0.1% v/v trifluoroacetic acid (TFA) in a 1:1 ratio; 2 µL of this primary diluent was then added to 8 µL sinapinic acid (10 mg/mL) (Intelligene Biosystems, Qingdao, China), vortexed, and 2.5 µL of this mixture was spotted onto a stainless steel MALDI target plate (6 × 16 sample array) and subsequently dried at room temperature. Protein calibration reagent (Intelligene Biosystems) was prepared as per the manufacturer's instruction, and used as a quality control. MALDI-TOF-MS analysis was performed by the QuanTOF (Intelligene Biosystems), a newly developed MALDI-TOF MS system [24]. ReadMzXmlData obtained by QuanTOF were further analyzed using the MALDIquant, which includes spectral mass adjustment, optimal smoothing, spectral baseline subtraction, normalization, and internal peak alignment [25]. Pretreated data were then subjected to visualization and statistical analysis.
Statistical analysis
Statistical analyses were performed using the SPSS (v20.0; IBM Corp., Armonk, NY, USA) software. Anthropometric and growth characteristics of mother and infants, and HBM FA evolution over time, were evaluated using repeated-measure analysis. Bonferroni correction was applied for post hoc analyses, and Kruskal-Wallis test was used for the test indices that had not passed the Shapiro–Wilk normality test. Nonparametric independent sample Wilcoxon signed-rank test was performed to compare the HBM FA composition between maternal weight groups. Correlation analyses between maternal BMI and infant anthropometric measurements were achieved using a Pearson correlation coefficient. Correlation analysis between HBM FAs with maternal BMI or infant growth indicators were performed by applying the Spearman correlation analysis. The principle component analysis of proteomic data was carried out by an external MATLAB software tool. Data are expressed as mean ± SD. A value of P < 0.05 (2-tailed) is considered as statistically significant.
Go to :
RESULTS
Characteristics of mother and infant pairs
Characteristics of subjects included in the Xiang maternal and children cohort are outlined in Table 1. No significant change was observed in the mother's BMI during the first 3 mon of lactation (P > 0.05). As expected, infant growth measurements such as body weight, length, BMI and HC were significantly increased during the first 3 mon of life.
Compositional changes in human breast milk over lactation
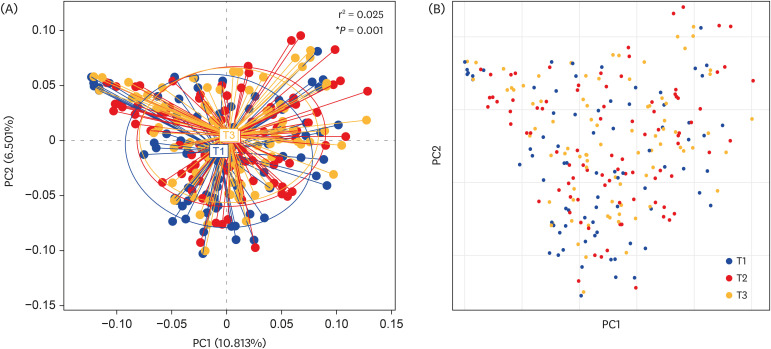
Shifts in milk nutrient concentrations are illustrated in Fig. 1. The concentrations of total energy, fat, fatty acid and protein were significantly decreased during the first 3 mon of lactation. Moreover, a statistically significant reduction in OPN was observed over time. However, no significant changes were observed in the carbohydrate concentration. PCA analysis was performed on the MALDI-TOF polypeptide mass spectral data at T1, T2, and T3. As highlighted in Fig. 2, significant overlapping area was observed between T1, T2, and T3. However, the T1 plots were clearly distinguished from T2 and T3 (P < 0.05), indicating that polypeptide profiling of T1 was significantly different from T2 and T3.
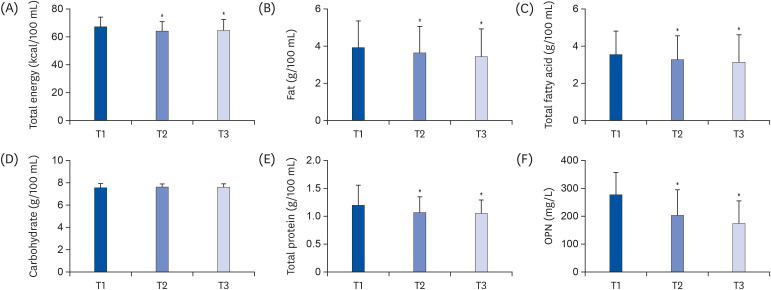 | Fig. 1Shifts in human milk nutrient concentrations during the first 3 mon of lactation: total energy (A), fat (B), total fatty acid (C), carbohydrate (D), total protein (E), and OPN (F).All values are represented as mean ± SD (n = 101).
OPN, osteopontin; T1, 1 mon; T2, 2 mon; T3, 3 mon.
*P < 0.05 (analysis of variance and the Bonferroni post hoc test).
|
The FA evolution from T1 to T3 is highlighted in Table 2. Medium and long-chain SFA (including C13:0, C16:0, C22:0 and C24:0), MUFA (including C16:1), and n-6 PUFA (including C20:3n-6 and C20:4n-6 [AA]), and the n-6/n-3 ratio were observed to significantly decrease over time (P < 0.05). Conversely, short-chain fatty acids such as butyrate and C6:0, and n-3 PUFA (including C18:3n-3 [ALA]) were found to increase over time (P < 0.05). No significant changes were recorded in the n-3 PUFA levels, which include C20:5n-3 (eicosapentaenoic acid, EPA) and C22:6n-3 (DHA).
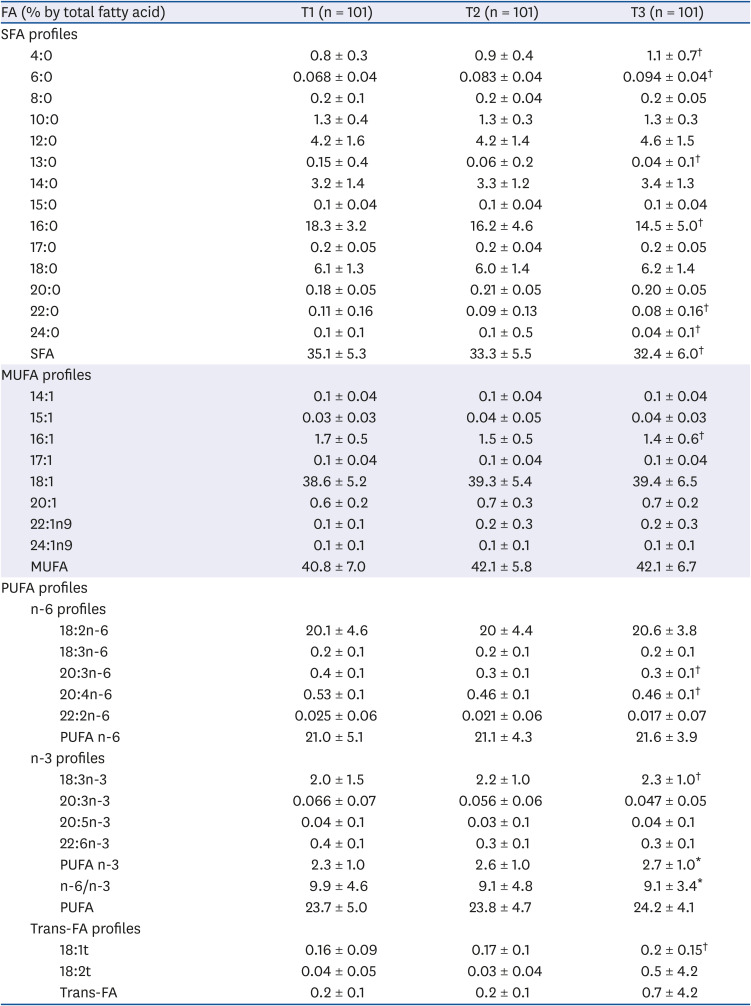
Table 2
Dynamics of the fatty acids in breast-milk during the first 3 mon of life
Values are presented as mean ± SD.
FA, fatty acid; SFA, saturated fatty acid; MUFA, monounsaturated fatty acid; PUFA, poly unsaturated fatty acids; T1, 1 mon; T2, 2 mon; T3, 3 mon.
*Statistically significant differences among the 3 groups, P < 0.05 (Kruskal-Wallis test); †Statistically significant differences among the 3 groups, P < 0.01 (Kruskal-Wallis test).
![]()
Personalized analysis of high-BMI mothers versus low-BMI mothers
The growth measurements recorded at T1, T2, and T3 between infants born to normal weight and overweight mothers are illustrated in Fig. 3. No statistically significant differences were determined in the mean weight, length and weight/length score of infants in both groups at T1, T2, or T3. However, the HC of infants born to overweight mothers was significantly higher than values obtained for infants born to normal weight mothers at T1, T2, and T3 (P < 0.05).
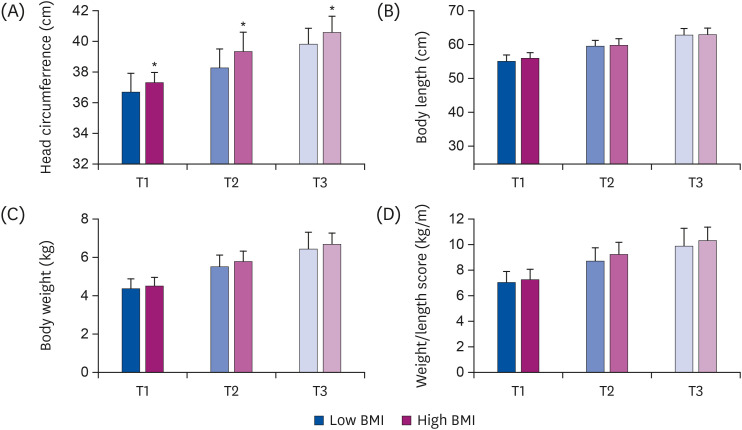 | Fig. 3Comparison of the head circumference (A), body length (B), body weight (C) and weight/length score (D) of infants born to normal weight and overweight mothers, at T1, T2 and T3. All values are represented as mean ± SD (n = 23–25/group).BMI, body mass index; T1, 1 mon; T2, 2 mon; T3, 3 mon.
*P < 0.05 (Independent t-test).
|
As highlighted in Fig. 4, the HBM composition of macronutrients, including total energy, total fat, total fatty acid, carbohydrate and total protein, was determined in low BMI and high BMI mothers during the first 3 mon of lactation. Total energy, total fat, fatty acid and total protein were significantly higher in the high BMI group at T1 and/or T2, as compared to low BMI group. No significant difference was observed in the carbohydrate concentration between groups at any time point. Interestingly, at T3, OPN concentrations were significantly higher in the high BMI group as compared to the low BMI group.
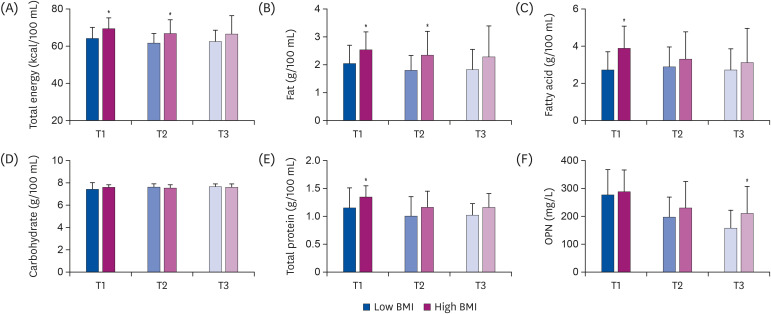 | Fig. 4Comparison of the total energy (A), fat (B), total fatty acid (C), carbohydrate (D), total protein (E) and OPN (F) in breast milk of normal weight and overweight mothers during the first 3 mon of lactation. All values are represented as mean ± SD (n = 23–25/group).OPN, osteopontin; T1, 1 mon; T2, 2 mon; T3, 3 mon.
*P < 0.05 (Independent t-test).
|
Differences in HBM FAs between weight groups are presented in Table 3. Compared to the low BMI group, the high BMI group had higher levels of C18:3n-6, C20:3n-6, and total PUFA at T1, higher levels of C20:3n-6 at T2, and higher levels of C20:3n-6 and n-6/n-3 ratio at T3. Conversely, the levels of butyrate at T1, and C18:1 and total MUFA at T2 were significantly lower in the high BMI group than the low BMI group.
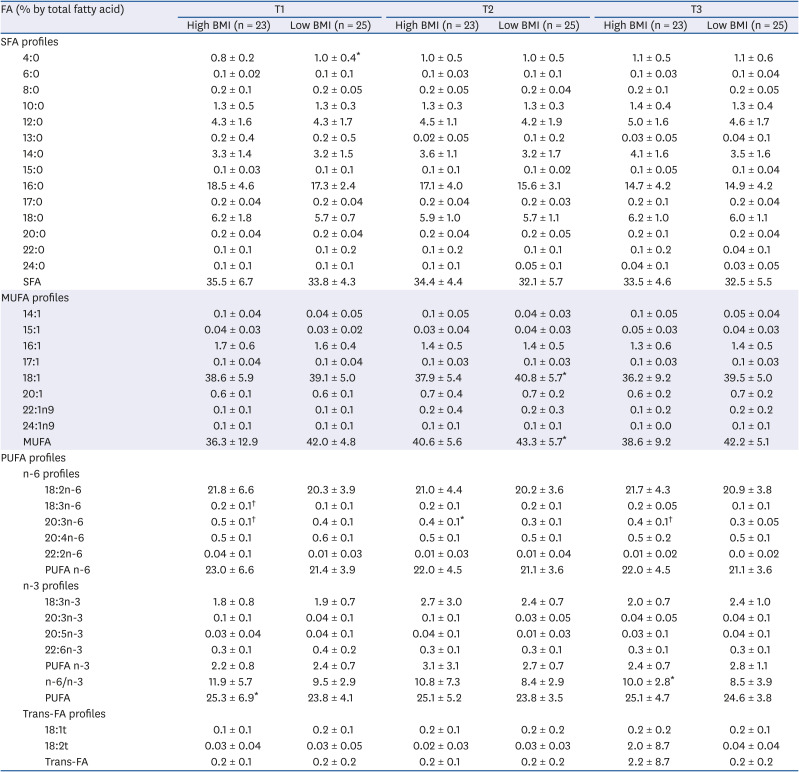
Table 3
Effect of Maternal BMI on the fatty acid composition
Values are presented as mean ± SD.
BMI, body mass index; FA, fatty acid; SFA, saturated fatty acid; MUFA, monounsaturated fatty acid; PUFA, poly unsaturated fatty acids; T1, 1 mon; T2, 2 mon; T3, 3 mon.
*Statistically significant differences between the 2 groups, P < 0.05 (Wilcoxon signed-rank test); †Statistically significant differences between the 2 groups, P < 0.01 (Wilcoxon signed-rank test).
![]()
Association of mother's BMI, breast milk FAs, and infant HC growth
As shown in Fig. 5, after adjusting for potential confounders (maternal age, delivery pattern and sex of child), maternal BMI was consistently and positively associated with infants' HC at each visit over the first 3 mon of life (T1: r = 0.40, P < 0.001; T2: r = 0.41, P < 0.001; T3: r = 0.28, P = 0.01). At T1, maternal BMI positively correlated with the HBM: C20:3n-6 (r = 0.45, P < 0.001) and C18:3n-6 (r = 0.39, P = 0.002), and was inversely associated with butyrate (r = −0.31, P = 0.006). At T2, maternal BMI positively correlated with the HBM: C20:3n-6 (r = 0.45, P < 0.001) and C18:3n-6 (r = 0.40, P < 0.001), and was inversely associated with C18:1 (r = −0.43, P < 0.001) and total MUFA (r = −0.46, P < 0.001). At T3, maternal BMI positively correlated with the HBM: C20:3n-6 (r = 0.44, P < 0.001) and n-6/n-3 (r = 0.43, P < 0.001), had a trend toward significance with HBM: C18:3n-6 (r = 0.21, P = 0.08), and was inversely associated with C18:3n-3 (r = −0.42, P < 0.001) and n-3 PUFA (r = −0.41, P < 0.001). As presented in Fig. 5, correlation analysis of the HC of infants and HBM FAs indicate that HC is negatively correlated with C18:0 at T2 and T3 (T2: r = −0.44, P < 0.001; T3: r = −0.38, P = 0.001), and inversely correlated with HBM: C20:3n-3 (r = −0.32, P = 0.004) and C20:5n-3 (r = −0.31, P = 0.005).
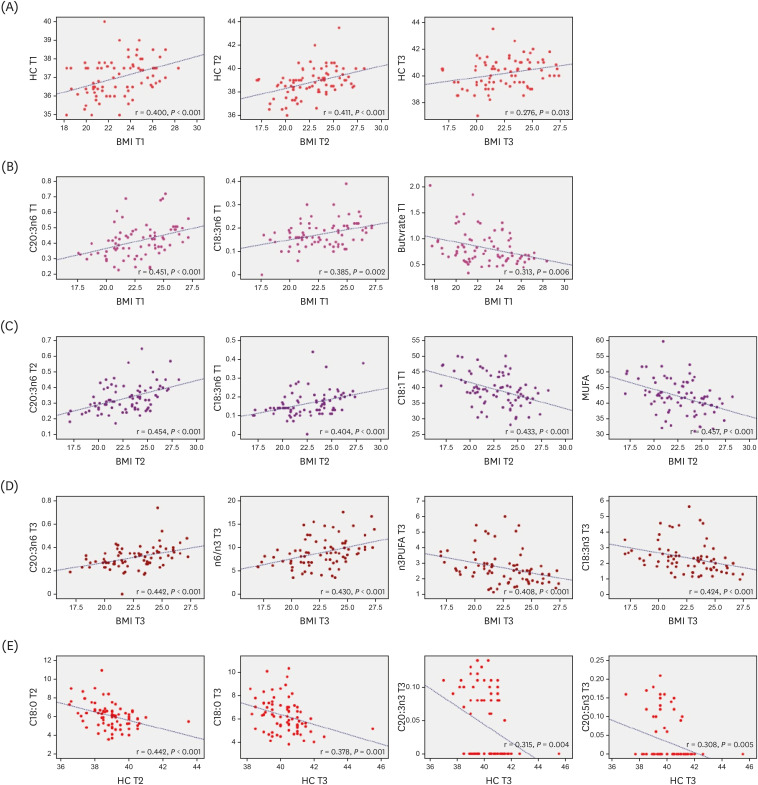 | Fig. 5Correlation between maternal BMI and infant HC at T1, T2, and T3, examined by Pearson correlation analysis after adjustment for potential confounders: maternal age, delivery pattern, and sex of child. The correlation between HBM FAs with maternal BMI or infant HC at T1, T2, and T3, examined by Spearman's rank analysis after adjustment for potential confounders: maternal age, delivery pattern, and sex of child (n = 101).(A) Correlation between maternal BMI and infant HC at T1, T2, and T3. (B) Correlation between maternal BMI and C20:3n-6, C18:3n-6 and butyrate at T1. (C) Correlation between maternal BMI and C20:3n-6, C18:3n-6, C18:1 and total MUFA at T2. (D) Correlation between maternal BMI and C20:3n-6, n-6/n-3, n-3 PUFA, and C18:3n-3 at T3. (E) Correlation between infant HC and C18:0 at T2 and T3, and inversely correlated with C20:3n-3,C20:5n-3 at T3.
BMI, body mass index; HC, head circumference; HBM, human breast milk; FA, fatty acids; MUFA, monounsaturated fatty acid; PUFA, poly unsaturated fatty acids; T1, 1 mon; T2, 2 mon; T3, 3 mon.
|
Go to :
DISCUSSION
The present study provides prospective data on the HBM of Chinese mothers during the first 3 mon of the infant's life. Few studies have evaluated the influence of maternal BMI on HBM composition and infant growth, especially HC. Overall, our data on the changes in HBM total energy, total fat, total fatty acid, carbohydrate, and total protein are consistent with previously reported data [262728]. However, it should be noted that a common limitation in such data sets is the significant variability in HBM composition between individuals and during stages of lactation.
To determine changes in the protein composition, we applied MALDI-TOF and demonstrated that proteomic polypeptide profiles at T1 are significantly different as compared to T2 and T3. This is consistent with a recent meta-analysis, which indicates that the protein contents and composition vary with different stages of lactation [29]. It is well recognized that OPN is a bioactive protein present in high concentrations in HBM [30], and plays a significant role in the maturation of the infant immune system [31]. Decrease in OPN concentrations over time were significant, and could be associated with the biological functions during the first 3 mon of life. Our previous study has demonstrated that levels of OPN in breast milk acquired from Chinese mothers is significantly higher than values obtained in Korean, Japanese and Danish mothers [22]. However, the precise reasons are unknown, and warrant further investigation.
As expected, FA profiles have a high level of individual variability; however, our results correlate well with previous studies [171832]. Interestingly, our data highlights that the concentration of SFAs and MUFAs are lower, when compared with European and African studies [3233]. It is feasible that this could be due to the higher intake of olive oil in these countries [18]. Our study also highlights that SFAs, including C13:0, C16:0, C22:0 and C24:0, gradually reduce over time. SFA, especially medium-chain (MC) SFA, are preferentially absorbed and metabolized by neonates [34]. MCSFAs are beneficial for the absorption of fat and Ca, and they represent a rich source of energy [35]. In addition, our study found that MUFA and PUFA account for 40.8–42.1% and 23.7–24.2% of the total FA, respectively, which is significantly higher than values recorded 10 years ago by Wan et al. [36] (MUFA: 32.59%; PUFA: 19.97%) in a study of HBM in north China. These results could be attributed to a shift in the Chinese diet [37] and requires further investigation. We also observed a decrease in the n-6/n-3 PUFA ratio, which was attributed to the decrease in n-6 PUFA (such as C20:3n-6 and C20:4n-6) and increase in n-3 PUFA (such as C18:3n-3 [ALA]). PUFAs play an important role in infant growth and development, particularly neurodevelopment [3839] and visual acuity in early life. PUFAs such as LA and ALA are termed essential nutrients, as they cannot be synthesized de novo from other lipids [4041]. Thus, neonatal PUFA intake completely relies on the supply from an external source. LCPUFA, such as AA and DHA, can be provided to the infant via breast-feeding, or synthesized in the neonatal liver by chain elongation and desaturation of their corresponding precursors (LA and ALA, respectively). The rate of conversion in most neonates is low [42], and it is therefore necessary to supply adequate AA and DHA through diet, and preferably through the mother's HBM [43].
Studies on the effect of maternal factors on human HBM content are limited [11224445]. In the current study, we explored the impact of maternal BMI on HBM composition, with a key focus on changes in FA concentrations over time. Personalized analysis indicated that most macronutrients in HBM were significantly higher in the high BMI maternal group. n-6 PUFA, such as C20:3n-6, C18:3n-6 and n-6/n-3 PUFA ratio, were all significantly higher in the high BMI group as compared to the low BMI group, which is consistent with other studies [45]. Higher n-6/n-3 PUFA ratio suggests a relatively pro-inflammatory profile in the overweight group compared to the normal weight group [45]. Conversely, butyrate, which is reported as the anti-inflammatory factor [46], was higher in the normal weight HBM than overweight HBM group. Interestingly, a recent study reported that human milk butyrate is negatively associated with changes in infant weight [47]. An important factor that could be attributed to differences in HBM is maternal diet [48]. Overweight mothers probably have an increased dietary intake of n-6 FAs and poor intake of n-3 PUFAs. Our association analysis indicates that BMI is positively associated with n-6 PUFA (such as C20:3n-6 and C18:3n-6), and negatively associated with n-3 PUFA, ALA and butyrate. In accordance with these results, some studies have reported that a high dietary intake of n-6 FAs and a low intake of n-3 FAs is related to high weight status [49]. It should be noted that not all kinds of n-6 PUFA are elevated in the breastmilk of overweight mothers. For instance, no differences were obtained in the levels of C18:2n-6, C18:3n-6 and C22:2n-6 between the 2 BMI groups. Thus, future studies are required to evaluate the impact of these early nutritional differences on the future development of infants. In our study, we did not find any difference in EPA and DHA between the 2 BMI groups, which is inconsistent with other studies [45]. This could be due to the variability of DHA concentration in human milk, as this HBM component is significantly sensitive to maternal diet [44].
A significant finding in this study is that the HC of infants associated with the overweight maternal group was higher than values obtained in the normal weight group. This result was supported by our correlation analysis, which highlighted that the HC of infants is positively associated with the BMI of the mother. Evidence suggests that infants born to obese mothers have a higher than average weight and length at birth [50]. To our knowledge, this is the first study to address the relationship of infant HC with the concurrent BMI of mothers. Furthermore, our finding shows that n-3 PUFA in HBM, including EPA and C20:3n-3, is negatively associated with infant HC at 3 mon. However, it should be noted that there is no correlation between changes of the HC with maternal BMI or breastmilk composition. Future studies are warranted to get more conclusive outcomes.
It is important to note limitations of the current study. Our study focused on the analysis of mature breastmilk from 1 to 3 mon of lactation. Due to challenges with HBM collection, we lack data on colostrum and transition milk. Furthermore, this is not a long-term follow up study and thus, further investigation is required to evaluate the effect of maternal BMI on the health outcomes for infants. Finally, the mothers enrolled in this study did not consume controlled diets, nor did they record their dietary history and the infant intake of breastmilk, which are limitations when interpreting results of the effect of maternal BMI on breastmilk composition and infant growth. In general, a large sample size and long-term cohort studies are needed to give a better understanding of the role of maternal BMI on HBM composition, and the subsequent effect on the health outcomes of infants.
In conclusion, our results highlight that the HBM macronutrients, SFA, MUFA, n-6 PUFA and n-6/n-3 ratio decrease during the first 3 mon of lactation. Polypeptide profiling of T1 was significantly different from T2 and T3. The HBM of high-BMI mothers presented increased total fat, total protein and total energy, n-6 PUFA and n-6/n-3 ratio. However, the content of MUFA, mainly C18:1, was significantly higher in the milk obtained from low-BMI mothers. The BMI of mothers positively correlates with the HC of infants, as well as the n-6 PUFA C20:3n-6 and C18:3n-6, over the 3 time points examined. However, the HC of infants was negatively associated with C18:0 and EPA. Our data on nutrient composition in a healthy population can contribute to evaluating appropriate intake ranges for Chinese infants, and support the promotion of healthy BMI in lactating women.
Go to :
 XML Download