

 PDF
PDF Citation
 Print
Print


INTRODUCTION
The need for exercise has been increased to prevent various diseases and to live a mentally healthy life. Regular physical activity enhances physical self-efficacy and reduces stress [1] and increases physical fitness level and decreases the risk factors for cardiovascular diseases [2]. Also, exercise reduces the risk for sarcopenia by increasing total muscle mass and muscle index [3].
While high school students have relatively regular meals through school meal programs, college students show irregular meal patterns due to increased autonomy and independence. The frequency of skipping breakfast was higher when students lived at relative's house or in the dormitory compared to eating with their own family [4], and college students tended to purchase processed foods because of the convenience of eating rather than nutrition [5]. Irregular meals can increase the intake of snacks and cause obesity [6], and the sodium overconsumption due to the intake of processed foods increases the risk for metabolic syndromes such as hypertension, obesity, and diabetes [7].
College students have particularly higher depression scores due to the sense of values, employment, and academic stress [8]. Depression is a very important index for mental health of modern people and continued mental health problems such as depression can cause various diseases. Depression increased the smartphone dependency and decreased physical activities [9], and negatively affected health status such as vision, teeth, and sleep conditions [10].
On the other hand, exercise has shown positive effects helped mental health by lowering stress hormones [11]. Thus it is considered that regular exercise guides proper dietary habits and helpful for mental health. Exercise habits, proper dietary habits, and depression management have been important causes of action for health, and combined approaches for effective health management, rather than individual management of each factor, are needed to maintain physical and mental health.
The study was performed to investigate health-related lifestyle, dietary habits, and depression according to exercise frequency to understand complex factors that affect effective health management. The exercise group was expected to make efforts for health care compared to the non-exercise group, and the exercise period was divided into 3 groups to compare and analyze lifestyle, dietary habits, and depression, thereby presenting objective data to increase exercise participation. It will be used as basic data for the development of nutrition programs to improve the dietary problems of non-exercise groups.
SUBJECTS AND METHODS
Subjects and data collection
A survey was conducted on college students, aged 19–29, in Seoul and Gyeonggi-do areas from May 13 to May 31, 2020. Prior to the main survey, a preliminary survey was conducted on 25 college students in April 2020 and then the questionnaire was modified and supplemented for the final version of questionnaire. A total of 594 questionnaires were collected and 566 (269 from males, 297 from females) were statistically analyzed, except 28 with incomplete responses.
General characteristics
The age, grade, main place of eating, father's education level, mother's education level, and monthly household income of the subjects were investigated, and the height and weight were answered by self-administered method. The body mass index (BMI), which is highly correlated with body fat, was calculated by weight (kg)/height (m2).
Health-related lifestyle
Questions for health-related lifestyle included perceived health condition, daily sleeping time, time to go to bed, smoking experience, and alcohol drinking frequency. Based on the previous study [12], college students were divided into no-exercise group, 1–2 times/week exercise group, and over 3 times/week exercise group according to exercise status.
Dietary behavior
Dietary behavior questionnaire included meal frequency, important meal of the day, meal regularity, breakfast frequency, types of picky food, overeating frequency, and importance when selecting menus.
Dietary habits
The questionnaire for dietary habits had a total of 13 questions including 7 positive and 6 negative dietary habit questions [13]. Frequencies were 3 times a day, 2 times a day, 1 time a day, 5–6 times a week, 2–4 times a week, 1 time a week, 2–3 times a month, 1 time a month, and seldom eating. Based on the previous study [14], frequencies were converted into daily number, and conversion factors for calculations were 3 for 3 times a day, 2 for 2 times a day, 1 for 1 time a day, 0.79 for 5–6 times a week, 0.43 for 2–4 times a week, 0.14 for 1 time a week, 0.08 for 2–3 times a month, 0.03 for 1 time a month, and 0 for seldom eating.
Depression
The survey for depression of the subjects was investigated by referring the Center for Epidemiological Studies-Depression (CES-D) scale [15]. CES-D questionnaire was made of 20 questions, and the scores were divided according to the frequency of depression symptoms into ‘rarely’ (less than 1 day per week): 0 point, ‘sometimes’ (1–2 days per week): 1 point, ‘moderately’ (3–4 days per week): 2 points, and ‘mostly’ (5–7 days per week): 3 points. The depression was evaluated as high as the depression score became higher. The degree of depression was divided into 0–15 points: normal, 16–20 points: mild depression, 21–24 points: moderate depression, and 25–60 points: severe depression.
Statistical analysis
Collected data in the study were analyzed using SPSS (version 21.0; SPSS Inc., Chicago, IL, USA) program to calculate frequency, percentage, mean, and standard deviation. For significance verification among variables according to exercise frequency, χ2 test was used for non-continuous variables and analysis of variance test was performed for continuous variables, and then the significance was tested using Scheffe's multiple test. Statistical significance of all results was tested at P < 0.05.
Research ethics
For written questionnaire, the instruction was presented to the subjects and the consent form was obtained from the subjects who agreed to the instruction after sufficient explanation before the survey. For online questionnaire, the same instruction and agreement form as in the case of written questionnaire were presented and then the survey was proceeded only if the subject checked the ‘I agree’ box for agreement. It was clearly stated in the instruction and agreement form that the withdrawal of the agreement could be made after the participation in the study. Also, it was explained that data would not be used except for this study purpose, and related data would be stored in the Institutional Review Board (IRB) organization for 3 years after the termination of the study, and then all data would be discarded The study was performed after the deliberation and approval of Myongji University IRB (Deliberation No. MJU-2020-04-001-02).
RESULTS
General characteristics
The general characteristics of the subjects are shown in Table 1.
Table 1
General characteristics of the subjects
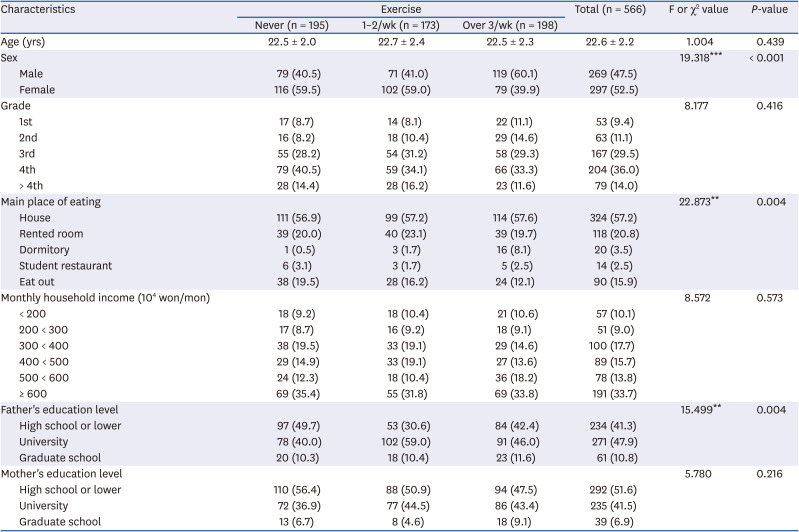
Among all subjects, 47.5% were male students and 52.5% were female students; the highest percentage was 36.0% for 4th grade, 57.2% for house as the main place of eating, 33.7% for over 6 million won as monthly household income, 47.9% for university graduate as father's education level, and 51.6% for high school or lower as mother's education level. According to the exercise status, the subjects were divided into no-exercise group (195 students), 1–2 times/week group (173 students), and over 3 times/week group (198 students), and their health-related lifestyle, dietary habits, and depression status were compared and analyzed. The sex distribution of the 3 groups according to exercise frequency was significantly different; the percentage of males in over 3 times/week group was significantly higher than those in 1–2 times/week group and no-exercise group (P < 0.001). The ratio of eating at home was higher in over 3 times/week group (57.6%) compared to 1–2 times/week group (57.2%) and no-exercise group (56.9%) (P < 0.01). The father’s education level was the highest as 49.7% in high school or lower in no-exercise group, and as 59.0% and 46.0% in university graduate, respectively, in 1–2 times/week group and over 3 times/week group, with significant differences. And age, grade, monthly household income, and mother's education level were not significantly different among 3 groups according to exercise habits.
The height, weight and BMI of the subjects are shown in Table 2.
Table 2
Height, weight and BMI by exercise frequency of the subjects
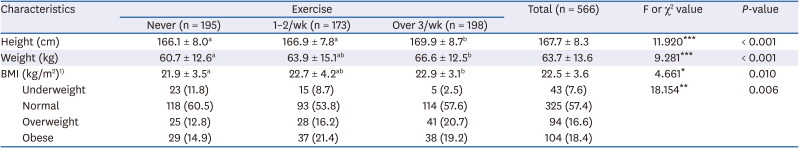
Values are presented as mean ± SD or number (%).
BMI, body mass index.
1)Underweight: < 18.5 kg/m2, Normal: 18.5–22.9kg/m2, Overweight: 23–24.9kg/m2, Obese: ≥ 25 kg/m2.
a,bValues with different superscripts are significantly different among groups by Scheffe's multiple range test.
*P < 0.05, **P < 0.01, ***P < 0.001 by analysis of variance test or χ2 test.
The average age was 22.6 years and the average height, weight, and BMI were 167.1 cm, 63.7 kg, and 22.5 kg/m2, respectively. Also, the height (P < 0.001), weight (P < 0.001), and BMI (P < 0.05) were significantly higher in over 3 times/week group compared to no-exercise group.
Health-related lifestyle by exercise frequency
The results for health-related lifestyle of the subjects according to exercise frequency are shown in Table 3.
Table 3
Health-related lifestyle by exercise frequency of the subjects
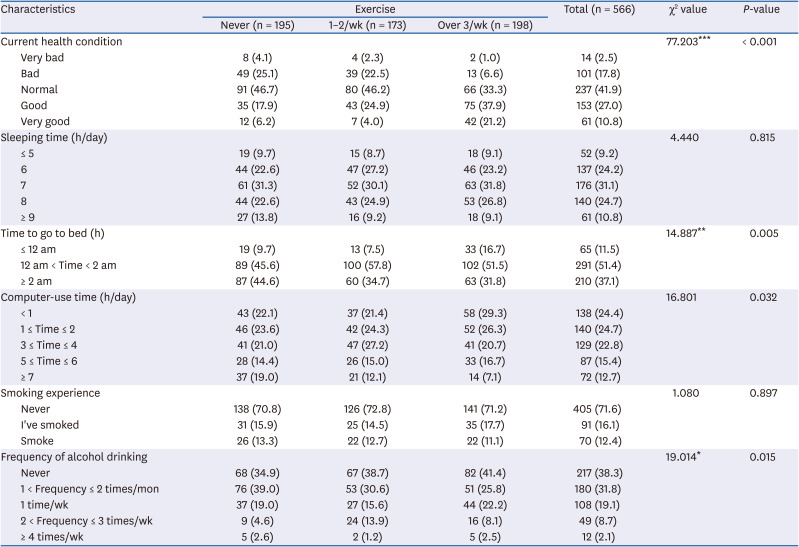
The highest percentage in the daily sleeping time was 31.1% as 7 hours and the computer-use time was 24.7% as 1–2 hours and non-smokers were 71.6%, without significant differences among 3 groups according to exercise frequency. The percentage of subjects who answered ‘good’ or ‘very good’ for subjective health condition was significantly high in the order of ‘over 3 times/week’ group (59.1%), ‘1–2 times/week’ group (34.5%), and ‘no-exercise’ group (25.0%) (P < 0.001). The percentage for the time to go to bed before 12 am was higher in ‘over 3 times/week’ group (16.7%) compared to ‘1–2 times/week’ group (7.5%) and ‘no-exercise’ group (9.7%), with significant differences (P < 0.01), and the percentage for no alcohol drinking was significantly higher in ‘over 3 times/week’ group (41.4%) compared to ‘1–2 times/week’ group (38.7%) and ‘no-exercise’ group (34.9%) (P < 0.05).
Dietary behaviors by exercise frequency
The results for dietary behavior of the subjects according to exercise frequency are shown in Table 4.
Table 4
Dietary behaviors by exercise frequency of the subjects
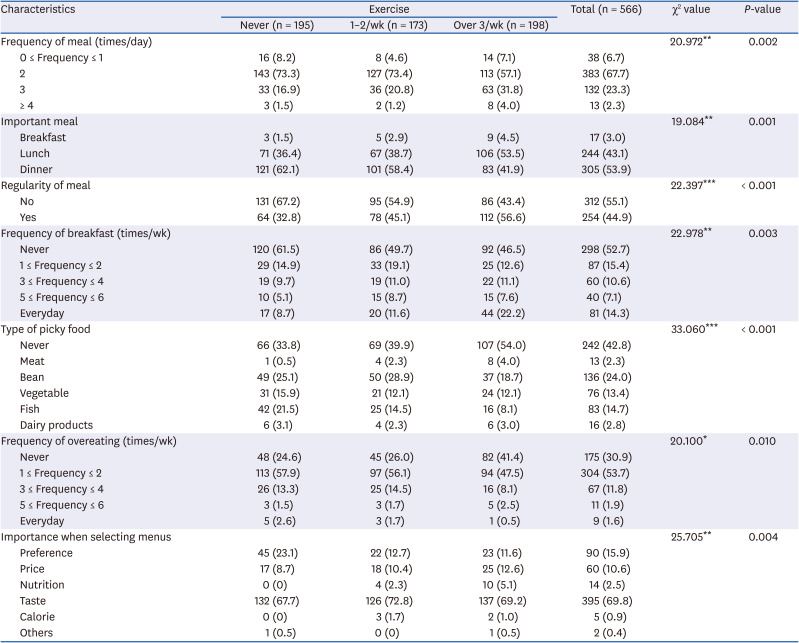
Among all subjects, the percentage for 3 meals a day was significantly higher in ‘over 3 times/week’ group (31.8%) compared to ‘1–2 times/week’ group (20.8%) and ‘no-exercise’ group (16.9%) (P < 0.01), and the percentage for lunch as important meal was the highest as 53.5% in ‘over 3 times/week’ group and the ratio for dinner as important meal was significantly higher in ‘no-exercise’ group (62.1%) and ‘1–2 times/week’ group (58.4%) (P < 0.01). The percentage for meal regularity was high as 56.6% in ‘over 3 times/week’ group and the ratio for irregular meals was significantly higher in ‘no-exercise’ group (67.2%) and ‘1–2 times/week’ group (54.9%) (P < 0.001). The percentage for eating breakfast everyday was significantly higher in ‘over 3 times/week’ group (22.2%) compared to ‘1–2 times/week’ group (11.6%) and ‘no-exercise’ group (8.7%) (P < 0.01), and the percentage for having no picky foods was significantly higher in ‘over 3 times/week’ group (54.0%) compared to ‘1–2 times/week’ group (39.9%) and ‘no-exercise’ group (33.8%) (P < 0.001). The percentage for overeating at 1–2 times/week was significantly higher in ‘no-exercise’ group (57.9%) compared to ‘1–2 times/week’ group (56.1%), over 3 times/week group (47.5%) (P < 0.05), and the percentage for the importance of taste when eating out was significantly higher in ‘1–2 times/week’ group (72.8%) compared to ‘over 3 times/week’ group (69.2%) and ‘no-exercise’ group (67.7%) (P < 0.01).
Dietary habits by exercise frequency
The results for dietary habits of the subjects according to exercise habits are shown in Table 5.
Table 5
Dietary habits by exercise frequency of the subjects
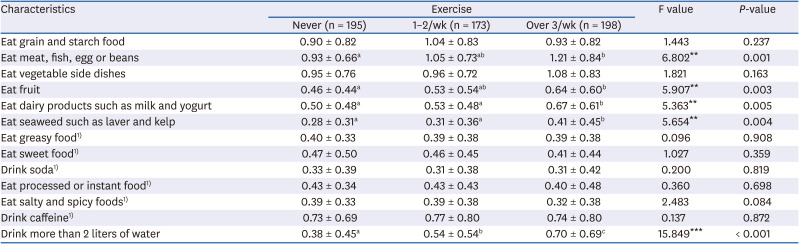
Among questions on dietary habits, ‘Eat meat, fish, egg or beans’ (P < 0.01) and ‘Eat fruit’ (P < 0.01) were significantly different between ‘no-exercise’ group and ‘over 3 times/week’ group, which were higher as 1.21 and 0.64, respectively, in ‘over 3 times/week’ group compared to 0.93 and 0.46, respectively, in ‘no-exercise’ group. ‘Eat dairy products such as milk and yogurt’ (P < 0.01) and ‘Eat seaweed such as laver and kelp’ (P < 0.01) were not correlated with ‘no-exercise’ group and ‘1–2 times/week’ group, but showed higher intakes as 0.67 and 0.41, respectively, in ‘over 3 times/week’ group compared to other 2 groups. ‘Drink more than 2 liters of water’ (P < 0.001) was 0.70 in ‘over 3 times/week’ group, which was significantly higher than 0.54 in ‘1–2 times/week’ group and 0.38 in ‘no-exercise’ group. On the other hand, among the questions of dietary habits, grains, vegetables, greasy foods, sweet foods, soda drinks, instant foods, salty foods, spicy foods, and caffeine intake did not show significant differences according to the frequency of exercise.
Depression score by exercise frequency
The results for depression of the subjects according to exercise frequency are shown in Table 6.
Table 6
Depression score by exercise frequency of the subjects
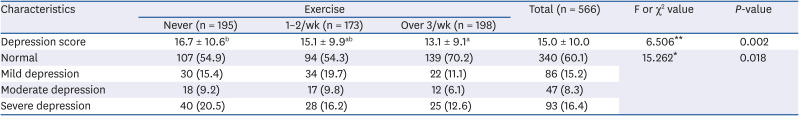
The average depression score of all subjects was 15.0, and the score was significantly lower as 13.1 in ‘over 3 times/week’ group compared to 15.1 in ‘1–2 times/week’ group and 16.7 in ‘no-exercise’ group (P < 0.01). Moderate depression and severe depression that need treatments were significantly lower in ‘over 3 times/week’ group (18.7%) compared to ‘1–2 times/week’ group (26.0%) and ‘no-exercise’ group (29.7%) (P < 0.05).
DISCUSSION
The study was performed to investigate health-related lifestyle, dietary habits, and depression according to exercise frequency to understand complex factors that affect effective health management. Thus, 566 college students (269 males and 297 females) in Seoul and Gyeonggi-do areas were divided into ‘no-exercise’ group, ‘1–2 times/week’ group, and ‘over 3 times/week’ group according to exercise frequency and then health-related lifestyle, dietary habits, and depression were evaluated as below.
The height, weight, and BMI of the subjects were significantly higher in ‘over 3 times/week’ group compared to ‘1–2 times/week’ group and ‘no-exercise’ group, which were consistent with the results from the study in middle-aged adults [12]. In the study, exercise groups had more males and no-exercise group had more females, suggesting the great effect of the difference in sex distribution. Also, the interest and experience on weight control were increased as BMI became higher [16], and the possible increase in exercise frequency can be considered. But, because this study was a cross-sectional survey at a certain point of time, it is difficult to explain the correlation to BMI according to exercise frequency.
The percentage of subjects who answered ‘good’ or ‘very good’ for subjective health condition was significantly high in the order of ‘over 3 times/week’ group, ‘1–2 times/week’ group, and ‘no-exercise’ group. This result was in the same context with that from the study in which the highest answer for the reason for exercise was health [17]. Our study was a survey study and thus it has some limitations to interpret through objective data. But, according to previous studies [1819], exercise practice demonstrated positive effects on health-related lifestyle and nutrient intakes, thus it is considered that the actual health status of exercise groups would be good.
For dietary behavior of the subjects in this study, the percentage of desirable dietary behavior was significantly higher in ‘over 3 times/week’ group compared to ‘no-exercise’ group, which was consistent with the results in the study on college students [20] in which the score for ‘meal regularity’ was higher in exercise group compared to control group and the score for ‘always eating snacks before bed when hungry’ was higher in ‘no-exercise’ group compared to control group. Therefore, exercise groups practice more desirable dietary behavior compared to no-exercise group. In other study [21], the percentage for skipping breakfast was low and that for eating milk and fruits everyday was high in adults with exercise practice, which was consisted with our results. Also, in another study [18], groups with increased muscle mass showed higher dietary behavior scores and better nutritional intakes compared to groups with decreased body weight, suggesting that exercise practice over 3 times per week can positively affect dietary habits and nutrient intakes in addition to desirable dietary behavior. Although it is difficult to suggest accurate levels of exercise because each subject has different type, intensity, and time of exercise, ‘over 3 times/week’ group showed proper dietary behavior including meal regularity and low rate of skipping breakfast in our study. Thus, exercise practice over 3 times per week can be positive to dietary behavior, and solutions for increasing participation in exercise in college students should be searched.
The score for ‘Eat meat, fish, egg or beans’ was significantly higher in ‘over 3 times/week’ group compared to ‘no-exercise’ group, meaning that exercise group consumed more proteins compared to no-exercise group. This result was similar to those with the protein intake twice higher than the recommended intake in group with increased muscle mass [20] and significantly higher animal protein intake in exercise group compared to control group [2223]. In our study, it was difficult to suggest accurate protein intake because the dietary intake was not measured using 24-hour recall method, but according to other studies [2425], it has been reported that high protein diets or protein supplementation were used for the increase of muscle mass and the recovery of damaged tissues in athletes and for the increase of muscle mass in college students. According to one study [26], the protein intake in college students exceeded the recommended daily protein intake. Thus, it is considered that nutrition education related to dietary behavior and habits including proper selection of health functional foods is necessary.
The ‘over 3 times/week’ exercise group had significantly higher scores in the items of ‘Drink more than 2 liters of water’, ‘Eat fruit’, and ‘Eat dairy products such as milk and yogurt’ than the non-exercise group. The results were consistent with the studies [2027] that reported the exercise group had significantly higher intake of water, fruits and dairy products than the non-exercise group. The score of ‘Eat vegetable side dishes’ did not show significant difference according to the frequency of exercise, and other studies [2127] also showed no significant difference in vegetable intake according to the frequency of exercise.
A study reported that the intake of dairy products and carbonated beverages was significantly higher in non-exercise group than exercise group [21], which was somewhat different from our study; but dietary habits of adding grains, greasy foods, and salt did not show significant differences according to exercise frequency, which was consistent with the results of our study. The score of ‘Eat seaweeds such as laver and sea mustard’ in this study was significantly higher in ‘over 3 times/week’ exercise group than in non-exercise group, but studies on seaweed intake according to exercise frequency are insufficient and follow-up studies are needed.
Regular exercise has been reported to highly improve cardiorespiratory endurance and fat-free lean body mass, and to influence the recovery of physical and mental health [282930]. In our study, the depression score was significantly lower in ‘over 3 times/week’ group compared to ‘1–2 times/week’ group and ‘no-exercise’ group. Depressive feeling was assessed using Korean version CES-D scale for objectivity and accuracy, which was translated and verified for reliability and validity [15]. In a study on depression of middle-aged men by the stage of exercise change [30], the level of depression and stress was lower as the exercise stage became higher. Also, it has been reported in the study on depression and the quality of life according to the physical activity type of the elderly [31] that the participation of the elderly in the exercise has positive influences in cognitive functions, depression, and the quality of life. Considering these results, the practice of regular exercise is thought useful in not only physical health but also mental health.
On the other hand, there are limitations on detailed investigation of the type or intensity of exercise in the classification of exercise, so there is a need for further studies to be carried out. In addition, this study selected students attending universities in Seoul and Gyeonggi area as subjects and it is difficult to generalize college students due to the representativeness of the samples. In subsequent studies, it is necessary to extract various samples from universities in each region of the country.
In conclusion, some college students in Seoul and Gyeonggi-do areas showed higher interest in health, maintained desirable dietary habits, and demonstrated lower depressive feelings as the exercise frequency per week increased. Thus, it is considered that combined intervention for exercise habits, proper dietary habits, and depression management is needed for effective health management. In the future, exercise intervention measures for exercise programs should be searched to prevent and alleviate depression, considering detailed exercise participation time and methods.
 XML Download