

 PDF
PDF Citation
 Print
Print


INTRODUCTION
Chronic insulin resistance and a progressive decline in the beta-cell mass and function are two of the key causes of type 2 diabetes. Therefore, an optimal beta-cell mass and function are essential for glucose homeostasis. On the other hand, impaired glucose homeostasis leads to the progression of diabetes. Increased free fatty acids (FFA), in particular saturated FFA (e.g., palmitate and stearate), have been suggested to trigger type 2 diabetes through the induction of beta-cell apoptosis and dysfunction [1]. The apoptotic process is initiated by the intrinsic or mitochondrial pathways. Therefore, the loss of mitochondrial homeostasis induces the release of pro-apoptotic factors, including cytochrome c, which activates the caspase proteins (caspase-3 and caspase-9) [2]. Permeabilization of the mitochondrial membrane and the release of cytochrome c are regulated tightly by a group of proteins called the Bcl2 protein family (anti-apoptotic members, Bcl2 and Bcl-XL; pro-apoptotic members, Bax, Bak, Bad, and Bim) [3]. The precise mechanisms of these proteins are well characterized. Their specific interactions and the ratio between anti- and pro-apoptotic proteins play important roles in determining the fate of cells exposed to apoptotic stimuli [4].
Several studies have reported the mechanisms of fatty acid-induced lipotoxicity in pancreatic beta cells during the development of type 2 diabetes. On the other hand, many proposed models, such as those including FFA receptors and the cell stress response, comprised of ceramide formation, lipid droplet formation, endoplasmic reticulum stress, mitochondrial dysfunction, and autophagy, continue to be investigated [5]. Therefore, the inhibition or prevention of these mechanisms is likely to play an important role in developing new anti-diabetic drugs that target beta cells.
Insects have been proposed as an alternative food source to curb the increasing global demand for protein consumption. Recently, pharmacological studies on the value of insects as an alternative food source have been reported. In Korea, silkworms (Bombyx mori) and locusts are readily accepted as general food items [67]. Prompted by new Korean legislation regarding insect industries in 2010, an edible insect industry now exists on a commercial scale, but it is currently in its initial stages. The Korean horn beetle (Allomyrina dichotoma), one of five insects permitted for food and feed in Korea, is used in traditional medicine for its anti-hepatofibrotic, anti-neoplastic, anti-obesity, and anti-diabetic effects [8]. The pharmacological properties have been primarily reported in beetle larva [9]. A recent study reported that the ethanol extract from Allomyrina dichotoma larva (ADL) mitigated hepatic insulin resistance in high-fat diet-induced diabetic mice and inhibited hepatic lipogenesis via activation of the AMPK signaling pathway, a mechanism associated with the effects elicited by A. dichotoma larva extract (ADLE). To determine if ADLE can act directly against lipotoxicity, this study examined the effects of beta-cell apoptosis and glucose-stimulated insulin secretion in palmitate-induced lipotoxicity, as well as its associated molecular mechanisms.
Go to : 
MATERIALS AND METHODS
Preparation of ADLE
After a week of fasting to remove feces, dried ADL were purchased from Yechun Bug's Land (Yecheon, Korea). ADL (200 g) was extracted, as previously reported [10], and the resulting concentrates were lyophilized to obtain ADLE. The calculated yield mean was 11.84% compared to the powdered sample. Finally, ADLE was dissolved in deionized water for subsequent experiments.
Cell culture and treatment
The rat insulinoma cell line, INS-1, was cultured in RPMI 1640 medium (Gibco, Paisley, UK) supplemented with 1% penicillin/streptomycin (Welgene, Daegu, Korea) and 10% fetal bovine serum (Gibco) in a 5% CO2 environment at 37°C. To induce lipotoxicity, sodium palmitate (Sigma, St. Louis, MO, USA) was conjugated with 5% bovine serum albumin (BSA; Sigma) at a 1:3 volume ratio. The INS-1 cells were exposed to palmitate (0.4 mM), with or without ADLE (0.5 mg/mL), for 24 h. The cell cytotoxicity on ADLE was determined by colorimetry using MTT (thiazolyl blue) (Duchefa Biochemie BV, Haarlem, Netherlands). The insoluble purple formazan products were dissolved in 2-propanol and measured at 540 nm (TECAN Group Ltd., Shanghai, China).
Animal experiments
Four-week-old C57BL/6J male mice were purchased from the Korea Research Institute Bioscience & Biotechnology (KRIBB, Daejeon, Korea). Male mice were chosen because they have been reported to be affected more by glucose intolerance than their female counterparts. Hence, they are employed more often in diet-induced obesity studies [11-13]. After one week of adaptation, the high-fat diet (HFD, 60% fat, D12492; Research Diets, New Brunswick, NJ, USA) and the normal fat diet (NFD, 4.5% fat, Purina, n = 6) were provided to the mice for 6 weeks. The HFD-fed mice were divided into 2 groups by a stratified randomized design based on the blood glucose level (200–250 mg/dL). The mice were then treated orally with ADLE (100 mg/kg/day, n = 8) [101415] or vehicle (distilled water, n = 8) once a day for 6 weeks using a flexible plastic feeding tube, as described elsewhere [10]. After the experimental period, all mice were euthanized after a 12-h fasting period, and the pancreatic tissue was either snap-frozen or processed for histopathology. All animal procedures were approved by the Eulji University Institutional Animal Care and Use Committee (EUIACUC-18-7).
Islet isolation
Male Sprague-Dawley rats (weighing 200 g) were purchased from KRIBB. The islets were isolated by infusing collagenase P into the pancreas (Roche Diagnostics, Indianapolis, IN, USA), followed by separation using a Histopaque 1077 gradient (Sigma) [16]. After isolation, the morphologically intact islets were selected under a stereomicroscope. The isolated islets were then treated with trypsin-ethylenediaminetetraacetic acid to obtain single cells before being seeded on a 96-well plate at a density of 5.0 × 10⁴ cells/well. After overnight stabilization, the cells were treated with palmitate, with or without ADLE, for 24 h.
Histology of pancreas tissues
Paraffin-embedded pancreas sections (4 μm) were fixed in acetone and deparaffinized, followed by staining with hematoxylin and eosin (H&E). For the immunohistochemical detection of insulin and 4-hydroxynonenal (4-HNE), the pancreas sections were incubated with the following primary antibodies: rabbit anti-insulin (1:1,000; ab63820; Abcam, Cambridge, UK), and rabbit anti-4-HNE (1:1,000, ab46545; Abcam), followed by treatment with HRP-conjugated secondary antibody (Bio-Rad, Marnes-la-Coquette, France). Apoptosis was measured by staining sections with terminal deoxynucleotidyl transferase dUTP nick end labeling (TUNEL) according to the manufacturer's instructions using an in situ cell death detection kit (Roche Diagnostics GmbH, Mannheim, Germany). The TUNEL-positive cells in randomly selected islets of each mouse were counted under a microscope. The pancreas sections were observed using an Olympus BX61 microscope equipped with an Olympus DP70 digital camera (Olympus Co., Tokyo, Japan). The beta-cell area (pixels) on insulin-stained sections was quantified using the Image J software (National Institutes of Health, Bethesda, MD, USA). The insulin-positive area of all islets was measured, and the area was calculated by dividing the number of islets.
Assay for apoptotic cell death
The levels of the cytoplasmic histone-associated DNA fragments were determined using the Cell Death Detection enzyme-linked immunosorbent assay (ELISA) Plus kit (Roche Molecular Biochemicals, Mannheim, Germany). The cells were washed with Dulbecco's phosphate-buffered saline (DPBS) and lysed by adding the buffer supplied with the kit. Following centrifugation (200 × g, 10 min), the supernatant containing the cytoplasmic fraction was used in ELISA and processed according to the manufacturer's protocol. After incubating with a peroxidase substrate for 5 min, the absorbances at 405 and 490 nm (reference wavelength) were measured using a microplate ELISA reader (Tecan).
Cellular lipids measurement
The lipid contents in the cell were measured using the method reported by Folch et al. [17]. Briefly, INS-1 cells in 6-well plates were digested with trypsin, and the lysates were centrifuged at 72 × g for 3 min. A chloroform/methanol mixture (2:1 v/v) was then added. A 0.1 M NaCl was added to each group. The mixture was centrifuged at 1,530 × g for 10 min, and the bottom layer was dried. The 1% Triton X-100-ethanol was added, and the concentration of lipid was measured using a TG-S (triglyceride) kit (Asan Pharmaceutical Co., Seoul, Korea) according to the manufacturer's instructions. The data were normalized for differences by the protein content of the cell.
Measurement of insulin secretion
The plasma insulin levels in each group were measured after fasting the mice overnight before collecting blood samples from the tail vein (0 min). Subsequently, a glucose solution (2 g/kg) dissolved in phosphate-buffered saline (PBS) was injected intraperitoneally. Another blood sample was collected at 30 min. The levels of insulin secretion in the ADLE-treated cells were measured. INS-1 cells were plated (2.0 × 10⁵ cells/well) in 24-well plates. Glucose-stimulated insulin secretion (GSIS) within the cells was then performed as follows. The cells were equilibrated overnight in RPMI 1640 medium containing 5.0 mM glucose. The cells were washed with Krebs–Ringer bicarbonate (KRB) buffer (119 mM NaCl, 4.74 mM KCl, 2.54 mM CaCl2, 1.19 mM KH2PO4, 25 mM MgHCO3, and 10 mM HEPES at pH 7.4, containing 0.2% BSA) and pre-incubated for 2 h in the same buffer. Insulin secretion was stimulated by treating the cells with KRB buffer containing 3.3 mM or 25 mM glucose for 2 h at 37°C. The supernatants were collected, and the amount of insulin released was measured using an ELISA kit according to the manufacturer's protocol (Alpco Diagnostics, Windham, NH, USA). The insulin content was normalized to the protein levels extracted from the cells.
Measurement of the nitrite content
The nitrite concentration in the extracellular space was measured using a colorimetric assay to determine the levels of nitric oxide (NO) production. The cells at a density of 2.5 × 10⁴ cell/well were cultured in palmitate with or without ADLE for 24 h. The levels of NO production in the medium were measured after incubating the cells with an equal volume of Griess reagent (1% sulfanilamide/0.1% N-(1-naphthyl)-ethylenediamine dihydrochloride/2.5% H3PO4) at 23–25°C for 10 min. The absorbance at 540 nm was measured using a microplate reader (TECAN).
Measurement of intracellular reactive oxygen stress
The levels of intracellular reactive oxygen species (ROS) were assessed using an oxidative-sensitive 2′, 7′-dichloro dihydrofluorescein diacetate (DCFH-DA; Molecular Probes, Thermo Fisher Scientific, Waltham, MA, USA) fluorescent probe. The cells at a density of 2.5 × 10⁴ cells/well were cultured in palmitate with or without ADLE for 24 h. The cells were incubated with 10 μM DCFH-DA in the dark for 30 min. The fluorescence of dichlorofluorescein (DCF) in the cells was detected using a fluorescence spectrophotometer with excitation and emission at 488 nm and 535 nm, respectively.
Measurement of cellular ATP
INS-1 cells at a density of 2.5 × 10⁴ cell/well were cultured in palmitate in 96 opaque black-well plates for 24 h. The adenosine triphosphate (ATP) levels in the cells were measured using a Perkin-Elmer ATPLite system according to the manufacturer's instructions.
Western blot analysis
The cell lysates were homogenized in mammalian protein extraction buffer (Sigma). The resulting lysates were centrifuged at 12,000 rpm, and 4°C for 15 min, and the protein contents were measured using a protein-assay dye reagent concentrate (Bio-Rad Laboratories, Hercules, CA, USA). Subsequently, 10–15% sodium dodecyl sulphate-polyacrylamide gel electrophoresis was performed, followed by transfer onto nitrocellulose blotting membranes (Amersham, GE Healthcare Life Science, Germany). The antibodies used for immunoblotting are as follows: Bax rabbit mAb (1:1,000; Cell Signaling Technology), Bcl2 (D17C4) rabbit mAb (1:1,000; Cell Signaling Technology), inducible nitric oxide synthase (iNOS; NOS2) (1:500; Santa Cruz Biotechnology, Santa Cruz, CA, USA), AMPKα (D63G4) rabbit mAb (1:1,000; Cell Signaling Technology), Phospho-AMPKα (Thr172) (D4D6D) rabbit mAb (1:1,000; Cell Signaling Technology), caspase-3 rabbit mAb (1:1,000; Cell Signaling Technology), cleaved caspase-3 (Asp175) (5A1E) rabbit mAb (1:1,000; Cell Signaling Technology), PARP (46D11) rabbit mAb (1:1,000; Cell Signaling Technology), and β-actin (13E5) rabbit mAb (1:2,500; Cell Signaling Technology). The protein bands were visualized using an enhanced chemiluminescence method with an ELC kit (Millipore, Billerica, MA, USA) and were quantified using Quantity 1 v.4.6.7 (Bio-Rad).
Quantitative real-time polymerase chain reaction (qRT-PCR)
The total RNA was extracted from the cultured cells using Trizol reagent (Invitrogen, Grand Island, NY, USA), and cDNA was synthesized using a Primescript™ 1st strand cDNA synthesis kit (Takara Bio Inc., Shiga, Japan). mRNA expression was measured by qRT-PCR using SYBR Premix Ex Taq II ROX plus (Takara Bio Inc.) and an ABI real-time PCR system (Applied Biosystem Inc., Forster City, CA, USA). Table 1 lists the gene-specific primers. Cyclophilin was used as the internal control. PCR was carried out for 40 cycles (10 min at 90°C, 15 s at 95°C, and 1 min at 60°C). The relative amounts of mRNAs were calculated using the threshold crossing points (CT) based on the 2−ΔΔCt method.
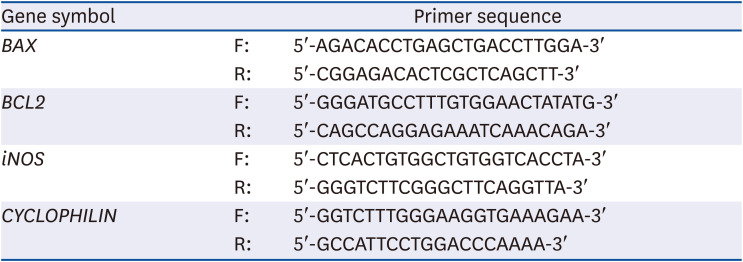
Table 1
Primer sequences for real-time PCR
PCR, polymerase chain reaction; BAX, Bcl-2-associated X; BCL2, B cell lymphoma 2; iNOS, inducible nitric oxide synthase.
![]()
Statistical analysis
All data are presented as the mean ± SD. Statistical analyses were performed using SPSS 20.0 software (IBM SPSS ver. 20.0.0 for Windows; IBM Co., Armonk, NY, USA). The significance of the differences among the groups was analyzed using one-way or two-way analysis of variance (ANOVA) with Fisher's Least Significant Difference (LSD) comparisons test. P values < 0.05 were considered significant.
Go to :
RESULTS
ADLE reduces oxidative stress and apoptosis in the islets from HFD-induced diabetic mice
A previous study confirmed that the fasting blood glucose level and glucose intolerance in HFD-induced diabetic mice was reduced significantly by an ADLE treatment [10]. Therefore, this study investigated whether changes in the beta-cell morphology occurred or if any associated dysfunction was present in these groups using immunohistochemistry (Fig. 1A). An examination of the pancreatic islet morphology showed that the size of the islet boundary was expanded significantly with an irregular shape in the HFD group compared to the NFD group, and was improved substantially by ADLE. Quantitative analysis of the insulin-positive cells showed that the beta-cell area increased due to the HFD, whereas the ADLE treatment reduced the beta-cell area (Fig. 1B). The changes in the oxidative stress related-factor in the islets from HFD- and ADLE-treated mice were investigated by immunostaining with an antibody against 4-HNE, a marker of oxidative stress [1819]. The level of 4-HNE (brown color) was observed in the islets of the HFD-fed mice compared to the NFD group. The ADLE-treated group significantly attenuated the HFD-induced oxidative stress (Fig. 1C). As shown in Fig. 1D, a significant increase in the number of TUNEL-positive cells in the pancreas islets of the HFD-fed mice was observed compared to the NFD-fed mice (P < 0.01), and the number was reduced by the ADLE treatment (P < 0.01 vs. HFD group, Fig. 1D and E). The plasma insulin levels were also examined upon fasting (0 min) and after 30 min of glucose loading in these groups. Insulin release upon fasting did not differ significantly between the three groups. On the other hand, the HFD+ADLE group showed a significant increase in the circulating insulin levels compared to the HFD group at 30 min after the glucose loading (Fig. 1F).
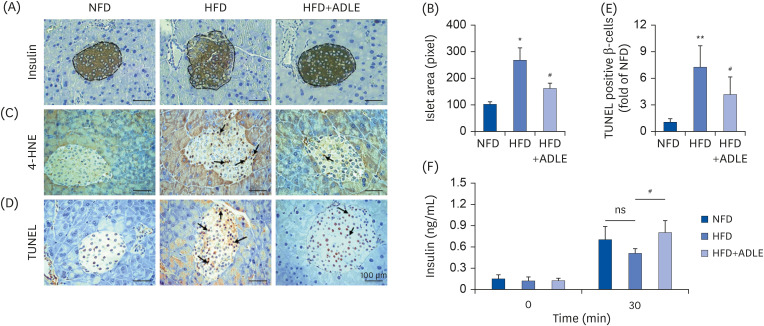 | Fig. 1ADLE reduces oxidative stress and apoptosis in the islets from high fat diet-induced diabetic C57BL/6J mice. (A) Representative photomicrographs of immune-staining for insulin (brown color) in pancreatic islets. (B) Measurement of the density in the islet area (pixel). (C) Representative photomicrographs of mice pancreatic sections stained with the 4-HNE antibody. (D) Representative photomicrographs of TUNEL-positive cells in pancreatic sections. (E) Histogram representing the quantitative analysis of TUNEL-positive β cells per islet in each experimental group. (F) Plasma serum level at 0 and 30 min after glucose injection (2 g/kg) collected for insulin detection with ELISA (magnification: ×200). Data are presented as the mean ± SD (n = 5–8). The arrows indicated the 4-HNE and TUNEL stained cells. The significance was evaluated using ANOVA with the LSD comparisons test.ADLE, Allomyrina dichotoma larva extract; NFD, normal fat diet group; HFD, high-fat diet group; HFD+ADLE, high-fat diet plus 100 mg/kg/day ADLE; 4-HNE, 4-hydroxynonenal; TUNEL, terminal deoxynucleotidyl transferase dUTP nick end labeling; ANOVA, analysis of variance; LSD, Least Significant Difference; ns, no significance.
*P < 0.05 and **P < 0.01 versus NFD; #P < 0.05 versus HFD.
|
ADLE attenuates cytotoxicity and lipid accumulation in palmitate-stimulated INS-1 cells
The molecular mechanism associated with the recovery of the beta-cell mass and improved insulin level was determined by assessing the cytotoxicity and intracellular lipid accumulation following treatment with ADLE using rat-derived beta cells. As shown in Fig. 2A, the INS-1 cells exhibited cytotoxicity (P < 0.001) at a concentration of 1.0 or 2.0 mg/mL ADLE compared to the untreated control. Therefore, this study examined whether ADLE protects INS-1 cells and isolated islets against palmitate-induced cytotoxicity. To this end, the cells were treated with palmitate with or without ADLE (0.1, 0.25, and 0.5 mg/mL). Treatment of INS-1 cells with palmitate decreased the percentage of viable cells to 55.4% compared to the control. In contrast, treatment with ADLE at 0.5 mg/mL in the presence of palmitate increased the cell viability to approximately 71.2% (P < 0.001; Fig. 2B). Similarly, in isolated islets, ADLE at 0.5 mg/mL significantly increased the cell viability compared to palmitate treatment alone (P < 0.05; Fig. 2C). The palmitate treatment also resulted in approximately 2.2-fold higher intracellular TG levels than the untreated controls, which was attenuated by the ADLE co-treatment. The ADLE only treatment did not affect the accumulation of triglycerides in the cells (Fig. 2D).
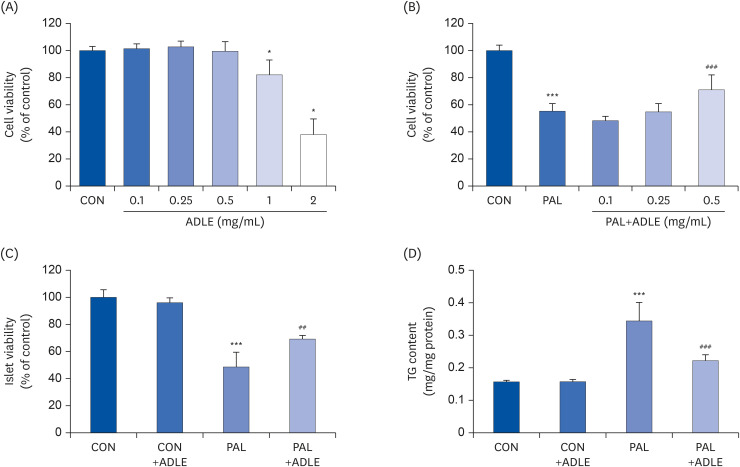 | Fig. 2ADLE attenuates cytotoxicity and lipid accumulation in palmitate-stimulated INS-1 cells. (A) Effects of ADLE on the proliferation of INS-1 cells. The cells were incubated in media containing various concentrations of ADLE (0.1, 0.25, 0.5, 1.0, and 2.0 mg/mL) for 24 h. The cell viability was measured using an MTT assay. (B) INS-1 cells were treated with 0.4 mM PAL with or without 0.1, 0.25, and 0.5 mg/mL of ADLE. (C) Rat pancreatic islets were treated with 0.4 mM PAL with or without 0.5 mg/mL of ADLE. The cell viability at 24 h was determined using an MTT assay. (D) The intracellular lipid levels were measured using a triglyceride assay kit. The values are presented as the mean ± SD (n = 3–5). The significance was evaluated using ANOVA with the LSD comparisons test.ADLE, Allomyrina dichotoma larva extract; CON, untreated control; PAL, 0.4 mM palmitate only; CON+ADLE, untreated control plus 0.5 mg/mL ADLE; PAL+ADLE, 0.4 mM palmitate plus 0.5 mg/mL ADLE; MTT, methyl thiazolyl diphenyl tetrazolium; TG, triglyceride; ANOVA, analysis of variance; LSD, Least Significant Difference; ns, no significance.
*P < 0.05 and ***P < 0.001 versus CON; ##P < 0.01 and ###P < 0.001 versus PAL.
|
ADLE treatment partially improves insulin secretion via AMPK activation in INS-1 cells
To determine if the ADLE treatment reduced the beta-cell dysfunction induced by palmitate, the levels of insulin secretion were measured in the presence of 3 and 25 mM glucose following a treatment with palmitate with or without ADLE. Insulin secretion increased approximately two-fold with 25 mM glucose compared to 3 mM glucose in the control cells. Insulin secretion after treatment with 3 and 25 mM glucose was significantly lower in the palmitate-treated cells than the untreated control cells. On the other hand, treatment with ADLE (P < 0.05 and P < 0.001) enhanced the insulin secretion significantly compared to palmitate (Fig. 3A). Previously, the administration of ADLE could increase the AMP-activated kinase (AMPK) activity in the liver of HFD-fed mice [10]. Therefore, the effects of ADLE on AMPK activation were investigated in palmitate-treated INS-1 cells with or without ADLE. The results showed that palmitate reduced the expression of phosphorylated AMPK at Thr 172 (p-AMPK) (P = 0.003). In contrast, pretreatment with ADLE improved AMPK phosphorylation in palmitate-treated cells (P = 0.04), particularly at 17 h (Fig. 3B).
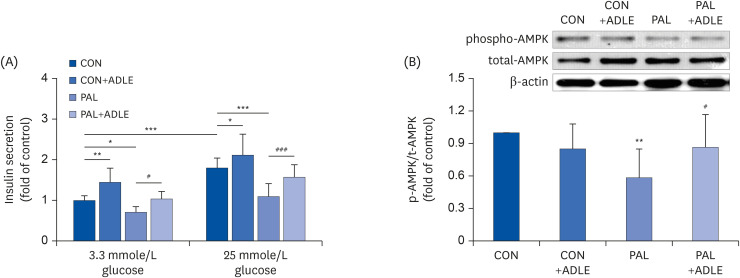 | Fig. 3ADLE treatment partially improves insulin secretion via AMPK activation in INS-1 cells. (A) Insulin release was measured after 2 h of incubation in either 3.3 mmol/L glucose or 25 mmol/L glucose, as described in materials and methods. (B) The expression levels of total-AMPK and phospho-AMPK were measured by western blot analysis. β-actin was used as the loading control. The bands were quantified using Quantity 1 software. The data are presented as the mean ± SD (n = 3–5). The significance was evaluated using an ANOVA with the LSD comparisons test.ADLE, Allomyrina dichotoma larva extract; CON, untreated control; PAL, 0.4 mM palmitate only; CON+ADLE, untreated control plus 0.5 mg/mL ADLE; PAL+ADLE, 0.4 mM palmitate plus 0.5 mg/mL ADLE; AMPK, AMP-activated protein kinase; ANOVA, analysis of variance; LSD, Least Significant Difference.
*P < 0.05, **P < 0.01, and ***P < 0.001 versus CON, #P < 0.05 and ###P < 0.001 versus PAL.
|
ADLE treatment reduces palmitate-induced apoptosis in INS-1 cells
Because palmitate induces apoptosis in pancreatic beta cells [2021], the effects of ADLE on INS-1 cells were investigated based on the changes in the expression of apoptosis-related proteins. Western blot analysis revealed the cleaved form of caspase-3 and poly-(ADP-ribose)-polymerase (PARP) after the palmitate treatment (P = 0.02, Fig. 4A), but their expression was reduced significantly after the ADLE treatment (P = 0.017, Fig. 4B).
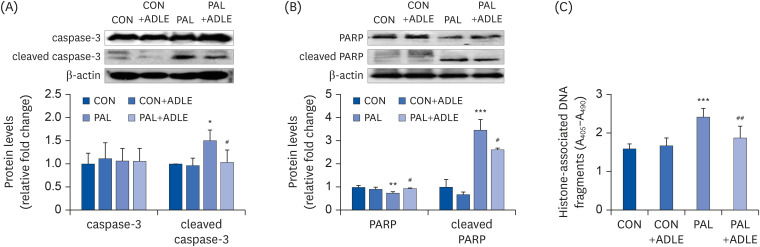 | Fig. 4ADLE treatment reduces the expression level of the apoptosis-associated proteins and DNA fragmentation in palmitate-treated INS-1 cells. (A) INS-1 cells were treated with 0.5 mg/mL ADLE and 0.4 mM PAL. The cells were evaluated 24 h after treatment. The whole protein lysates were prepared using an extraction buffer. The levels of caspase-3 (A) and PARP (B) were determined by Western blot analysis with anti-caspase-3 and anti-PARP antibodies, respectively. (C) Fragmented DNA was then measured using a Cell Death Detection ELISA kit. The data are presented as the mean ± SD (n = 3–5). β-actin was used as the loading control. The bands were quantified using Quantity 1 software. Significance was evaluated using an ANOVA with an LSD comparisons test.ADLE, Allomyrina dichotoma larva extract; CON, untreated control; PAL, 0.4 mM palmitate only; CON+ADLE, untreated control plus 0.5 mg/mL ADLE; PAL+ADLE, 0.4 mM palmitate plus 0.5 mg/mL ADLE; PARP, poly (ADP-ribose) polymerase; ELISA, enzyme-linked immunosorbent assay; ANOVA, analysis of variance; LSD, Least Significant Difference.
*P < 0.05, **P < 0.01, and ***P < 0.001 versus CON, #P < 0.05 and ##P < 0.01 versus PAL.
|
The nucleosomal release was measured for the quantitative analysis of apoptosis. Palmitate-treated cells showed significantly higher nucleosome levels in the cytoplasm due to DNA degradation than the control (P < 0.001). The ADLE inhibited the palmitate-mediated nucleosomal release significantly (P < 0.01) (Fig. 4C). Apoptosis signaling occurs by downregulating Bcl2 expression and upregulating pro-apoptotic Bax expression. As a result, the ratio of the Bax/Bcl2 mRNA levels was increased two-fold in the palmitate-treated cells than the control (P < 0.001). ADLE reduced the mRNA levels significantly (P < 0.01) compared to palmitate (Fig. 5A). Moreover, the Bax/Bcl2 protein ratio was increased 1.9-fold in the palmitate-treated cells compared to the control (P < 0.001). ADLE inhibited the increase in this ratio induced by palmitate significantly (P < 0.01) (Fig. 5B).
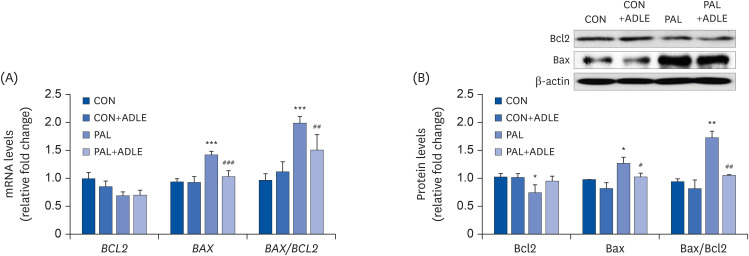 | Fig. 5ADLE treatment reduces the Bax/Bcl2 ratio in palmitate-treated INS-1 cells. (A) INS-1 cells were treated with 0.4 mM PAL in the absence or presence of 0.5 mg/mL ADLE. The cells were harvested after 24 h of treatment. The mRNA levels of BCL2 and BAX proteins were analyzed by qRT-PCR. The mRNA levels were normalized with those of cyclophilin. (B) The cells were treated as described in (A) and harvested after a 24 h treatment. The levels of Bcl2 and Bax expression were measured by western blot analysis. β-actin was used as the loading control. The bands were quantified using Quantity 1 software. The values represent the mean ± SD (n = 3–5). The significance was evaluated using an ANOVA with the LSD comparisons test.ADLE, Allomyrina dichotoma larva extract; BCL2, B cell lymphoma 2; BAX, Bcl-2-associated X; CON, untreated control; PAL, 0.4 mM palmitate only; qRT-PCR, quantitative real-time polymerase chain reaction; CON+ADLE, untreated control plus 0.5 mg/mL ADLE; PAL+ADLE, 0.4 mM palmitate plus 0.5 mg/mL ADLE; ANOVA, analysis of variance; LSD, Least Significant Difference.
*P < 0.05, **P < 0.01, and ***P < 0.001 versus CON. #P < 0.05, ##P < 0.01, and ###P < 0.001 versus PAL.
|
ADLE treatment partially prevents ROS generation and restores the ATP levels reduced by palmitate in INS-1 cells
Chronic exposure to palmitate impairs glucose-stimulated insulin secretion with increased ROS production in beta cells [22]. Therefore, to determine if the levels of ROS in palmitate-induced cells were reduced by ADLE treatment, the intracellular ROS levels were measured based on the DCF fluorescence intensity after a treatment with palmitate in the presence or absence of ADLE. Exposure to palmitate alone induced a significant increase in the DCF fluorescence levels, which was prevented (P < 0.001) by exposure to ADLE (Fig. 6A). A mitochondrial dysfunction results in an abnormal function and the apoptosis of pancreatic beta cells [23]. The intracellular ATP levels in the palmitate-treated cells with or without ADLE were measured to determine if the mitochondrial function is related to the anti-apoptotic effects of ADLE. As shown in Fig. 6B, incubating the INS-1 cells with palmitate for 24 h decreased the intracellular ATP levels by 60% compared to the control cells (P < 0.001). On the other hand, a combination of palmitate and ADLE treatment increased the ATP levels by 20% compared to the palmitate only treated cells (P < 0.05).
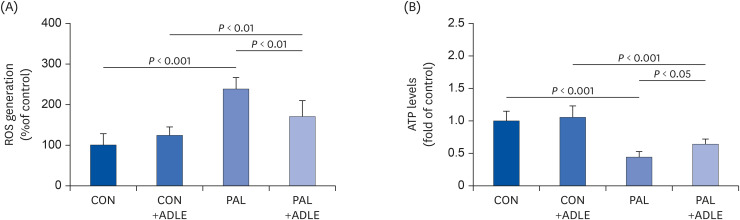 | Fig. 6ADLE treatment partially prevents ROS generation and restores the ATP levels reduced by palmitate in INS-1 cells. INS-1 cells were treated with 0.4 mM PAL in the absence or presence of 0.5 mg/mL ADLE. The cells were harvested, and (A) ROS and (B) intracellular ATP levels were examined. Data represent the mean ± SD (n = 3–5). Significance was evaluated using an ANOVA with the LSD comparisons test.ADLE, Allomyrina dichotoma larva extract; CON, untreated control; PAL, 0.4 mM palmitate only; CON+ADLE, untreated control plus 0.5 mg/mL ADLE; PAL+ADLE, 0.4 mM palmitate plus 0.5 mg/mL ADLE; ROS, reactive oxygen species; ATP, adenosine triphosphate; ANOVA, analysis of variance; LSD, Least Significant Difference.
|
ADLE treatment reduces palmitate-induced iNOS expression and nitrite in INS-1 cells
The inflammatory response of beta cells stimulates the expression of inducible nitric oxide synthase and the overproduction of NO, resulting in cell damage [24]. Therefore, the nitrite concentration and the iNOS mRNA and protein levels in the supernatant of the culture medium and cell lysates were measured. As shown in Fig. 7A, incubation of INS-1 cells with palmitate for 24 h resulted in a 21-fold (P < 0.001) increase in nitrite compared to the control cells. Similarly, ADLE reduced the nitrite concentration significantly (P < 0.01). A significant increase (P < 0.001) in the mRNA and protein expression levels of iNOS in INS-1 cells incubated with palmitate was observed, but this increase was suppressed significantly (P < 0.01) by the ADLE treatment (Fig. 7B and C). The quantitative data also showed that iNOS/β-actin was significantly higher in palmitate-treated cells than the control cells, but these were inhibited by the ADLE treatment (Fig. 7D).
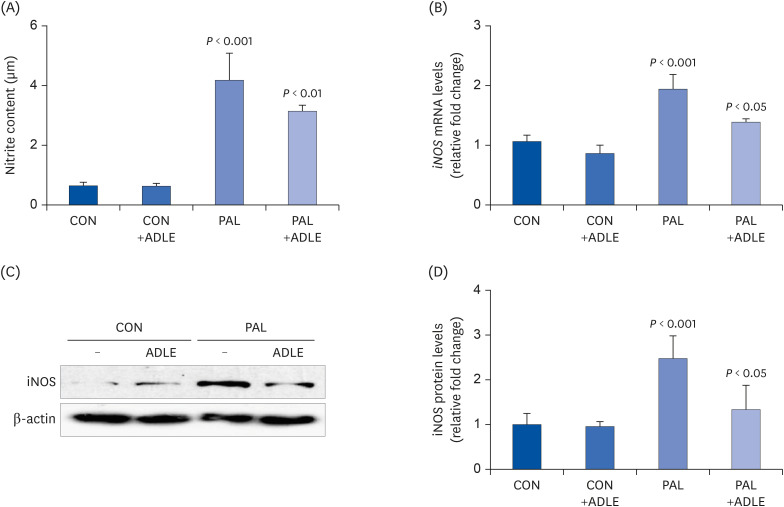 | Fig. 7ADLE treatment reduces palmitate-induced iNOS expression and nitrite in INS-1 cells. INS-1 cells were treated with 0.4 mM PAL in the absence or presence of 0.5 mg/mL ADLE. The cells were harvested after 16 h of treatment. (A) The nitrite content was measured in the cell-free culture supernatants. (B) The mRNA levels of iNOS were analyzed by quantitative RT-PCR. The mRNA levels were normalized to those of cyclophilin. (C, D) The iNOS protein level was determined by western blotting. The Western blotting data are representative of three independent experiments. The bands were quantified using Quantity 1 software. The significance was evaluated using an ANOVA with the LSD comparisons test. The data represent mean ± SD (n = 3–5).ADLE, Allomyrina dichotoma larva extract; CON, untreated control; PAL, 0.4 mM palmitate only; CON+ADLE, untreated control plus 0.5 mg/mL ADLE; PAL+ADLE, 0.4 mM palmitate plus 0.5 mg/mL ADLE; iNOS, inducible nitric oxide synthase; ANOVA, analysis of variance; LSD, Least Significant Difference.
|
Go to :
DISCUSSION
Inadequate insulin secretion causes insulin resistance, which is a key issue in the development of diabetes [25]. Numerous studies have reported that acute FFA exposure increases insulin release in pancreatic beta cells. On the other hand, prolonged FFA exposure causes disturbances in lipid metabolism regulation, contributing to decreased beta-cell function and viability (lipotoxicity) [26-28]. A previous study reported that ADLE ameliorates hepatic insulin resistance by inhibiting hepatic lipogenesis through the AMPK signaling pathway in HFD-induced mice [10]. In that study, glucose tolerance was also improved in the ADLE-treated mice, suggesting that ADLE has a positive effect on pancreatic beta cells. Therefore, this study examined the direct effect of ADLE on pancreatic islets compensation, insulin secretion, and beta-cell apoptosis in HFD-treated mice and palmitate-treated INS-1 cells. Under insulin-resistant conditions, an increase in beta-cell mass compensates for the increased demand in the maintenance of normal glucose homeostasis [29]. In the present study, the results obtained both in vivo and in vitro show that the beta-cell function and number of cells increase markedly in response to the ADLE treatment, which correlates with the results of metformin used as a type 2 diabetes therapy [30]. The prolonged exposure of isolated islets or insulin-secreting cells to elevated FAA levels is associated with the inhibition of GSIS and the induction of cell death by apoptosis [5].
Pepin et al. [31] reported that the p-AMPK/AMPK ratio decreased in the islets of diabetic mice compared to normal mice, both under low and high glucose conditions. In the present study, the AMPK activation was decreased in palmitate-treated cells, while AMPK phosphorylation was induced by a pretreatment with ADLE. These results suggest that the activation of AMPK by ADLE is one mechanism used to protect pancreatic islet cells from lipotoxicity and improve insulin secretion. Compared to the untreated cells, cells cultured for seven days in the presence of high levels of FFA exhibit the hallmarks of apoptosis, including DNA fragmentation, increased caspase activity, and increased expression of apoptotic genes [24]. In this study, the expression of apoptotic markers in palmitate-treated cells was increased. Furthermore, the ADLE treatment attenuated cleaved PARP, cleaved caspase-3, and the Bax/Bcl2 ratio. These results are consistent with those observed in the islets of HFD-induced diabetic mice treated with ADLE, which exhibited reduced oxidative stress and apoptotic cell death. Therefore, the insulin secretion capacity, and the anti-apoptotic effect, might be mechanisms through which ADLE induces a significant decrease in glucose tolerance, as observed in the HFD-treated mice.
The mitochondria play an essential role in ATP synthesis, Ca2+ homeostasis, and the integration of apoptotic signals [32]. In beta cells, glucose sensing and subsequent insulin secretion were controlled by the mitochondrial metabolism [33]. ADLE improved GSIS and inhibited the oxidative stress-mediated pathway, as shown by the decrease in ROS generation and the increase in ATP content in the mitochondria. Therefore, the ADLE-induced mitochondrial functional recovery contributes to the anti-apoptotic effects and the recovery of the insulin secretory capacity of ADLE against lipotoxicity.
NO is a mediator of FFA-induced beta-cell dysfunction [34]. Therefore, this study investigated whether ADLE regulates NO. As expected, FFA (palmitate) induced NO production, which was ameliorated after a treatment with ADLE. Excessive NO production derived from iNOS has been associated with beta-cell dysfunctions by inflammation [353637]. Previously, ADLE had anti-inflammatory activity in lipopolysaccharide (LPS)-induced Caco-2 cells by decreasing NO production and inflammatory cytokines [38]. In this study, ADLE reduced ROS production in palmitate-treated INS-1 cells, inhibiting the production of NO via a reduction in the iNOS protein levels. These findings suggest that ADLE plays an important role in beta-cell lipotoxicity through ROS/NO production.
Thirteen fractionations were obtained to elucidate the bioactive compounds of ADLE. A specific fraction exhibited low 2,2-diphenyl-1-picrylhydrazyl (DPPH) scavenging activity (data not shown), where DPPH acts as a free radical scavenger and has antioxidant activity. An attempt was made to isolate the compound with high antioxidant effects. Im et al. [14] also reported that ADLE increases the level of antioxidants enzymes, such as superoxide dismutase (SOD) and catalase (CAT), to provide protection against ROS generation induced by ultraviolet B (UVB) exposure in hairless mice. Therefore, a decrease in the levels of oxidative stress could be a key mechanism in ameliorating the anti-apoptotic effect, but more detailed studies will be needed to characterize the mechanisms of ADLE. Moreover, determining the circulating levels of several ADLE components in the mice will help elucidate how ADLE interacts with the body while also providing insights into its applicability for the development of food or drugs to treat glucose intolerance. On the other hand, studies must first be conducted to characterize the anti-apoptotic effects in human subjects, as well as determine the optimal doses and their tolerability in humans.
In conclusion, ADLE inhibits lipoapoptosis in beta cells by reducing the levels of NO and oxidative stress. Therefore, it can be used to help maintain beta-cell survival and preserve the capacity of insulin secretion.
Go to :
 XML Download