

 PDF
PDF Citation
 Print
Print


INTRODUCTION
Coronavirus disease 2019 (COVID-19), caused by the severe acute respiratory syndrome coronavirus 2 (SARS-CoV-2), has spread rapidly worldwide since it was first identified in Wuhan, China in 2019. Although most COVID-19 patients have mild clinical manifestations, about 5% progress to critical status with respiratory failure and/or multi-organ failure.1 A previous study suggested that the sinonasal tract may play a significant role in the infection, transmission, and pathogenesis of the SARS-CoV-2.2 In addition, nasal swabs from symptomatic patients with COVID-19 had higher viral loads than throat swabs.3 As the olfactory sensory neurons directly contact the environment in the nasal cavity, these neurons may be vulnerable to the exposure of the high viral load of SARS-CoV-2 in the nasal cavity.
Olfactory and gustatory dysfunction are frequently reported in patients with COVID-19 and are noted as significant symptoms in COVID-19. The prevalence of olfactory and gustatory dysfunction in previous studies varies from 5.1% to 98.3% and 5.6% to 92.7%, respectively4; however, the reason for the inter-study differences is unclear. In addition, a recent meta-analysis showed that the prevalence rates of olfactory and gustatory dysfunction were 52.7% and 54.9% in COVID-19 patients, respectively; however, a significant heterogeneity (I2 = 98.9% for both, prevalence rates of olfactory and gustatory dysfunction) was detected.4 In contrast to Europe where the prevalence of olfactory dysfunction was found to be more than 50% in many studies, we noted that most studies conducted in Asia showed the prevalence of olfactory dysfunction to be less than 50%.56789 Therefore, we hypothesized that the prevalence rates of olfactory and gustatory dysfunction are geographically and chronologically different, and this may explain the heterogeneity of the prevalence rate of olfactory and gustatory dysfunction. In this meta-analysis, we performed subgroup analysis to investigate factors, such as geographical region and enrollment time, that contributed to the inter-study variability of the prevalence rate of olfactory and gustatory dysfunction.
METHODS
Search strategy
A comprehensive search of PubMed, Embase, and Scopus databases following the Preferred Reporting Items for Systematic Reviews and Meta-Analyses guideline was carried out up to July 9th, 2020.10 Two authors (S.C.H, J.Y.K) independently performed literature searches to identify candidate studies for the meta-analysis using the terms: (“olfact*” OR “smell” OR “anosmia” OR “hyposmia”) AND COVID-19. Only studies published in English were selected.
Selection of studies
The two authors independently screened abstracts and titles of studies identified by the search strategy. Studies that did not satisfy eligibility criteria were discarded; then, eligibility was evaluated in the full-text format. The inclusion criteria of the present systematic review and meta-analysis were as follows: 1) the article reports on prevalence of olfactory or gustatory dysfunction in patients with COVID-19, 2) prevalence of olfactory or gustatory dysfunction are separately reported. The following types of studies were excluded: 1) multicenter studies, including different continents (e.g., Europe and Asia), 2) studies lacking full text (e.g., only abstracts).
Data extraction
Data from included studies were extracted into standardized forms and were independently confirmed by the two authors. For each article, the following information was collected: the name of the first author, year of publication, study design, country where the study was conducted, time patients were enrolled, age, sample size, number of patients with olfactory dysfunction, number of patients with gustatory dysfunction, evaluation method of olfactory dysfunction and/or gustatory function, and the characteristics of the population (general population, hospitalized population, non-hospitalized population, or healthcare workers population). The regions where the individual studies were conducted were categorized into: East Asia, Europe, North America, Middle East, Latin America, and Africa. The evaluation method was classified into history taking, self-reported survey, validated survey, and validated instrument. The validated surveys were designated as surveys with structured questions about olfactory and/or gustatory dysfunction. The validated instrument included evaluation with psychophysical function tests such as Sniffin' Sticks, UPSIT, and taste test with four solutions (salted, sweet, sour, and bitter solutions).
Risk of bias assessment
Risk of bias was evaluated using a quality assessment checklist for prevalence studies based on nine domains: representation of the national population, representation of the target population, random selection, likelihood of nonresponse, directly collected data from the subject, case definition, validity of the instrument of measurement, similarity in mode of data collection for all subjects, and presence of numerators and denominators in the parameters of interest.11 Each item was graded as 0 for low risk or 1 for high risk, and the summation of values rated to evaluate the risk of bias were 0−3, 4−6, and 7−9 for low, moderate, and high risk of bias, respectively.
Statistical analysis
Calculating the data extracted from each study, the weighted summary prevalence of olfactory and gustatory dysfunction was estimated using a Freeman-Tukey transformation with models based on random-effects assumptions.12 Because prevalence would be influenced by the spectrum of populations and the evaluation method of olfactory or gustatory dysfunction in the individual studies, we expected a significant heterogeneity across the included studies. Therefore, we selected a random-effects model to give more conservative estimates. A meta-analysis of variance compared the prevalence of olfactory and gustatory dysfunction according to regional, chronological, demographic, and methodologic factors, respectively. Post-hoc analysis was carried out using Tukey's test for the results of analysis of variance (ANOVA). To assess heterogeneity across the included studies, the Cochran Q statistic test and the I2 test were carried out. A funnel plot and Egger's test were used to evaluate potential publication bias. All analyses were conducted in R for Windows version 3.6.1 by using the “meta” and “metaphor” packages (R Foundation for Statistical Computing, Vienna, Austria). A P value < 0.05 was considered statistically significant.
RESULTS
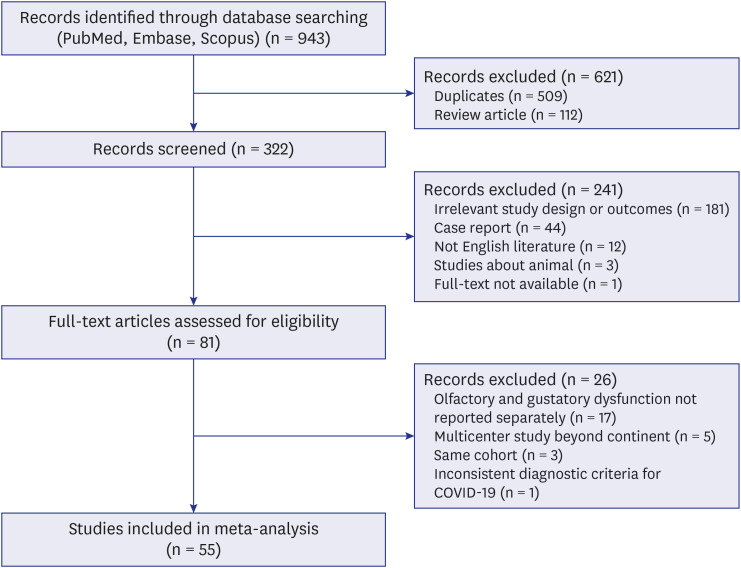
Initially, of the 943 citations identified through the search strategy, we included 55 eligible studies for systematic review (Fig. 1).5678913141516171819202122232425262728293031323334353637383940414243444546474849505152535455565758596061
Study characteristics
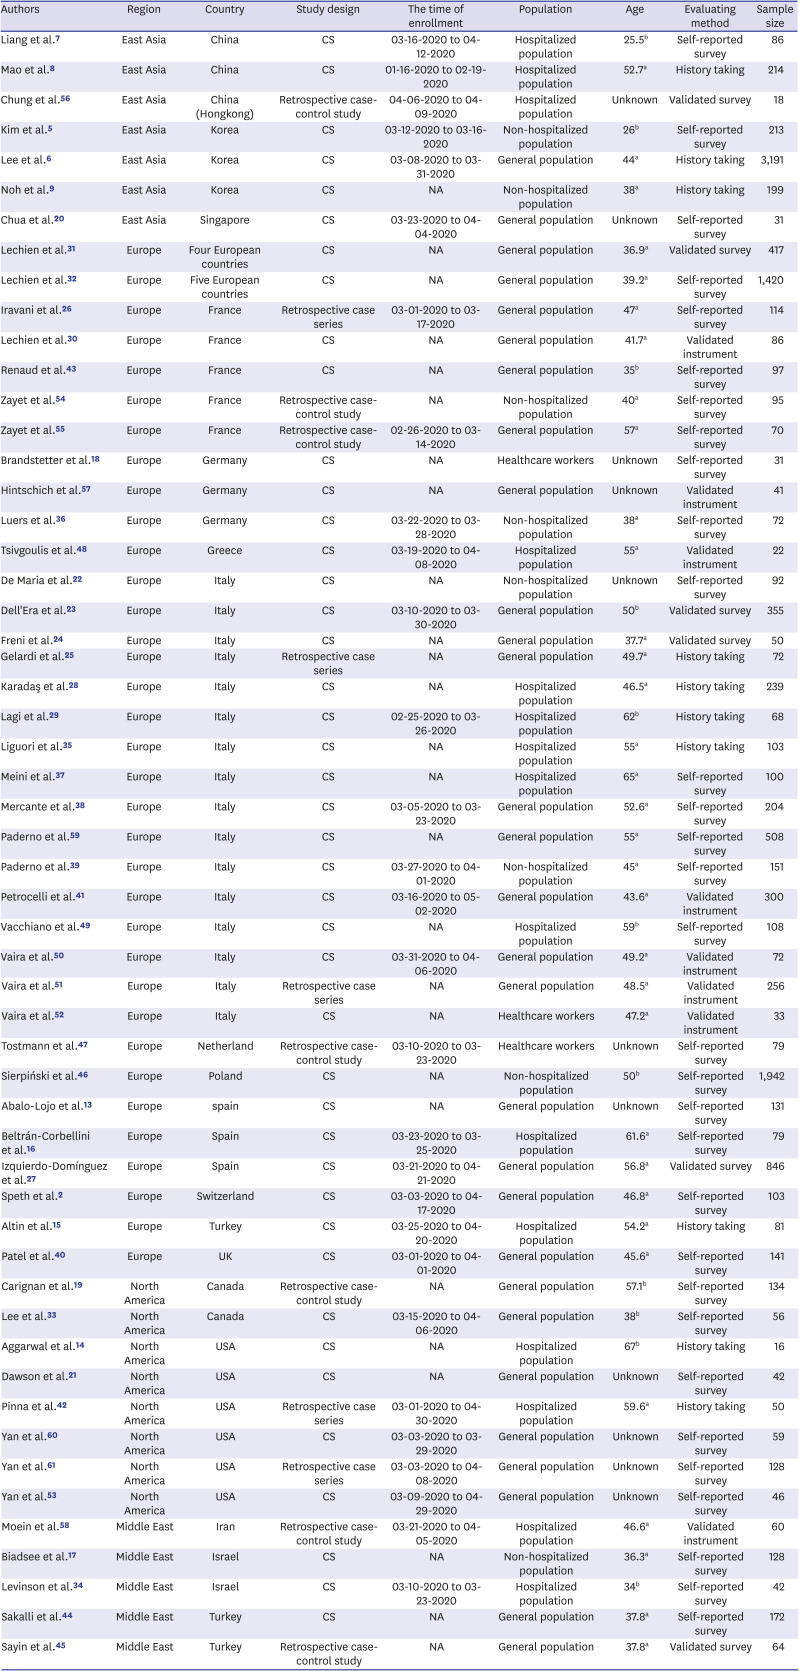
The characteristics of the included studies are summarized in Table 1. The total sample size of the 55 included studies was 13,527 patients with individual sample sizes ranging from 16−3,191 patients. All included studies reported the prevalence of olfactory dysfunction in COVID-19, while 46 studies reported the prevalence of gustatory dysfunction. All included studies were conducted in 2020, and they were performed across 19 countries. There were four regions with at least one study: East Asia (n = 7), Europe (n = 35), North America (n = 8), Middle East (n = 5). The region with the most individual studies was Europe (n = 35), including 16 studies conducted in Italy. Two multicenter studies conducted in Europe were included. Out of 55 included studies, 29 clarified when patients were enrolled. Considering the characteristics of the population of individual studies, there were 29 studies of the general population, including both hospitalized and non-hospitalized patients, 15 studies of only hospitalized patients, eight studies of only non-hospitalized patients, and three studies of healthcare workers. Ten studies used history taking of olfactory and/or gustatory evaluation, 31 used self-reported surveys, six used validated surveys, and eight used validated instruments. Patients were diagnosed as COVID-19 by real-time polymerase chain reaction in most studies, except four6234951 that did not report the testing tool.
Table 1
Summary of the included studies
| Authors | Region | Country | Study design | The time of enrollment | Population | Age | Evaluating method | Sample size |
|---|---|---|---|---|---|---|---|---|
| Liang et al.7 | East Asia | China | CS | 03-16-2020 to 04-12-2020 | Hospitalized population | 25.5b | Self-reported survey | 86 |
| Mao et al.8 | East Asia | China | CS | 01-16-2020 to 02-19-2020 | Hospitalized population | 52.7a | History taking | 214 |
| Chung et al.56 | East Asia | China (Hongkong) | Retrospective case-control study | 04-06-2020 to 04-09-2020 | Hospitalized population | Unknown | Validated survey | 18 |
| Kim et al.5 | East Asia | Korea | CS | 03-12-2020 to 03-16-2020 | Non-hospitalized population | 26b | Self-reported survey | 213 |
| Lee et al.6 | East Asia | Korea | CS | 03-08-2020 to 03-31-2020 | General population | 44a | History taking | 3,191 |
| Noh et al.9 | East Asia | Korea | CS | NA | Non-hospitalized population | 38a | History taking | 199 |
| Chua et al.20 | East Asia | Singapore | CS | 03-23-2020 to 04-04-2020 | General population | Unknown | Self-reported survey | 31 |
| Lechien et al.31 | Europe | Four European countries | CS | NA | General population | 36.9a | Validated survey | 417 |
| Lechien et al.32 | Europe | Five European countries | CS | NA | General population | 39.2a | Self-reported survey | 1,420 |
| Iravani et al.26 | Europe | France | Retrospective case series | 03-01-2020 to 03-17-2020 | General population | 47a | Self-reported survey | 114 |
| Lechien et al.30 | Europe | France | CS | NA | General population | 41.7a | Validated instrument | 86 |
| Renaud et al.43 | Europe | France | CS | NA | General population | 35b | Self-reported survey | 97 |
| Zayet et al.54 | Europe | France | Retrospective case-control study | NA | Non-hospitalized population | 40a | Self-reported survey | 95 |
| Zayet et al.55 | Europe | France | Retrospective case-control study | 02-26-2020 to 03-14-2020 | General population | 57a | Self-reported survey | 70 |
| Brandstetter et al.18 | Europe | Germany | CS | NA | Healthcare workers | Unknown | Self-reported survey | 31 |
| Hintschich et al.57 | Europe | Germany | CS | NA | General population | Unknown | Validated instrument | 41 |
| Luers et al.36 | Europe | Germany | CS | 03-22-2020 to 03-28-2020 | Non-hospitalized population | 38a | Self-reported survey | 72 |
| Tsivgoulis et al.48 | Europe | Greece | CS | 03-19-2020 to 04-08-2020 | Hospitalized population | 55a | Validated instrument | 22 |
| De Maria et al.22 | Europe | Italy | CS | NA | Non-hospitalized population | Unknown | Self-reported survey | 92 |
| Dell'Era et al.23 | Europe | Italy | CS | 03-10-2020 to 03-30-2020 | General population | 50b | Validated survey | 355 |
| Freni et al.24 | Europe | Italy | CS | NA | General population | 37.7a | Validated survey | 50 |
| Gelardi et al.25 | Europe | Italy | Retrospective case series | NA | General population | 49.7a | History taking | 72 |
| Karadaş et al.28 | Europe | Italy | CS | NA | Hospitalized population | 46.5a | History taking | 239 |
| Lagi et al.29 | Europe | Italy | CS | 02-25-2020 to 03-26-2020 | Hospitalized population | 62b | History taking | 68 |
| Liguori et al.35 | Europe | Italy | CS | NA | Hospitalized population | 55a | History taking | 103 |
| Meini et al.37 | Europe | Italy | CS | NA | Hospitalized population | 65a | Self-reported survey | 100 |
| Mercante et al.38 | Europe | Italy | CS | 03-05-2020 to 03-23-2020 | General population | 52.6a | Self-reported survey | 204 |
| Paderno et al.59 | Europe | Italy | CS | NA | General population | 55a | Self-reported survey | 508 |
| Paderno et al.39 | Europe | Italy | CS | 03-27-2020 to 04-01-2020 | Non-hospitalized population | 45a | Self-reported survey | 151 |
| Petrocelli et al.41 | Europe | Italy | CS | 03-16-2020 to 05-02-2020 | General population | 43.6a | Validated instrument | 300 |
| Vacchiano et al.49 | Europe | Italy | CS | NA | Hospitalized population | 59b | Self-reported survey | 108 |
| Vaira et al.50 | Europe | Italy | CS | 03-31-2020 to 04-06-2020 | General population | 49.2a | Validated instrument | 72 |
| Vaira et al.51 | Europe | Italy | Retrospective case series | NA | General population | 48.5a | Validated instrument | 256 |
| Vaira et al.52 | Europe | Italy | CS | NA | Healthcare workers | 47.2a | Validated instrument | 33 |
| Tostmann et al.47 | Europe | Netherland | Retrospective case-control study | 03-10-2020 to 03-23-2020 | Healthcare workers | Unknown | Self-reported survey | 79 |
| Sierpiński et al.46 | Europe | Poland | CS | NA | Non-hospitalized population | 50b | Self-reported survey | 1,942 |
| Abalo-Lojo et al.13 | Europe | spain | CS | NA | General population | Unknown | Self-reported survey | 131 |
| Beltrán‐Corbellini et al.16 | Europe | Spain | CS | 03-23-2020 to 03-25-2020 | Hospitalized population | 61.6a | Self-reported survey | 79 |
| Izquierdo-Domínguez et al.27 | Europe | Spain | CS | 03-21-2020 to 04-21-2020 | General population | 56.8a | Validated survey | 846 |
| Speth et al.2 | Europe | Switzerland | CS | 03-03-2020 to 04-17-2020 | General population | 46.8a | Self-reported survey | 103 |
| Altin et al.15 | Europe | Turkey | CS | 03-25-2020 to 04-20-2020 | Hospitalized population | 54.2a | History taking | 81 |
| Patel et al.40 | Europe | UK | CS | 03-01-2020 to 04-01-2020 | General population | 45.6a | Self-reported survey | 141 |
| Carignan et al.19 | North America | Canada | Retrospective case-control study | NA | General population | 57.1b | Self-reported survey | 134 |
| Lee et al.33 | North America | Canada | CS | 03-15-2020 to 04-06-2020 | General population | 38b | Self-reported survey | 56 |
| Aggarwal et al.14 | North America | USA | CS | NA | Hospitalized population | 67b | History taking | 16 |
| Dawson et al.21 | North America | USA | CS | NA | General population | Unknown | Self-reported survey | 42 |
| Pinna et al.42 | North America | USA | Retrospective case series | 03-01-2020 to 04-30-2020 | Hospitalized population | 59.6a | History taking | 50 |
| Yan et al.60 | North America | USA | CS | 03-03-2020 to 03-29-2020 | General population | Unknown | Self-reported survey | 59 |
| Yan et al.61 | North America | USA | Retrospective case series | 03-03-2020 to 04-08-2020 | General population | Unknown | Self-reported survey | 128 |
| Yan et al.53 | North America | USA | CS | 03-09-2020 to 04-29-2020 | General population | Unknown | Self-reported survey | 46 |
| Moein et al.58 | Middle East | Iran | Retrospective case-control study | 03-21-2020 to 04-05-2020 | Hospitalized population | 46.6a | Validated instrument | 60 |
| Biadsee et al.17 | Middle East | Israel | CS | NA | Non-hospitalized population | 36.3a | Self-reported survey | 128 |
| Levinson et al.34 | Middle East | Israel | CS | 03-10-2020 to 03-23-2020 | Hospitalized population | 34b | Self-reported survey | 42 |
| Sakalli et al.44 | Middle East | Turkey | CS | NA | General population | 37.8a | Self-reported survey | 172 |
| Sayin et al.45 | Middle East | Turkey | Retrospective case-control study | NA | General population | 37.8a | Validated survey | 64 |
Quality assessment
Quality assessment of the individual studies is demonstrated in Supplementary Table 1. The mean overall score was 3.5, indicating overall low to moderate risk of procedure bias, and there were 29 and 26 studies with low and moderate risk of procedure bias, respectively. No study had a high risk of methodological bias because the prevalence of olfactory and/or gustatory dysfunction was similarly evaluated in patients. However, the studies with hospitalized, non-hospitalized, or healthcare worker populations that did not represent the general population were commonly evaluated as studies with a moderate risk of bias. Most individual studies were cross-sectional, which contains an implicit risk of bias if the number of patients omitted was not recorded accurately.
The overall prevalence rates of olfactory and gustatory dysfunction in COVID-19 patients
A total of 13,527 patients were identified for assessment of olfactory dysfunction in 55 studies. The prevalence of olfactory dysfunction in individual studies ranged from 5.1% to 99.0%, and the prevalence was 51.4% in the random-effects model with severe inter-study heterogeneity (95% confidence interval [CI], 43.7–59.1; I2 = 98.6%; Supplementary Fig. 1A). Evaluation of gustatory dysfunction was identified in 46 included studies of 13,014 patients. The prevalence of gustatory dysfunction in individual studies ranged from 5.1% to 89.4%, and the random-effects model demonstrated a 47.5% prevalence with severe inter-study heterogeneity (95% CI, 39.7–55.3; I2 = 98.6%; Supplementary Fig. 1B).
Subgroup analyses according to the region
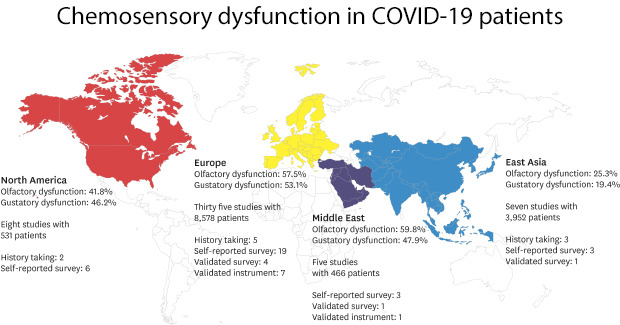
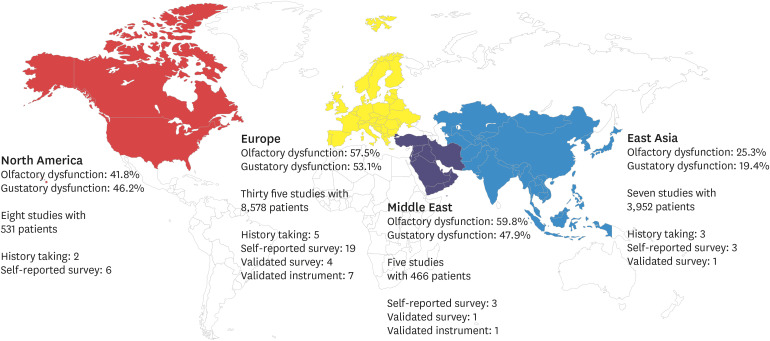
The prevalence rates of olfactory and gustatory dysfunction of the four different regions were 25.3% and 19.4% in East Asia, 57.5% and 53.1% in Europe, 41.8% and 46.2% in North America, and 59.8% and 47.9% in the Middle East, respectively, with a significant difference among the regions (both P < 0.001; Fig. 2A and B). Post-hoc analysis revealed that the prevalence of olfactory dysfunction in East Asia was significantly lower than that in Europe or the Middle East (P = 0.001 and P = 0.021, respectively), and prevalence of gustatory dysfunction in East Asia was significantly lower than that in Europe or North America (P = 0.001 and P = 0.048, respectively). Considering the possibility that olfactory or gustatory dysfunction was not accurately recorded when the history taking was used as the evaluation method, an ANOVA was performed without the studies conducted with history taking as the evaluation method, and the results also showed a significant difference among the regions (P = 0.005 and P < 0.001, respectively; Supplementary Fig. 2A and B). The regional prevalence rates of olfactory and gustatory dysfunction are shown in Fig. 3.
Fig. 2
Subgroup analysis on region. (A) Forest plot meta-analysis of the prevalence of olfactory dysfunction of four regions (East Asia, Europe, North America, and Middle East) showed 25.3%, 57.5%, 41.8%, and 59.8% pooled subgroup prevalence rates in the random-effect model, respectively (P < 0.001 for subgroup difference). (B) Forest plot meta-analysis of the prevalence of gustatory dysfunction of four regions (East Asia, Europe, North America, and Middle East) showed 19.4%, 53.1%, 46.2%, and 47.9% pooled subgroup prevalence rates in the random-effect model, respectively (P < 0.001 for subgroup difference). The diamonds represent pooled prevalence rates with 95% CI, and the estimates of individual studies are represented as squares, with 95% CIs represented as horizontal lines.
CI = confidence interval.

Fig. 3
World map of the prevalence rates of olfactory and gustatory dysfunction in coronavirus disease 2019 patients. The colored regions indicate the geographically classified regions in this study (aqua blue: East Asia, yellow: Europe, red: North America, navy: Middle East). The prevalence rates of olfactory and gustatory dysfunction, number of included studies and patients, and number of studies according to the evaluation method are presented for each region.
Subgroup analyses according to the time of enrollment
The time of enrollment was clarified in 29 out of 55 studies. The time of enrollment in the included studies ranged from January 16, 2020 to May 2, 2020. The beginning date of the time of enrollment in the included studies ranged from January 16, 2020 to April 6, 2020, and the end date ranged from February 9, 2020 to May 2, 2020. After calculating the median date (mid-date) between the beginning and end date of the time of enrollment, the individual studies were categorized into three groups: 1st period (mid-date February 2, 2020 to March 17, 2020), 2nd period (mid-date March 20, 2020 to March 29, 2020), and 3rd period (mid-date March 30, 2020 to April 9, 2020). The numbers of included studies of olfactory and gustatory dysfunction in each period were n = 10 and n = 8 for the 1st period, n = 11 and n = 9 for the 2nd period, and n = 8 and n = 6 for the 3rd period, respectively. The prevalence rates of olfactory and gustatory dysfunction for the three periods were 39.5% and 40.9% for the 1st period, 57.7% and 51.2% for the 2nd period, and 49.0 and 40.5% for the 3rd period, respectively; however, no significant difference was found with regard to the time of enrollment (P = 0.391 and P = 0.778; Fig. 4A and B). As the region can be a potential confounding factor, we performed ANOVA for the studies conducted in Europe (n = 16). The ANOVA of the studies from Europe demonstrated that there were significant differences in the prevalence rates of olfactory dysfunction among the three periods (P = 0.013; Fig. 4C); however, there was no significant difference in the prevalence of gustatory dysfunction (Fig. 4D). Post-hoc analysis revealed that the prevalence of olfactory dysfunction in the 2nd period was significantly higher than that in the 1st period (P = 0.046). Furthermore, the chronological difference among the studies from Europe was significant even when studies in which history taking was used as an evaluation method were omitted (P = 0.038, Supplementary Fig. 3). The chronological prevalence rates of olfactory and gustatory dysfunction are shown in Fig. 5.
Fig. 4
Subgroup analysis on the time of enrollment. The time of enrollment was clarified in 29 out of 55 studies. After calculating the median date (mid-date) between beginning and end date of the time of enrollment, the individual studies were categorized into three groups: 1st period (mid-date February 2, 2020 to March 17, 2020), 2nd period (mid-date March 20, 2020 to March 29, 2020), and 3rd period (mid-date March 30, 2020 to April 9, 2020). (A) Forest plot meta-analysis of the prevalence of olfactory dysfunction of the three periods showed 39.5%, 57.7%, and 49.0% pooled subgroup prevalence rates in the random-effect model, respectively (P = 0.391 for subgroup difference). (B) Forest plot meta-analysis of the prevalence of gustatory dysfunction of the three periods showed 40.9%, 51.2%, and 40.5% pooled subgroup prevalence rates in the random-effect model, respectively (P = 0.778 for subgroup difference). (C) Forest plot meta-analysis of the prevalence of olfactory dysfunction only including studies conducted in Europe for the three periods showed 45.2%, 65.4%, and 59.0% pooled subgroup prevalence rates in the random-effect model, respectively (P = 0.013 for subgroup difference). (D) Forest plot meta-analysis of the prevalence of gustatory dysfunction of the three periods showed 49.8%, 60.2%, and 49.3% pooled subgroup prevalence rates in the random-effect model, respectively (P = 0.538 for subgroup difference). The diamonds represent pooled prevalence rates with 95% CI, and the estimates of individual studies are represented as squares, with 95% CIs represented as horizontal lines.
CI = confidence interval.
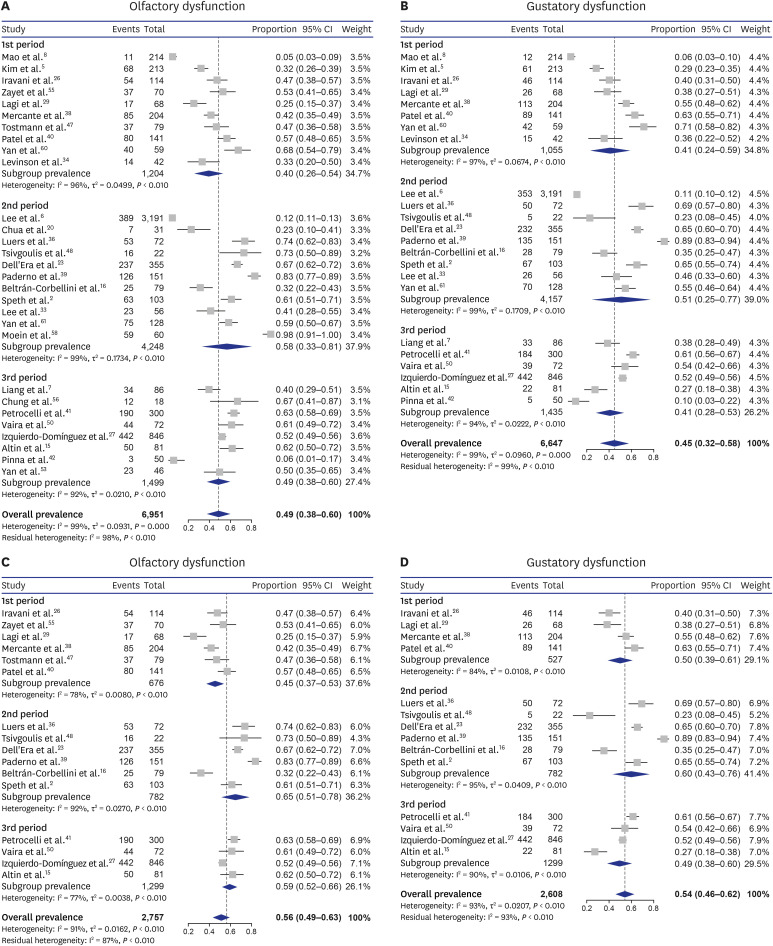
Fig. 5
The pooled prevalence of olfactory and gustatory dysfunction was presented chronologically. The overall and European pooled prevalence rates of olfactory and gustatory dysfunction are shown, discriminated by color. The prevalence rates of both olfactory and gustatory tended to increase from the 1st to 2nd period but decreased from the 2nd to 3rd period.

Subgroup analyses according to evaluation method
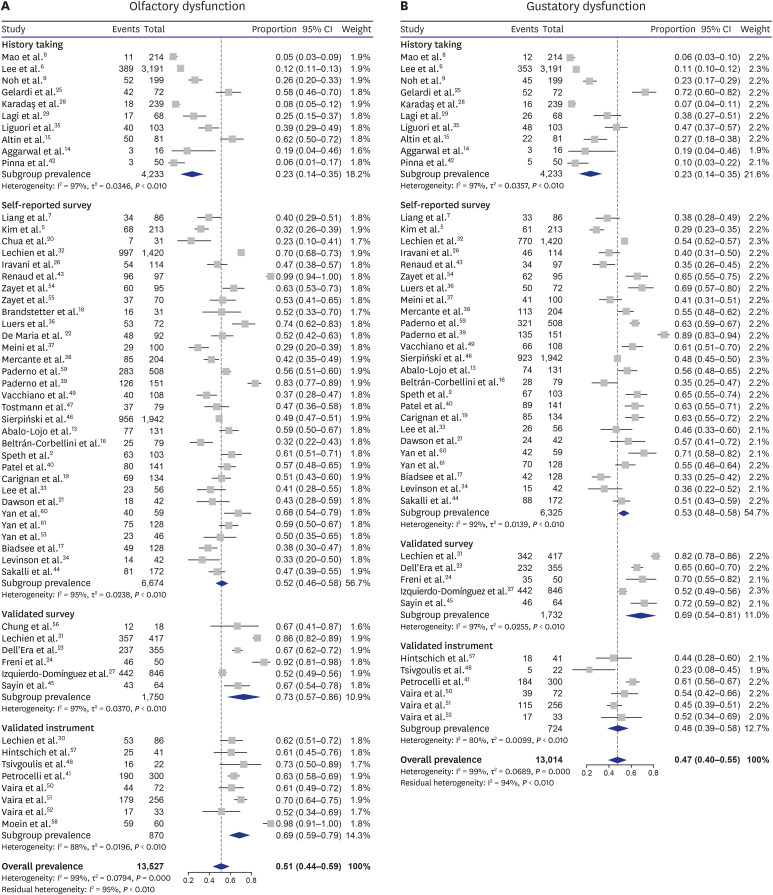
The prevalence rates of olfactory and gustatory dysfunction according to the four different evaluation methods were 23.4% and 23.5% for history taking, 52.1% and 53.2% for self-reported surveys, 72.9 and 68.5% for validated surveys, and 69.2 and 48.4% for the validated instruments, respectively, and there was a significant difference among the regions (both P < 0.001, respectively; Fig. 6A and B). In a post-hoc analysis, the prevalence of olfactory dysfunction evaluated by history taking was lower than that evaluated by other methods (all P < 0.001, respectively), and the prevalence evaluated by the self-reported survey was lower than that evaluated by validated survey (P = 0.033). In addition, the prevalence of gustatory dysfunction by history taking was lower than that evaluated by the self-reported survey, validated survey, and validated instruments (P < 0.001, P < 0.001, and P = 0.004, respectively).
Fig. 6
Subgroup analysis on the evaluation method. The evaluation method was classified into history taking, self-reported survey, validated survey, and validated instrument. (A) Forest plot meta-analysis of the prevalence rates of olfactory dysfunction of the four evaluation methods showed 23.4%, 52.1%, 72.9%, and 69.2% pooled subgroup prevalence rates in random-effect model, respectively (P < 0.001 for subgroup difference). (B) Forest plot meta-analysis of the prevalence rates of gustatory dysfunction of the four evaluation methods showed 23.5%, 53.2%, 68.5%, and 48.4% pooled subgroup prevalence rates in random-effect model, respectively (P < 0.001 for subgroup difference). The diamonds represent pooled prevalence rates with 95% CI, and the estimates of individual studies are represented as squares, with 95% CIs represented as horizontal lines.
CI = confidence interval.
Subgroup analyses according to the characteristics of the population
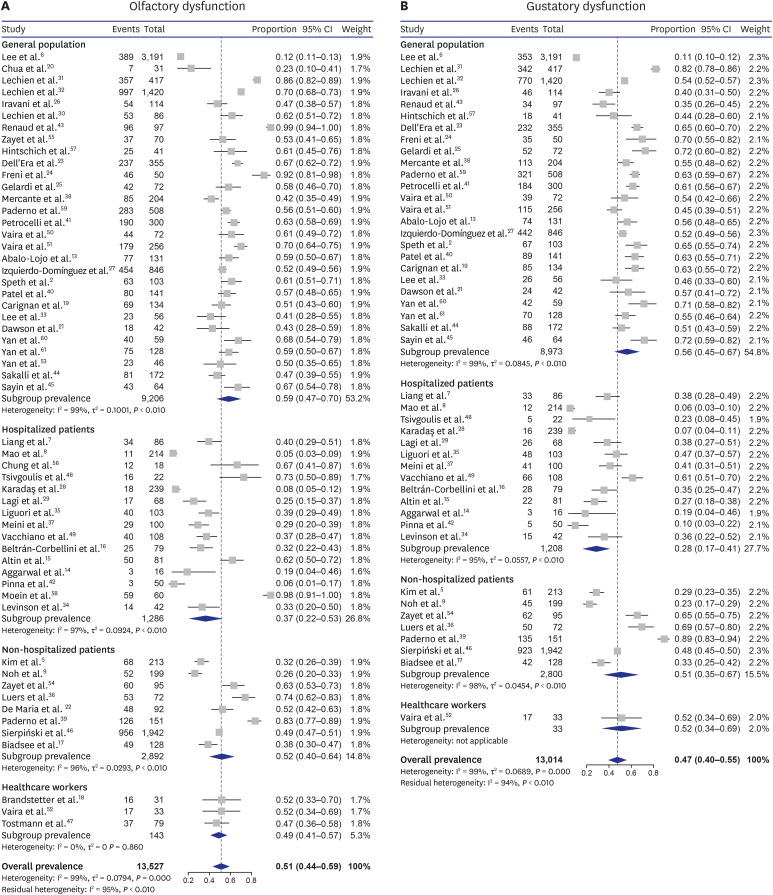
The prevalence rates of olfactory and gustatory dysfunction according to the four population groups were 58.7% and 56.2% in the general population, 36.7% and 28.3% in hospitalized patients, 52.3% and 51.1% in non-hospitalized patients, and 48.9% and 51.5% in health care workers, respectively (Fig. 7A and B). Interestingly, a significant difference was found in the prevalence of gustatory dysfunction depending on the characteristics of the population (P = 0.013) but not in that of olfactory dysfunction (P = 0.173). Post-hoc analysis showed that the prevalence of gustatory dysfunction of the hospitalized patients was significantly lower than that of the general population (P = 0.030).
Fig. 7
Subgroup analysis on the characteristics of population. The characteristics of population was classified into general population, hospitalized population, non-hospitalized population, and population of healthcare workers. (A) Forest plot meta-analysis of the prevalence of olfactory dysfunction of the four demographics showed 58.7%, 36.7%, 52.3%, and 48.9% pooled subgroup prevalence rates in the random-effect model, respectively (P < 0.001 for subgroup difference). (B) Forest plot meta-analysis of the prevalences of gustatory dysfunction of the four demographics showed 56.2%, 28.3%, 51.1%, and 51.5% pooled subgroup prevalence rates in random-effect model, respectively (P < 0.001 for subgroup difference). The diamonds represent pooled prevalence rates with 95% CI, and the estimates of individual studies are represented as squares, with 95% CIs represented as horizontal lines.
CI = confidence interval.
Assessment of publication bias
The funnel plot demonstrated potential publication bias in the analysis (Supplementary Fig. 4A and B). In Egger's test, there was a potential publication bias for the prevalence rates of olfactory and gustatory dysfunction (P = 0.031, P = 0.028). However, asymmetry in the funnel plots may be attributed to the various factors that elicited different prevalence rates, such as region, time of enrollment, and evaluation method, rather than publication bias.
DISCUSSION
Olfactory and gustatory dysfunction were not recognized as typical symptoms of COVID-19 in the early phase of virus' spread. However, as olfactory and gustatory dysfunction were frequently found in patients with COVID-19, these symptoms became significant. Furthermore, as a previous study reported, 17% of COVID-19 patients with anosmia were otherwise asymptomatic, meaning that isolated olfactory or gustatory dysfunction could be used as potential early indicators of SARS-CoV-2 infection during the COVID-19 pandemic.62 Possible mechanisms of olfactory dysfunctions in COVID-19 patients are conductive anosmia, disruption of olfactory epithelium following local infection, and retrograde propagation to higher-order neurons in the olfactory pathway.63 However, there is limited evidence to conclusively determine the mechanism of olfactory dysfunction in COVID-19.63 Considering gustatory dysfunction in COVID-19, it is unclear whether gustatory dysfunction is a distinct clinical feature of SARS-CoV-2 or occurs secondary to olfactory dysfunction. Although olfactory and gustatory dysfunction were noted frequently in COVID-19, the prevalence rates of olfactory and gustatory dysfunction were variable among previous studies. In this meta-analysis, subgroup analysis was performed to explain the variability of the prevalence rate of olfactory and gustatory dysfunction among patients with COVID-19.
In this meta-analysis, the prevalence rates of olfactory and gustatory dysfunction in COVID-19 patients were 51.4% and 47.5%, with severe inter-study heterogeneity (both I2 = 98.6%, respectively), respectively. We performed subgroup analysis based on region, time of enrollment, demographics, and the evaluation method to explain the inter-study heterogeneity.
As we hypothesized, the prevalence rates of olfactory and gustatory dysfunction were different among the four geographical regions. The prevalence of olfactory dysfunction in East Asia was significantly lower than that in Europe or the Middle East and prevalence of gustatory dysfunction in East Asia was significantly lower than that in Europe and North America. In the subgroup analysis on the time of enrollment, there was no significant difference among the three periods. However, considering the spread of the virus occurred regionally and chronologically, the regional factor might be a potential confounding factor. In an ANOVA of the studies from Europe alone, there were significant differences in the prevalence rates of olfactory dysfunction among the three time period groups, indicating that a genetic mutation of virus in the same region may have affected the prevalence of olfactory dysfunction. The prevalence rates of olfactory dysfunction of the all regions were 39.5% for the 1st period, 57.7% for the 2nd period, and 49.0% for the 3rd period, which was a similar tendency compared to that of Europe: 45.2% for the 1st period, 65.4% for the 2nd period, and 59.0% for the 3rd period. Interestingly, olfactory dysfunction increased from the 1st to 2nd period but slightly decreased from the 2nd to 3rd period.
Because the included studies were performed with various evaluation methods and populations, we carried out further subgroup analyses on the evaluation methods and population group to explain the heterogeneity. In subgroup analysis on the evaluation methods, the prevalence rates of olfactory and gustatory dysfunction evaluated by history taking were lower than those by other evaluation methods. In contrast to survey or objective test, simple history taking may have a risk of omitting questions about olfactory and gustatory dysfunction. The chemosensory function of these patients was often regarded as normal, leading to a low prevalence of olfactory and gustatory dysfunction. Therefore, we confirmed the results of the subgroup analysis on the geographical region and the time of enrollment by omitting studies in which history taking was used as the evaluation method, and we found that it still showed a statistical significance. In subgroup analysis on the population group, interestingly, a significant difference was found in the prevalence of gustatory dysfunction depending on population characteristics but not in that of olfactory dysfunction. In a post-hoc analysis, the prevalence of gustatory dysfunction of the hospitalized patients was lower than that of the general population, which may be attributed to the higher rate of the history taking as the evaluation method in hospitalized patients than that in the general population (46.7% vs. 6.9%, respectively).
There are some possible explanations for the regional and chronological differences in olfactory and gustatory dysfunction in COVID-19—first, the ethnic differences in the frequency variants of angiotensin-converting enzyme 2 (ACE2). As previous studies indicate, ACE2 is a possible host receptor of SARS-CoV-2.6465 Variants of ACE2 may affect the course of infection, including susceptibility and symptoms depending on the expression level and pattern of ACE2 in different tissues.66 In a previous study, presence of a difference in variants of ACE2 according to geographical and ethnic factors was demonstrated,66 and it is assumed that the difference in variants of ACE2 expressed in olfactory epithelial cells according to populations from different geographical regions can influence the prevalence of olfactory and gustatory dysfunction. Second, phylogenetic mutation may contribute to regional and chronological differences. As the prevalence of olfactory dysfunction was significantly different according to time of enrollment in subgroup analysis with the studies from European countries, the ethnic differences may not be sufficient to explain the chronological differences in the prevalence rates of olfactory dysfunction. Recent studies reported that SARS-CoV-2 has rapidly attained mutations as a typical coronavirus, allowing for tracking its spread.6768 The prevalence of S type and L type of SARS-CoV-2 were 3.7% and 96.3% in viral isolates in Wuhan, respectively, yet viral isolates outside of Wuhan were 38.4% S type and 61.3% L type.68 Furthermore, the mutation may cause regional differences in virus type. For instance, a previous study revealed that the B1 clade is dominant in the West Coast of the United States, while the A2a clade, which seems to have spread through Europe and Italy, is dominant in the East Coast of the United States.69 In addition to the regional differences, the expanding phylogenetic diversity can induce a chronologic difference in the type of SARS-CoV-2. A previous study revealed the global transition of the SARS-CoV-2 spike protein from the original D614 to the G614 variant.70 To be specific, through March 1, 2020, the G614 variant was rare outside Europe; however, it increased in frequency worldwide by the end of March.70 As the virus types and genetic mutations were different regionally and chronologically,686970 the influence of SARS-CoV-2 on the olfactory epithelium may have differed according to virus type and genetic mutation. Lastly, heterogeneity in the study designs may have caused different prevalence rates of olfactory and gustatory dysfunction. The study populations and evaluation methods were variable in the individual studies. As shown in the results, evaluation method may lead to different prevalence. To reduce the confounding effect of the evaluation method, we performed a subgroup analysis without the studies in which history taking was used as an evaluation method. However, the other three methods may also have had differences, although statistical significance was not found. In addition, different characteristics of populations might affect the prevalence rate in individual studies.
In conclusion, olfactory and gustatory dysfunction are commonly reported in patients with COVID-19 and noted as significant symptoms; however, the prevalence rates are variable. This meta-analysis revealed that regional and chronological differences in the prevalence rates of olfactory and gustatory dysfunction explain the inter-study heterogeneity.
 XML Download