Journal List > Ewha Med J > v.44(1) > 1146357

Kim, Bang, Baik, Jung, and Park: Correlation between Systolic Blood Pressure and Triglyceride Level in the Uzbekistan Population

Abstract

Objectives

: This study aimed to characteristic the systolic blood pressure (SBP), diastolic pressure, pulse pressure, glucose, creatine, and lipid profile. This study also aimed to investigate the prevalence of hypertension and the relationship between hypertension and the lipid profile in Uzbekistan.

Methods

The subjects consisted of 58 Uzbekistan subjects recruited from Ewha Medical Care patients. Blood samples were collected from the patients for the lipid profile and random glucose and creatinine levels. Paired t tests were used for the group means and a chi-square or Fisher’s exact test for categorical variables. A multiple logistic regression analysis was performed.

Results

Among the 58 patients constituting the baseline population, hypertension developed in 42 patients. Among them, the triglyceride (TG) level was significantly higher in the hypertension group than normal group (173.19 vs. 127.06 mg/dL, P=0.014). The SBP had a positive correlation with the TG (r=0.979, P<0.01) and creatinine (r=0.002, P<0.05) levels and also, the pulse pressure had a positive correlation with the cholesterol level (r=0.539, P<0.05). A multivariate analysis (adjusted for age and sex) indicated that there was a positive correlation between the SBP and TG level (r=0.941, P<0.05).

Conclusion

There was a positive correlation between the SBP and TG level in the Uzbekistan population according to this study.

Introduction

Cardiovascular disease (CVD) is one of the most significant global health issues. Ischemic heart disease and strokes caused deaths in 15.2 million people worldwide in 2016. Of the 56.9 million total deaths, they caused more than a quarter of the deaths (26.7%) all around the world. For 15 years, CVD has held first place among the top 10 causes of death worldwide [1].
Likewise, CVD is the leading cause of death in Uzbekistan, accounting for 50.1% of the total deaths in 2012. According to the World Health Organization country health profile [2], ischemic heart disease and strokes are ranked first (34.2%) and second (15.9%) among the top 10 causes of death in Uzbekistan. Also, the disease burden of CVD is the greatest in Uzbekistan, with the highest disability-adjusted life years value. Hypertension, a high low-density lipoprotein (LDL) level, and a low high-density lipoprotein (HDL) level are some modifiable risk factors of CVD morbidity and mortality [3-5]. Among them, the LDL cholesterol and triglycerides (TGs) have been associated with the lifestyle involving the daily diet and hot weather [6]. In general, the diet of Uzbekistan includes high salty and fatty food ingredients and the average annual temperature is high. Uzbekistan’s summer temperatures often surpass 40℃ [7]. However, there are few studies characterizing the prevalence of hypertension and dyslipidemia in Uzbekistan. The correlation between hypertension, dyslipidemia, glucose, creatine, and the lipid profile is not well characterized in Uzbekistan. The aim of this study was to characterize the systolic blood pressure (SBP), diastolic pressure (DBP), pulse pressure (PP), glucose, creatine, and lipid profile. This study also aimed to investigate the risk factors of CVD and the relationship between hypertension and the lipid profile in Uzbekistan. This cross-sectional study was conducted in two regions of Uzbekistan, Andijan and Syrdarya.

Methods

1. Study selection

Ewha Medical Care (EMC) is kind of volunteer group consisting of medical staff working in Ewha Womans University Hospital, medical school students. EMC treated patients from August 2, 2018 to August 5, 2018 (3 days) in Andijan, Uzbekistan and from August 6, 2018 to August 7, 2018 (2 days) in Syrdarya, Uzbekistan. Patients are native Uzbekistan people who visited EMC hospital for health check up or to be treated for their various symptoms. Andijan is an important industrial city in Uzbekistan. Andijan has a cold semi-arid climate with cold winters (average low -3.6℃) and hot summers (average high up to 34.7℃), although winters are milder than one might expect for a location in Central Asia [7]. Syrdarya is relatively rural area. The economy is based on cotton and cereal crops, with strong reliance on irrigation and on cattle breeding [7].
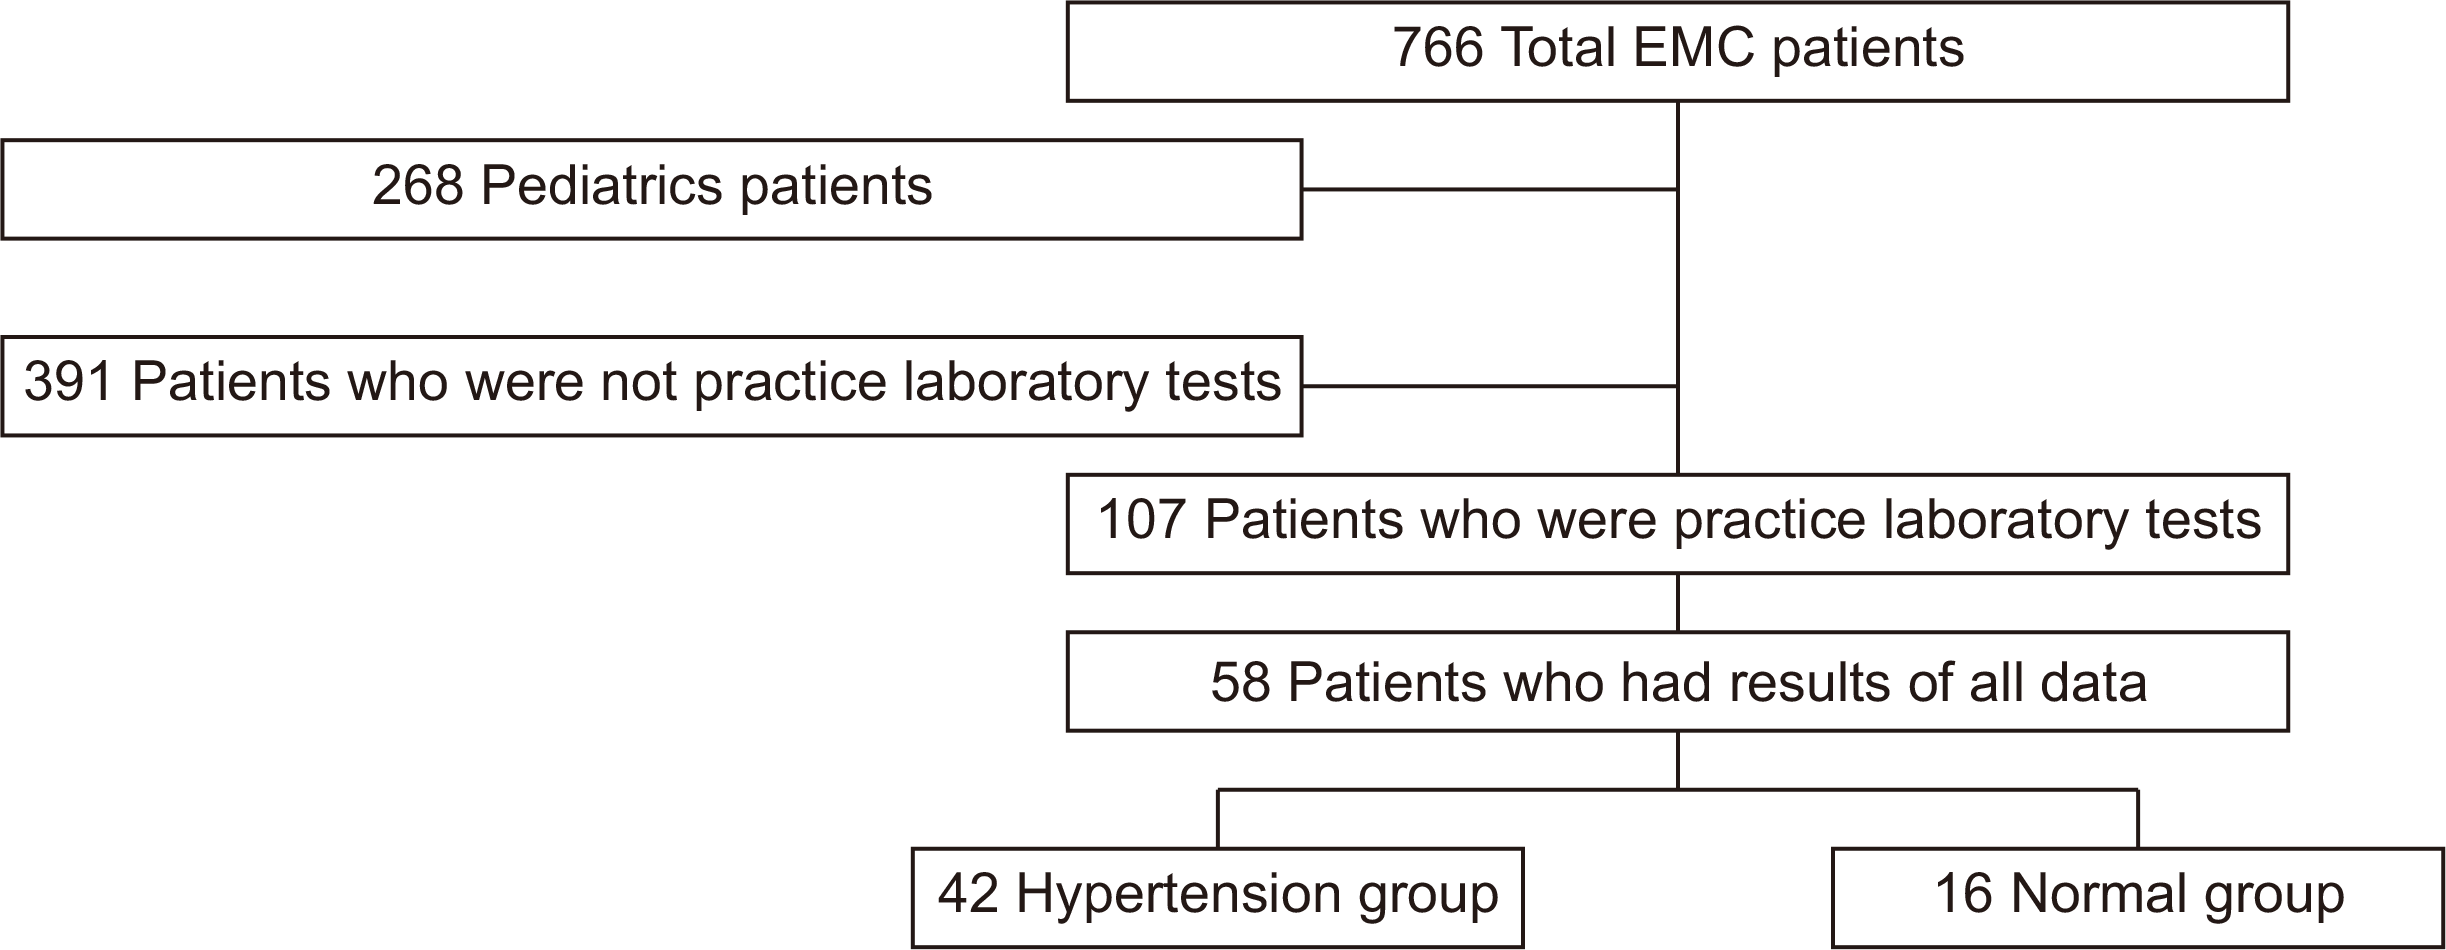
The total patients consisted of 766 Uzbekistan patients. We excluded those patients aged under 19-years-old (268 peoples) who received pediatrics treatment. Females who were pregnant at the time of the survey were excluded. In 498 adult patients, the subjects were included who received laboratory tests (107 peoples). In 107 patients who have high blood pressure(≥140/90 mmHg) or look like obesity underwent laboratory testing, the subjects who had results for the level of the random glucose, creatine, total cholesterol, TG, HDL, and LDL levels were selected. As a result, the subjects consisted of 58 Uzbekistan subjects (45 females and 13 males) who were recruited from EMC patients (Fig. 1).

2. Baseline data and data collection

The blood pressure of each participant was measured using an automatic sphygmomanometer. The blood pressure was measured again when the blood pressure was high (≥140/90 mmHg). The second blood pressure was measured using a mercurial sphygmomanometer in the sitting position. Two measurements of the SBP and DBP were taken at an interval of at least 10 min between measurements. The American College of Cardiology/American Heart Association blood pressure 2017 guidelines for hypertension were used to define hypertension as a blood pressure [8] above cut offs of 130 and 80 mmHg for the SBP and DBPs, respectively, to define hypertension.
Blood samples were collected from the patients for the lipid profile (total cholesterol, TGs, HDL, and LDL), random glucose, and creatinine levels. The levels were measured using discrete type clinical chemistry automated analyzers (Samsung LabgeoPT biochemistry test 9; Samsung, Seoul, Korea). Patients were not in a fasting state. For a non-fasting state, a high total cholesterol was defined as a cholesterol level of more than or equal to 190 mg/dL, while a high TG level was more than or equal to 175 mg/dL [9]. A high non-fasting HDL cholesterol level was more than or equal to 115 and a high non-fasting LDL cholesterol level below or equal to 40 mg/dL [10].
The American Diabetes Association classification of a high glucose level was used to define hyperglycemia. The reference value for a normal random glucose test in an average adult is 79 to 160 mg/dL, between 160 and 200 mg/dL is considered prediabetes, and >200 mg/dL is considered diabetes according to the American Diabetes Association guidelines [11].

3. Statistical analysis

The continuous variables are presented as the mean±SD, whereas categorical variables are presented as counts and percentages. All analyses were carried out separately for the adult males and females. The following characteristics of the subjects were included in the multivariate models: the age, sex, SBP, DBP, and random glucose and creatinine levels. To assess the differences in the lipid level within the hypertension group and lipid level within the non-hypertension group, paired t tests were used for the group means and a chi-square or Fisher’s exact test for categorical variables. A multiple logistic regression analysis was performed to determine the independent predictors using covariates identified as significant in the univariate analysis or previously known to be important variables. A P<0.05 was considered to be statistically significant.

Results

1. Baseline characteristics

The baseline characteristics of the study population are shown in Table 1. The mean age of the study population (n=58) was 49.4±13.0 years, with 77.6% being females and 22.4% being males. The mean (±SD) SBP and DBP were 145.2±24.4 and 89.0±16.4 mmHg, respectively. The lowest SBP was 107 mmHg while the highest was 210 mmHg. The lowest DBP was 53 mmHg while the highest was 136 mmHg. In general, participants with a lower DBP tended to be older, had a lower baseline SBP and a higher PP. The means (±SD) random glucose level was 108.4±28.6 (mg/dL). The mean (±SD) creatine level was 0.9±0.2 (mg/dL). The mean (±SD) total cholesterol, TG, HDL, and LDL levels were 168.2±34.3, 160.5±80.1, 49.1±9.8, and 86.9±28.6, respectively (mg/dL).
The results varied by region. The mean age of the study population in Andijan (n=33) was 51.9±12.2 years and that in Syrdarya (n=25) 46.2±13.5 years. The mean (±SD) SBP in Andijan was 145.0±24.3 mmHg and that in Syrdarya 145.4±25.0 mmHg, respectively.

2. Blood pressure and lipid profiles

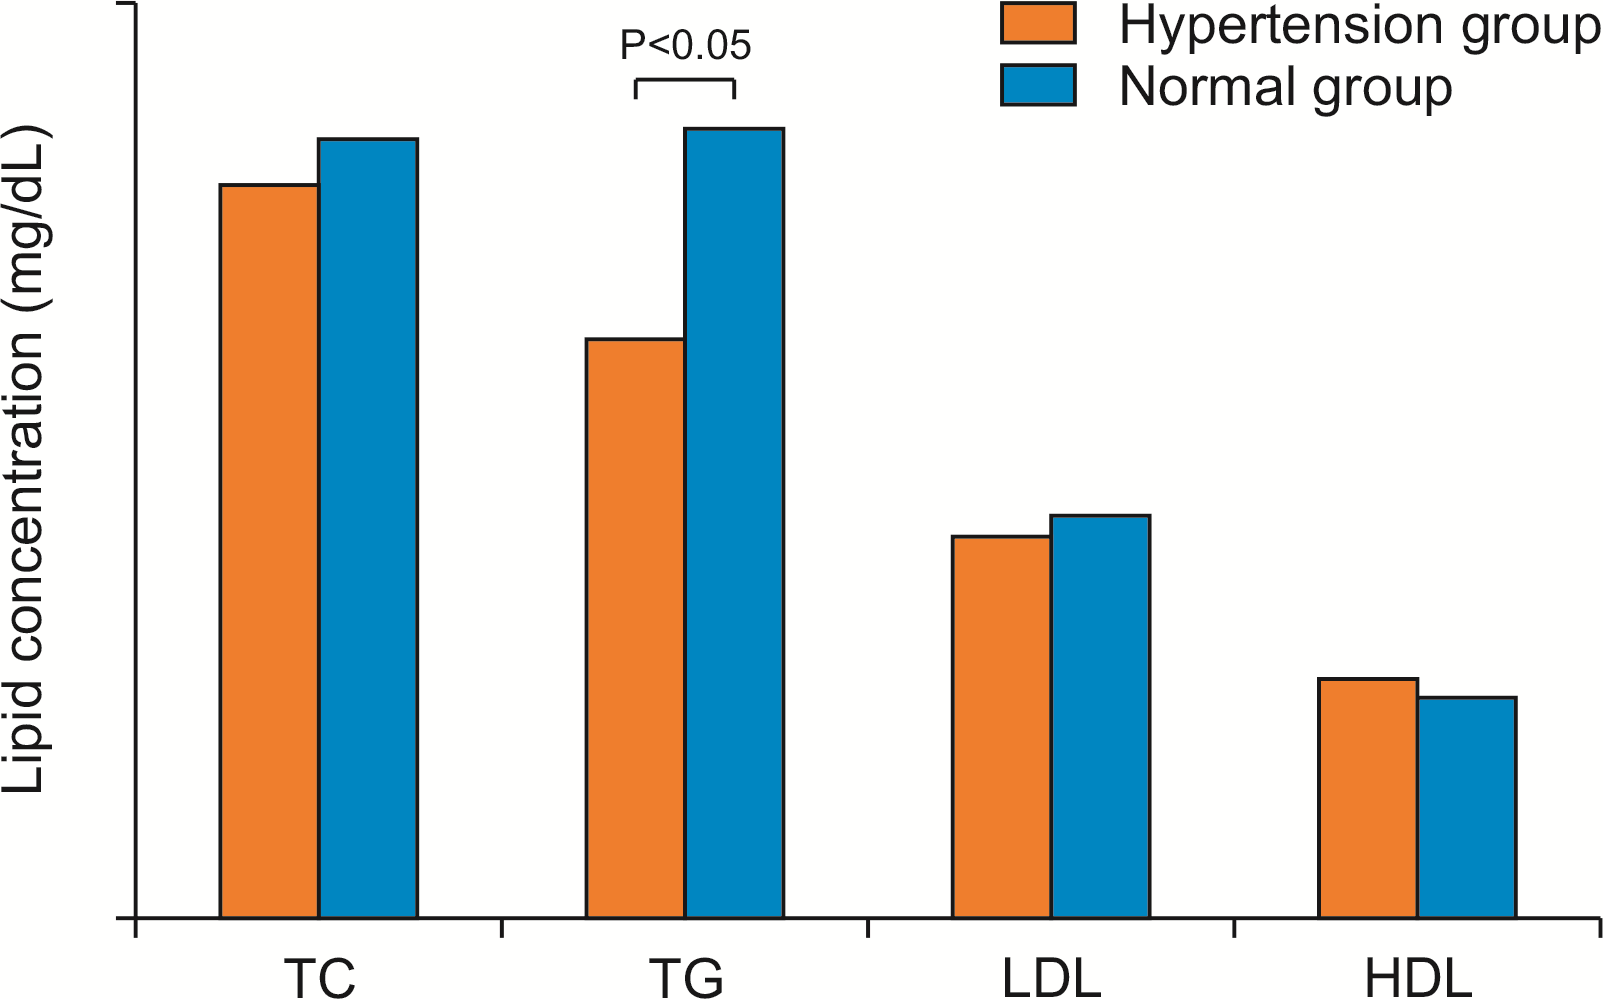
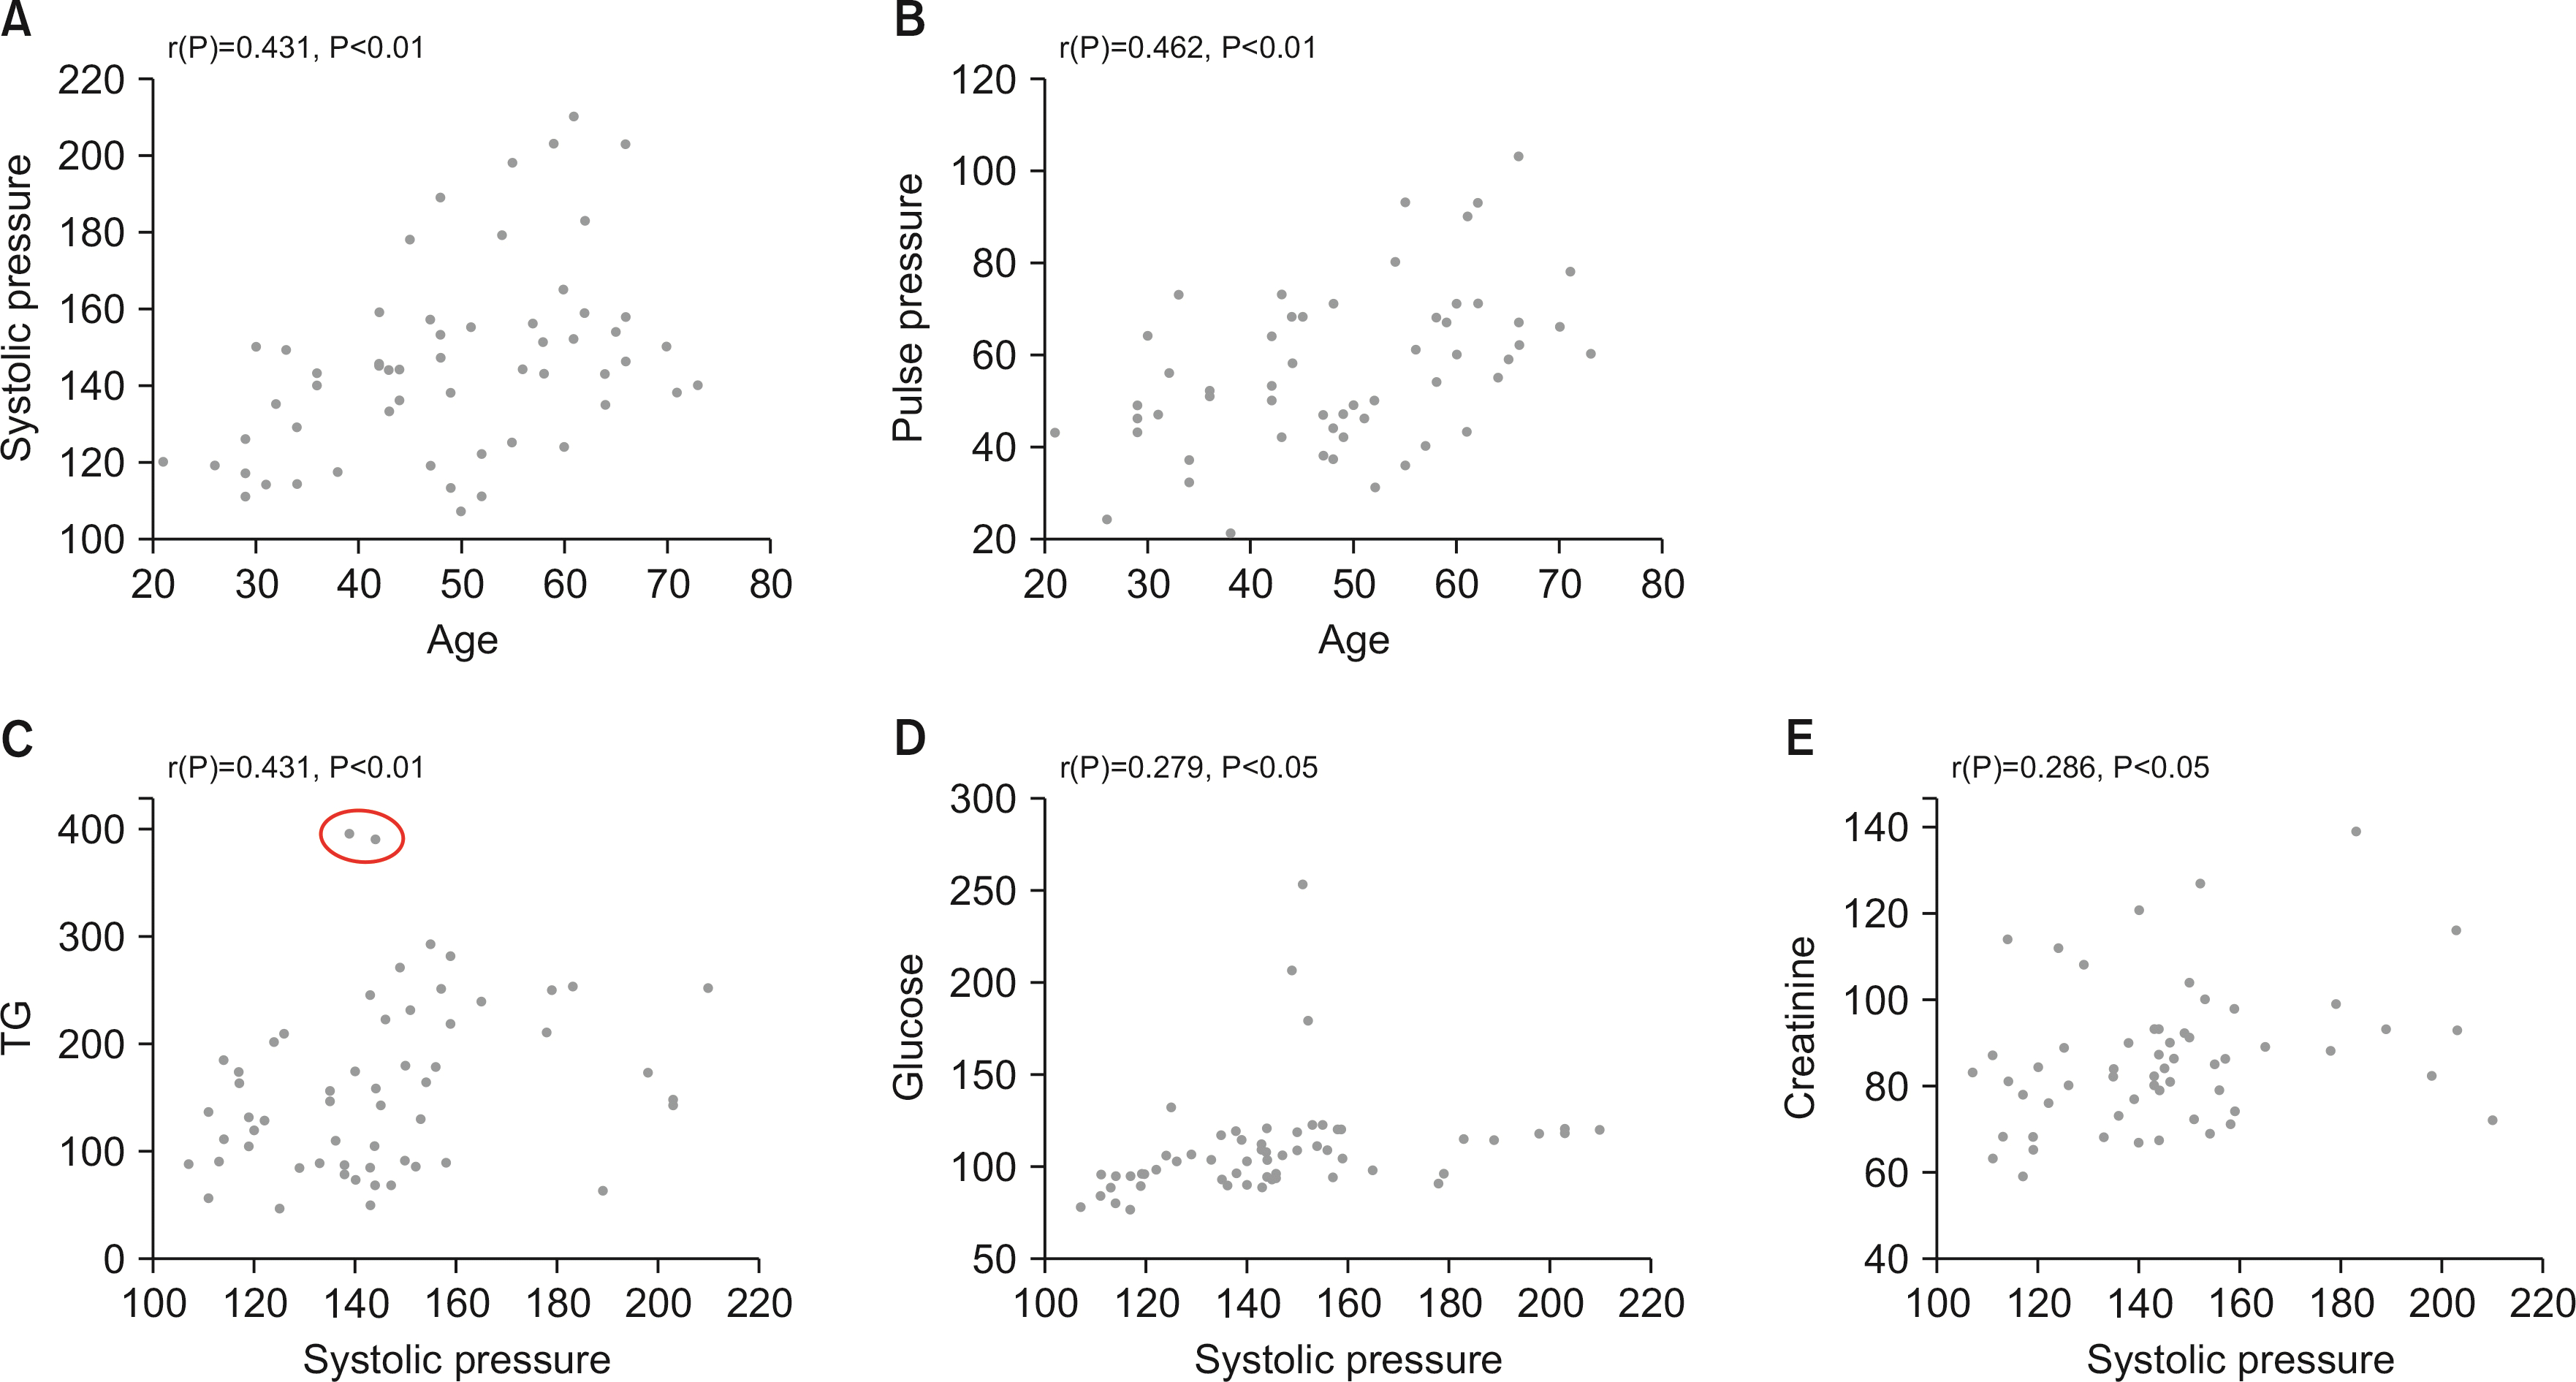
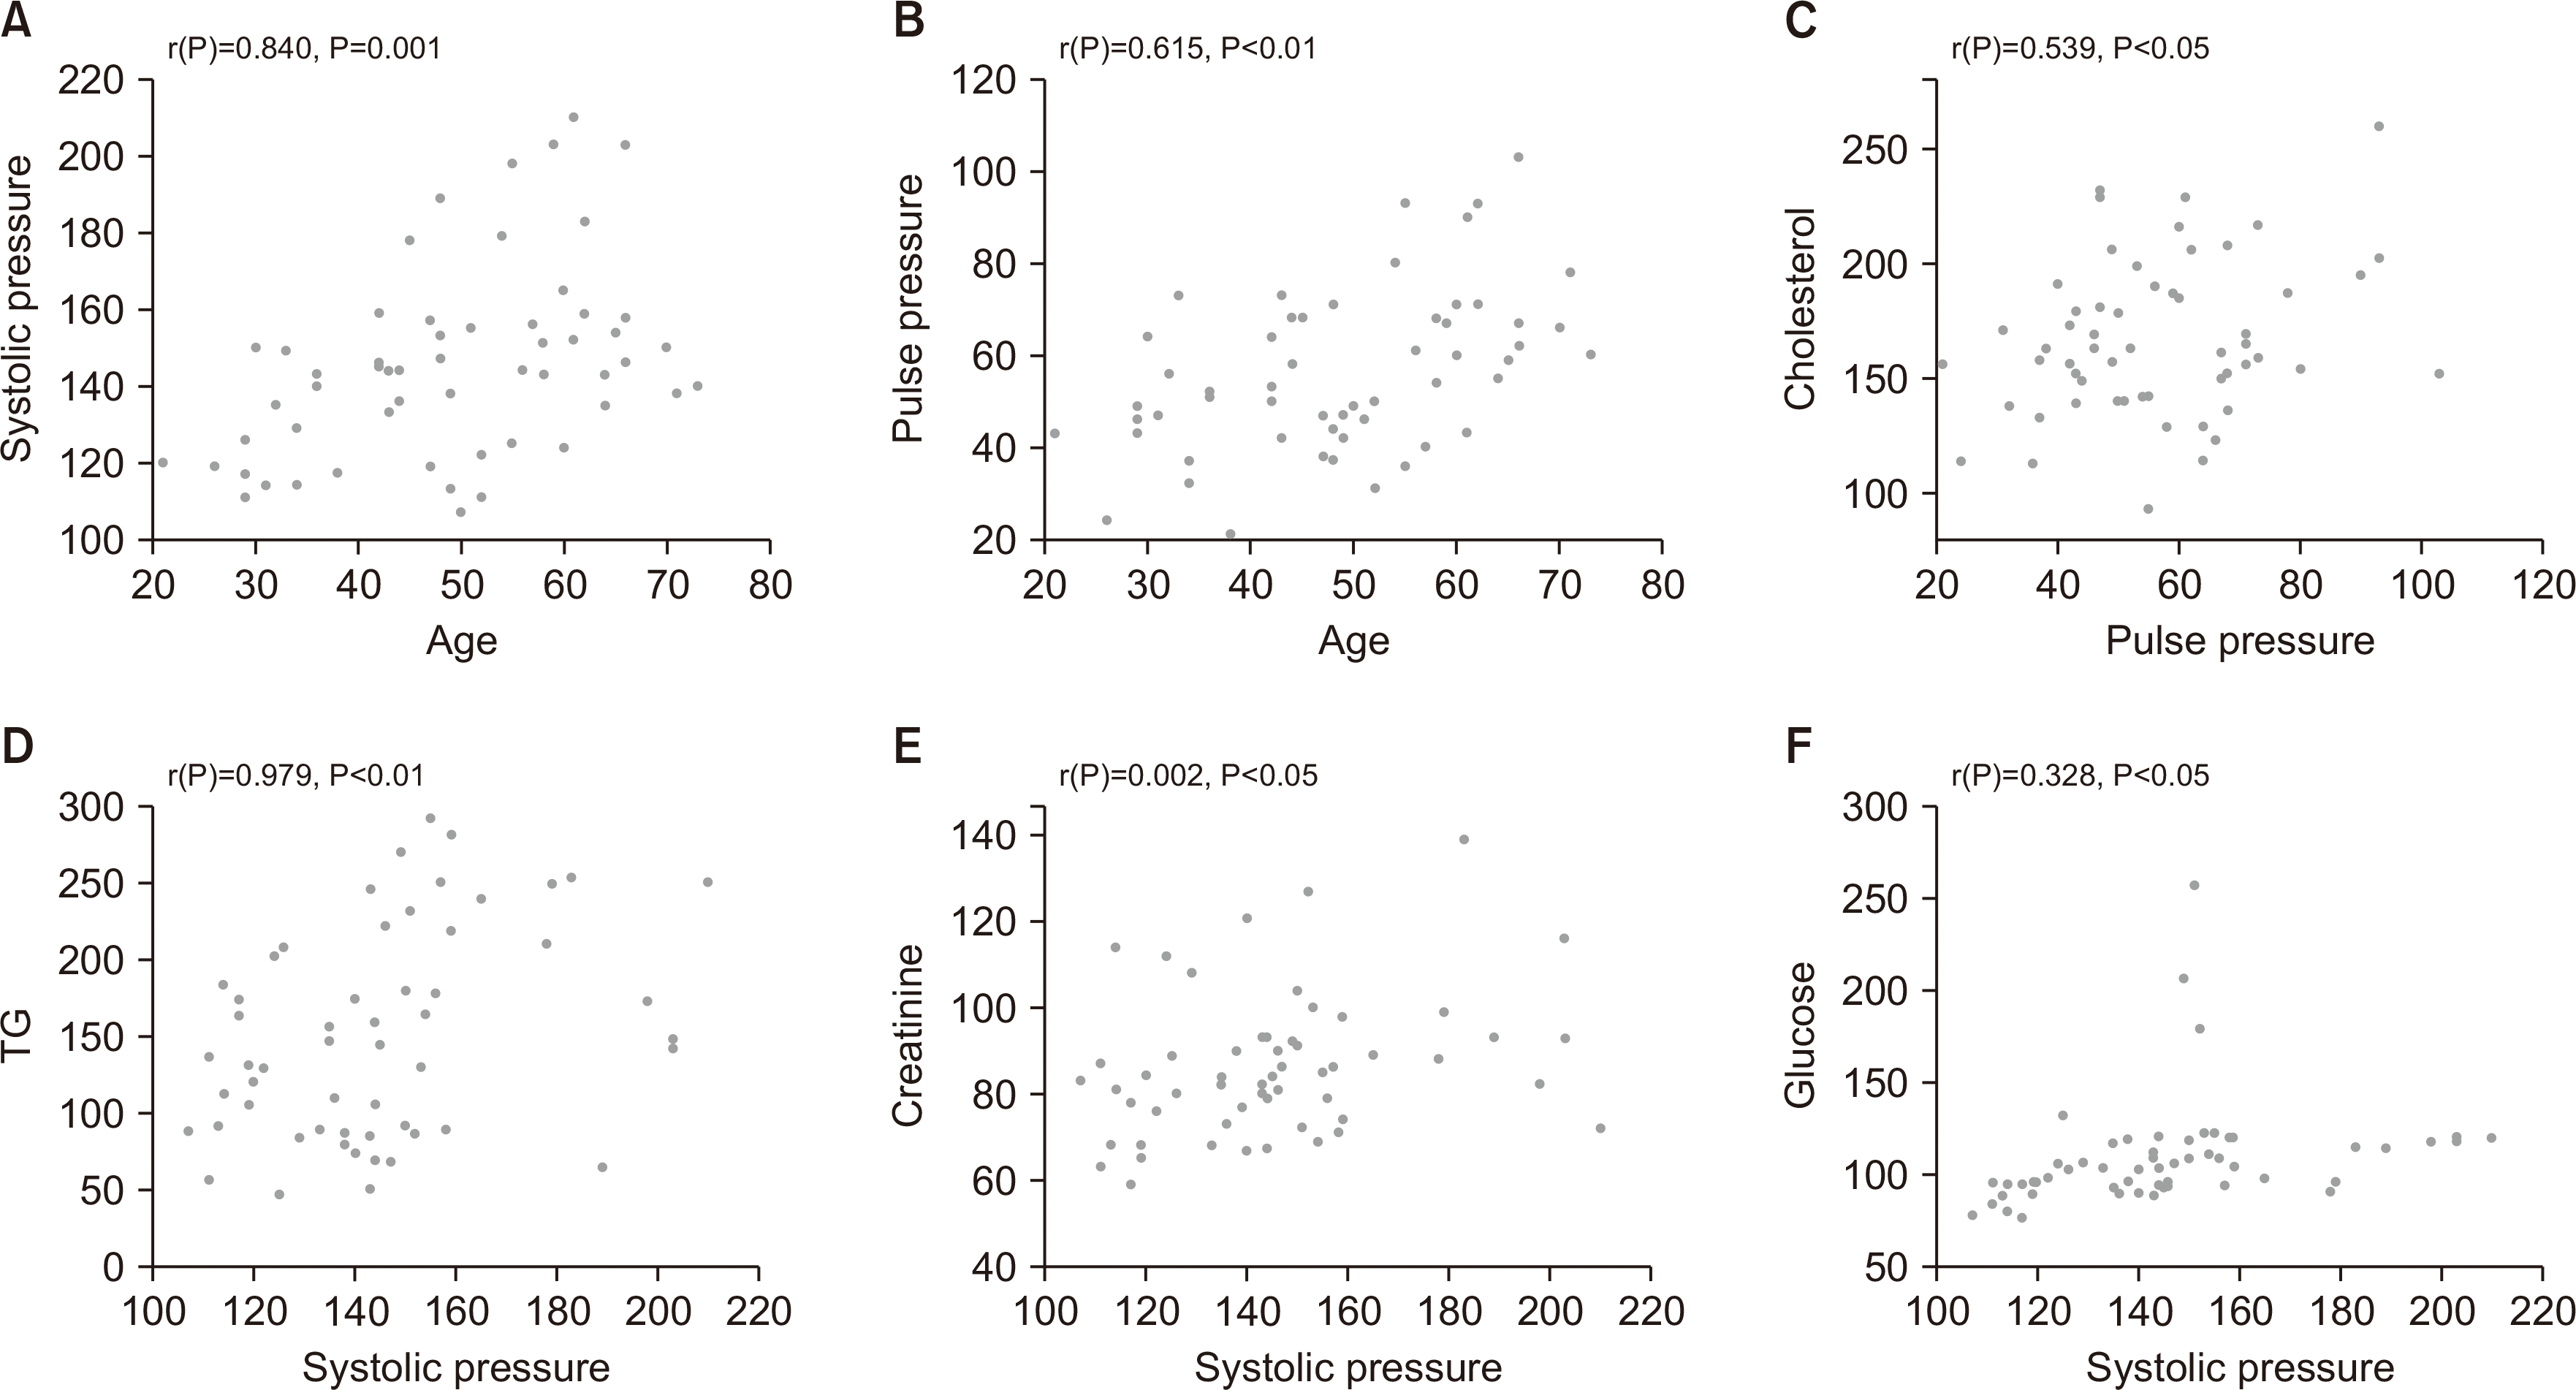
Among the 58 patients constituting the baseline population, 42 patients are diagnosed hypertension (Fig. 1). The lipid concentrations in the hypertension patients was likely to be higher than that in the normal patients (Fig. 2). Among them, the TG level was significantly higher in the hypertension group than normal group (173.19 vs. 127.06 mg/dL, P=0.014) (Fig. 2). A Pearson correlation analysis revealed that old aged patients had a higher SBP (r=0.431, P<0.01) and PP (r=0.462, P<0.01). Moreover, the SBP had a positive correlation with the TG (r=0.281, P<0.05) and creatinine (r=0.286, P<0.05) levels. First, in the Pearson correlation analysis between the SBP and TG level, we found two outliers (Fig. 3). Therefore, to find a strong relationship, we analyzed the Pearson correlation data except for the two outliers. As a result, the SBP had a positive correlation with the TG (r=0.979, P<0.01) and creatinine (r=0.002, P<0.05) levels, and also the PP had a positive correlation with the cholesterol level (r=0.539, P<0.05) (Fig. 4).

3. Univariate and multivariate analysis

The difference in the Pearson correlation before and after excluding the two outliers was the same as the positive correlation (P<0.05). The Pearson correlation analysis revealed that the correlation between the SBP and TG was significant (P<0.05). A multivariate analysis (adjusted for the age and sex) indicated that there was a positive correlation between the SBP and TG level (r=0.941, P<0.05) (Table 2).

Discussion

There are few studies characterizing the prevalence of hypertension and obesity and risk factors of CVD in Uzbekistan. Nevertheless, one study shows that strong positive association between obesity and hypertension in adult in Uzbekistan [12]. Other study aimed at hypertension in Uzbekistan revealed that rates of hypertension among females aged 15 to 49 years and males aged 15 to 59 years were 7% to 8% respectively [13]. Seventy-four percent of females had a blood pressure reading in the optimal range (<120/80 mmHg) compared to 48% of males [13].
We investigated the relationship between the blood pressure and age. The data from our study revealed that the SBP and PP was proportional to the age in Uzbekistan subjects. Previous studies indicated that age is the main determinant of large artery stiffness and a significant predictor of hypertension [14]. Furthermore, previous studies demonstrate that artery stiffness with aging is accompanied by an elevation in the SBP and PP [15]. Increasing arterial stiffening and an elevating SBP and PP have a higher risk of developing CVD [16-20].
A high blood pressure is an important independent predictor of the development and progression of chronic renal disease as well as morbidity and mortality in patients with chronic renal disease [21,22]. Serum creatinine measurements can be used to define chronic renal disease. In our study, the correlation between the SBP and serum creatinine level supported that patients in Uzbekistan that also had a higher SBP have a higher creatinine level.
In another cohort study, when the SBP was higher than 20 mmHg and DBP higher than 10 mmHg, there was a higher risk of developing new-onset diabetes (58% and 53%, respectively). In the present study, we also observed a positive correlation between the SBP and glucose level [23].
In our study, the correlation between the SBP and TG level was significant (P<0.005). That finding correlated with another study showing that the TG level is associated with the blood pressure. Abnormal TG level can physiologically lead to endothelial dysfunction, arterial stiffness, and a loss of vasomotor reactivity. These results may induce to elevate the blood pressure [24,25]. Furthermore, Fadini et al. [26] reported that low expression of CD34+ of progenitor cells was associated with CVD in metabolic syndrome patients. Hill et al. [27] also reported that levels of endothelial progenitor cells may be biologic marker for CVD risks and low level of progenitor cells may affect the progression of CVD.
In the recent REDUCE-IT study, it was found that a cardiovascular risk reduction with icosapent ethyl for hypertriglyceridemia [28], which means lowering the TG level, leads to a lowering of the cardiovascular risk. One of the cardiovascular risk factors was the blood pressure and there was a relationship between the SBP and TG level. The understanding of hypertension and hyperlipidemia is very difficult to achieve since these are multifactorial diseases. Despite these difficulties, a century of epidemiological and clinical research has provided a relationship between the sodium intake and blood pressure. A chronic high salt intake increases the blood pressure [29]. The average level of dietary salt intake by adults in Uzbekistan is 14.9 g/day, regardless of the sex. This is almost 3 times higher than the World Health Organization recommendation of less than 5 g/day [2]. It was correlated with our results.
Some limitations should be noted in this study. The weight and height of the participants in this study could not be measured due to the lack of the source. We could not measure the fasting glucose to define hyperglycemia or diabetes, so the random glucose was replaced. Although the serum level of the lipid profiles was affected depending on a fasting status or not, we could not acquire the serum level of the lipid profile in a fasting state. Moreover, our sample size was too small to find any correlation that was statistically significant, and there was no follow up data of the patients. This is not prospective study, just retrospective. And due to local characteristics, we have some limitation on acquiring enough patients’ data. So this database has a lot of exclusion.
In conclusion, we diagnosed hypertension in 42 patients among 58 patient population and their TG levels were significantly higher than that in the normal population. In the Pearson correlation and multivariate analysis (adjusted for the age and sex), the SBP and TG level had a positive correlation.

Acknowledgments

This work is supported by Ewha Medical Care. We thank all members of the Ewha Medical Care team and Uzbekistan patients for their help.

REFERENCES

1. World Health Organization. 2018. The top 10 causes of death. World Health Organization;Geneva:
2. World Health Organization. 2015. Uzbekistan: WHO statistical profile. World Health Organization;Geneva:
3. McKee PA, Castelli WP, McNamara PM, Kannel WB. 1971; The natural history of congestive heart failure: the Framingham study. N Engl J Med. 285:1441–1446. DOI: 10.1056/NEJM197112232852601. PMID: 5122894.
crossref
4. Gordon T, Castelli WP, Hjortland MC, Kannel WB, Dawber TR. 1977; High density lipoprotein as a protective factor against coronary heart disease: the Framingham Study. Am J Med. 62:707–714. DOI: 10.1016/0002-9343(77)90874-9. PMID: 193398.
pmid
5. Williams RR, Hunt SC, Hopkins PN, Stults BM, Wu LL, Hasstedt SJ, et al. 1988; Familial dyslipidemic hypertension. Evidence from 58 Utah families for a syndrome present in approximately 12% of patients with essential hypertension. JAMA. 259:3579–3586. DOI: 10.1001/jama.1988.03720240041032. PMID: 3373705.
crossref
6. Halonen JI, Zanobetti A, Sparrow D, Vokonas PS, Schwartz J. 2011; Outdoor temperature is associated with serum HDL and LDL. Environ Res. 111:281–287. DOI: 10.1016/j.envres.2010.12.001. PMID: 21172696. PMCID: PMC4437587.
crossref pmid
7. World Meteorological Organization. c2020. World weather information service: Tashkent, Uzbekistan [Internet]. World Meteorological Organization;Geneva: Available from: https://worldweather.wmo.int/en/city.html?.cityId=115. cited 2020 Jun 18.
8. Whelton PK, Carey RM, Aronow WS, Casey DE Jr, Collins KJ, Dennison Himmelfarb C, et al. 2018; 2017 ACC/AHA/AAPA/ABC/ACPM/AGS/APhA/ASH/ASPC/NMA/PCNA guideline for the prevention, detection, evaluation, and management of high blood pressure in adults: a report of the American College of Cardiology/American Heart Association Task Force on Clinical Practice Guidelines. Hypertension. 71:e13–e115. DOI: 10.1161/HYP.0000000000000065. PMCID: PMC5945323. PMID: 29133356.
crossref
9. White KT, Moorthy MV, Akinkuolie AO, Demler O, Ridker PM, Cook NR, et al. 2015; Identifying an optimal cutpoint for the diagnosis of hypertriglyceridemia in the nonfasting state. Clin Chem. 61:1156–1163. DOI: 10.1373/clinchem.2015.241752. PMID: 26071491. PMCID: PMC4554926.
crossref pmid pmc
10. Nordestgaard BG, Langsted A, Mora S, Kolovou G, Baum H, Bruckert E, et al. 2016; Fasting is not routinely required for determination of a lipid profile: clinical and laboratory implications including flagging at desirable concentration cut-points-a joint consensus statement from the European Atherosclerosis Society and European Federation of Clinical Chemistry and Laboratory Medicine. Eur Heart J. 37:1944–1958. DOI: 10.1093/eurheartj/ehw152. PMID: 27122601. PMCID: PMC4929379.
crossref pmid pmc
11. American Diabetes Association. 2014; Diagnosis and classification of diabetes mellitus. Diabetes Care. 37(Suppl 1):S81–S90. DOI: 10.2337/dc14-S081. PMID: 24357215.
12. Mishra V, Arnold F, Semenov G, Hong R, Mukuria A. 2006; Epidemiology of obesity and hypertension and related risk factors in Uzbekistan. Eur J Clin Nutr. 60:1355–1366. DOI: 10.1038/sj.ejcn.1602465. PMID: 16788710.
crossref pmid
13. Aringazina A, Kuandikov T, Arkhipov V. 2018; Burden of the cardiovascular diseases in Central Asia. Cent Asian J Glob Health. 7:321. DOI: 10.5195/CAJGH.2018.321. PMID: 30863664. PMCID: PMC6393056.
crossref pmid pmc
14. Parikh NI, Pencina MJ, Wang TJ, Benjamin EJ, Lanier KJ, Levy D, et al. 2008; A risk score for predicting near-term incidence of hypertension: the Framingham Heart Study. Ann Intern Med. 148:102–110. DOI: 10.7326/0003-4819-148-2-200801150-00005. PMID: 18195335.
crossref pmid
15. Benetos A, Waeber B, Izzo J, Mitchell G, Resnick L, Asmar R, et al. 2002; Influence of age, risk factors, and cardiovascular and renal disease on arterial stiffness: clinical applications. Am J Hypertens. 15:1101–1108. DOI: 10.1016/S0895-7061(02)03029-7. PMID: 12460708.
crossref pmid
16. Benetos A, Safar M, Rudnichi A, Smulyan H, Richard JL, Ducimetieere P, et al. 1997; Pulse pressure: a predictor of long-term cardiovascular mortality in a French male population. Hypertension. 30:1410–1415. DOI: 10.1161/01.HYP.30.6.1410. PMID: 9403561.
pmid
17. Mitchell GF, Moye LA, Braunwald E, Rouleau JL, Bernstein V, Geltman EM, et al. 1997; Sphygmomanometrically determined pulse pressure is a powerful independent predictor of recurrent events after myocardial infarction in patients with impaired left ventricular function. SAVE investigators. Survival and Ventricular Enlargement. Circulation. 96:4254–4260. DOI: 10.1161/01.CIR.96.12.4254. PMID: 9416890.
pmid
18. Franklin SS, Khan SA, Wong ND, Larson MG, Levy D. 1999; Is pulse pressure useful in predicting risk for coronary heart Disease? The Framingham heart study. Circulation. 100:354–360. DOI: 10.1161/01.CIR.100.4.354. PMID: 10421594.
pmid
19. Benetos A, Zureik M, Morcet J, Thomas F, Bean K, Safar M, et al. 2000; A decrease in diastolic blood pressure combined with an increase in systolic blood pressure is associated with a higher cardiovascular mortality in men. J Am Coll Cardiol. 35:673–680. DOI: 10.1016/S0735-1097(99)00586-0. PMID: 10716470.
crossref pmid
20. Laurent S, Boutouyrie P, Asmar R, Gautier I, Laloux B, Guize L, et al. 2001; Aortic stiffness is an independent predictor of all-cause and cardiovascular mortality in hypertensive patients. Hypertension. 37:1236–1241. DOI: 10.1161/01.HYP.37.5.1236. PMID: 11358934.
crossref pmid
21. Perry HM Jr, Miller JP, Fornoff JR, Baty JD, Sambhi MP, Rutan G, et al. 1995; Early predictors of 15-year end-stage renal disease in hypertensive patients. Hypertension. 25(4 Pt 1):587–594. DOI: 10.1161/01.HYP.25.4.587. PMID: 7721402.
crossref pmid
22. Klag MJ, Whelton PK, Randall BL, Neaton JD, Brancati FL, Ford CE, et al. 1996; Blood pressure and end-stage renal disease in men. N Engl J Med. 334:13–18. DOI: 10.1056/NEJM199601043340103. PMID: 7494564.
crossref
23. Emdin CA, Anderson SG, Woodward M, Rahimi K. 2015; Usual blood pressure and risk of new-onset diabetes: evidence from 4.1 million adults and a meta-analysis of prospective studies. J Am Coll Cardiol. 66:1552–1562. DOI: 10.1016/j.jacc.2015.07.059. PMID: 26429079. PMCID: PMC4595710.
pmid pmc
24. McCarty MF. 2003; Does postprandial storage of triglycerides in endothelial cells contribute to the endothelial dysfunction associated with insulin resistance and fatty diets? Med Hypotheses. 61:167–172. DOI: 10.1016/S0306-9877(02)00236-0. PMID: 12888297.
crossref pmid
25. Lundman P, Eriksson M, Schenck-Gustafsson K, Karpe F, Tornvall P. 1997; Transient triglyceridemia decreases vascular reactivity in young, healthy men without risk factors for coronary heart disease. Circulation. 96:3266–3268. DOI: 10.1161/01.CIR.96.10.3266. PMID: 9396413.
crossref pmid
26. Fadini GP, de Kreutzenberg S, Agostini C, Boscaro E, Tiengo A, Dimmeler S, et al. 2009; Low CD34+ cell count and metabolic syndrome synergistically increase the risk of adverse outcomes. Atherosclerosis. 207:213–219. DOI: 10.1016/j.atherosclerosis.2009.03.040. PMID: 19406403.
crossref pmid
27. Hill JM, Zalos G, Halcox JP, Schenke WH, Waclawiw MA, Quyyumi AA, et al. 2003; Circulating endothelial progenitor cells, vascular function, and cardiovascular risk. N Engl J Med. 348:593–600. DOI: 10.1056/NEJMoa022287. PMID: 12584367.
crossref
28. Bhatt DL, Steg PG, Miller M, Brinton EA, Jacobson TA, Ketchum SB, et al. 2019; Cardiovascular risk reduction with icosapent ethyl for hypertriglyceridemia. N Engl J Med. 380:11–22. DOI: 10.1056/NEJMoa1812792. PMID: 30415628.
crossref
29. Meneton P, Jeunemaitre X, de Wardener HE, MacGregor GA. 2005; Links between dietary salt intake, renal salt handling, blood pressure, and cardiovascular diseases. Physiol Rev. 85:679–715. DOI: 10.1152/physrev.00056.2003. PMID: 15788708.
crossref pmid

Fig. 1
The flow chart of study. EMC, Ewha Medical Care.
emj-44-1-19-f1.tif
Fig. 2
The difference of dyslipidemia in subjects with or without hypertension. TC, total cholesterol; TG, triglyceride; LDL, low-density lipoprotein; HDL, high-density lipoprotein. Hypertension group, Normal group.
emj-44-1-19-f2.tif
Fig. 3
The correlation between blood pressure and various profiles (n=58). (A) Correlation between age and systolic blood pressure (SBP), (B) correlation between age and pulse pressure (PP), (C) correlation between SBP and triglyceride (TG), (D) correlation between SBP and glucose, and (E) correlation between SBP and creatinine. Red circle: in the Pearson correlation analysis between the SBP and TG level, we found two outliers.
emj-44-1-19-f3.tif
Fig. 4
The correlation between blood pressure and various profiles except for the two outliers (n=56). (A) Correlation between age and systolic blood pressure (SBP), (B) correlation between age and pulse pressure (PP), (C) correlation between PP and cholesterol, (D) correlation between SBP and triglyceride (TG), (E) correlation between SBP and creatinine, and (F) correlation between SBP and glucose.
emj-44-1-19-f4.tif
Table 1
Baseline characteristics of the study population by sex and region
Total (n=58) Andijan (n=33) Syrdarya (n=25)


Female (n=45) Male (n=13) Total Female Male Total Female Male Total
Age (yr) 48.80±12.60 51.62±14.60 49.4±13.0 52.5±11.9 49.2±14.3 51.9±12.2 43.2±11,7 53.7±45.7 46.2±13.5
Blood pressure (mmHg)
SBP 143.6±24.9 150.8±22.6 145.2±24.4 144.8±24.7 146.0±24.4 145.0±24.3 141.7±25.7 155.0±21.9 145.4±25.0
DBP 88.1±15.3 92.0±20.4 89.0±16.4 87.7±16.5 88.2±20.7 87.8±17.0 88.7±13.5 95.3±21.1 90.6±15.8
PP 55.5±17.3 58.8±16.0 56.2±16.9 57.1±16.0 57.8±22.5 57.3±16.9 53.0±19.2 59.7±9.5 54.9±17.1
Glucose (random) 104.6±26.2 121.4±33.4 198.4±28.6 108.3±32.2 120.3±30.2 110.5±31.7 99.1±12.1 122.3±38.4 105.6±24.2
Creatinine 0.8±0.1 1.1±0.2 0.9±0.2 0.8±0.1 1.1±0.2 0.9±0.2 0.8±0.1 1.0±0.2 0.9±0.1
Total cholesterol 168.6±33.4 166.7±38.8 168.2±34.3 174.5±34.0 157.8±31.1 171.5±33.7 159.8±31.2 174.3±45.3 163.8±35.3
Triglycride 157.2±83.5 171.6±68.6 160.5±80.1 159.0±93.5 146.0±67.4 156.6±88.5 154.7±68.4 193.6±66.4 165.6±68.8
HDL 50.2±10.2 45.3±7.4 49.1±9.8 49.6±10.3 45.8±7.4 48.9±9.9 51.2±10.2 44.9±7.9 49.4±10.0
LDL 86.9±28.3 87.2±30.7 86.9±28.6 93.0±27.2 83.2±24.3 91.2±26.6 77.6±28.3 90.6±37.0 81.2±30.7

SBP, systolic blood pressure; DBP, diastolic blood pressure; HDL, high density lipoprotein; LDL, low density lipoprotein.

Table 2
Multivariate analysis between TG and age, sex, SBP, DBP, and PP
TG (n=56)
r(P)
Age and sex adjusted TG (n=56)
B(P)
Age 0.221 (0.096) -
Male 0.013 (0.924) -
SBP 0.281 (0.032)* 0.941 (0.020)*
DBP 0.152 (0.256) -
PP 0.258 (0.050) -

Hierarchical analysis between SBP and TG level (age and sex adjusted).

TG, triglyceride; SBP, systolic blood pressure; DBP, diastolic blood pressure; PP, pulse pressure.

*Correlation is significant at the 0.05 level (two-tailed).

TOOLS
Similar articles