

 PDF
PDF Citation
 Print
Print


INTRODUCTION
Chocolate is a highly popular food that is considered an “energy-dense nutrient-poor snack” because of high levels of added sugars and saturated fats [1]. However, recent evidence from intervention trials have reported that intake of chocolate resulted in decreased blood pressure [2], increased high-density lipoprotein (HDL) cholesterol concentration [3], and improved insulin sensitivity [4], which have been suggested to be due to the antioxidant effects of flavonoids in cocoa of chocolate [56]. Furthermore, recent epidemiologic observational studies have reported chocolate consumption is associated with lower risks of metabolic diseases, such as cardiovascular disease [78] and diabetes [910]. However, these observational trials are limited because commercially available chocolates contains not only cacao but also other ingredients (e.g., sugar, milk, nuts etc.). Although attempts have been made to address this issue [11121314], it has not been resolved.
Metabolic syndrome (MetS) is a cluster of risk factors of cardiovascular disease and diabetes and is characterized by abdominal obesity, high fasting glucose level, high triglyceride, low HDL cholesterol, and high blood pressure [15]. Although the etiology of MetS remains unclear, it is known to be associated with interactions between genetic and lifestyle-associated environmental risk factors, and of the modifiable environmental factors, diet is considered of prime importance for the prevention and treatment of MetS [16]. Therefore, it is important that dietary risk factors and beneficial foods that could help reduce the risk of MetS be identified.
In Korea, the prevalence of MetS and chocolate intake have steadily increased [1718]. However, the majority of previous epidemiology studies on chocolate consumption have performed in the US and Europe where chocolate intake is relatively high, and results obtained may not be applicable in Asian populations [1920]. Therefore, we investigated the relationship between chocolate consumption and the prevalence of MetS in Korean adults using the 2014–2016 Korea National Health and Nutrition Examination Survey (KNHANES) in the hope that the results obtained would aid the development of disease prevention strategies.
Go to : 
SUBJECTS AND METHODS
Study design and population
The KNHANES is an annual nationwide cross-sectional survey conducted with the aim of providing reliable information on nutrition and health-related data. The design of KNHANES and the methods used have been previously described in detail [21]. In brief, each survey includes a sample of about 10,000 individuals and involves; 1) a health interview, 2) a health examination and 3) a nutrition survey.
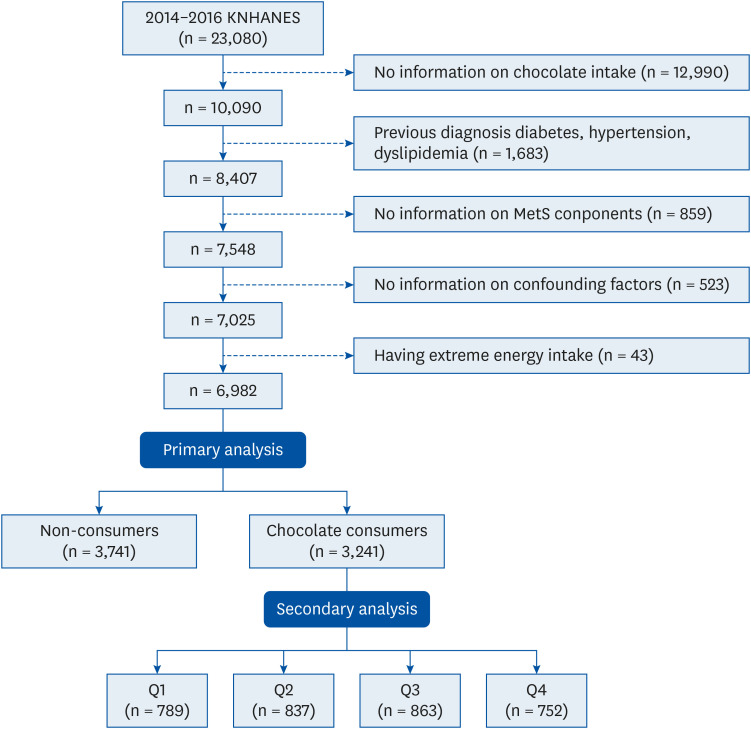
We analyzed KNHANES data obtained during the three year periods from January 2014 to December 2016, including 23,080 subjects (10,431 men and 12,649 women). Of these, 16,098 were excluded from the analysis because they; 1) did not provide information on chocolate intake (n = 12,990), 2) had a history of diabetes, hypertension, or dyslipidemia (n = 1,683), 3) were not assessed for components of metabolic syndrome (n = 859), 4) did not provide information on major residual confounding factors (n = 523) and 5) had an extreme energy intake (< 500 kcal/day or > 5,000 kcal/day) (n = 43). As a result, 6,982 individuals (2,659 men and 4,323 women) were included in this study (Fig. 1).
Ethical approval
The 2014 KNHANES protocol was approved by the Institutional Review Board of the Korea Centers for Disease Control and Prevention (2013-12EXP-03-5C), whereas the 2015 and 2016 KNHANES protocols were exempted from research ethics review in accord with the Bioethics and Safety Act. Written informed consent was obtained from all participants.
Chocolate consumption
Chocolate consumption was the exposure variable in all analyses. The self-administered food-frequency questionnaire (FFQ) was used to obtain information on habitual chocolate consumption. Subjects were asked to report chocolate consumption frequencies (never, 1/month, 2–3/month, 1/week, 2–4/week, 5–6/week, 1/day, 2/day, 3+/day) and portion sizes (0 g, 5.5 g, 11 g, or 22 g) over the previous year. This item did not differentiate between different types of chocolate (dark, milk, and white). For the primary analysis, we divided subjects into two groups, that is, a non-consumer group (n = 3,741, 53.6%) and a consumer group (n = 3,241, 46.4%). In order to investigate dose-response effects on MetS, we conducted secondary analysis on chocolate consumers by categorizing them by median chocolate intake (g/week) quartiles: Q1 (n = 789, 24.3%, median intake = 2.5 g/week); Q2 (n = 837, 25.8%, median intake = 3.8 g/week); Q3 (n = 863, 26.6%, median intake = 9.6 g/week); Q4 (n = 752, 23.2%, median intake = 33.0 g/week). We excluded non-consumers in the secondary analysis in order to provide adequate statistical power for subgroup analyses. The validity and reproducibility of FFQ have been previously reported [22].
MetS
The main outcome of the present study was the prevalence of MetS. We applied the definition of MetS suggested by the Adult Treatment Panel III of the National Cholesterol Education Program [15] and used the modified abdominal obesity cutoff for Korean adults [23]. MetS was defined as the presence of three or more of the following components; 1) waist circumference (WC) ≥ 90 cm for men and ≥ 85 cm for women; 2) triglyceride (TG) ≥ 150 mg/dL or treatment for dyslipidemia; 3) HDL cholesterol < 40 mg/dL for men and < 50 mg/dL for women or treatment of dyslipidemia; 4) systolic blood pressure (SBP) ≥ 130 mmHg or diastolic blood pressure (DBP) ≥ 85 mmHg or antihypertensive treatment; and 5) fasting glucose level (FGL) ≥ 100 mg/dL or treatment for diabetes. In order to collect information about MetS, we used health examination data, which included anthropometric measurements and biochemical test results. WCs were measured at midpoints between rib cages and iliac crests in the standing position. Blood pressure measurements were taken three times and averages of second and third measurements of SBP and DBP were used. Blood samples were collected during mornings after an overnight fast, and serum concentrations of glucose, HDL cholesterol, and TG were measured.
Covariates
In order to determine the independence of the relationship between chocolate consumption and MetS, potential confounders such as socio-demographics, anthropometric profiles, and health-related behaviors previously identified as risk factors of MetS were included in the analysis. Information on gender, age, income level, education, physical activity, smoking status, current alcohol use, and subjective health and stress statuses were obtained by questionnaire during health interviews. Heights were measured to within 0.1 cm, and weights to the nearest 0.1 kg with subjects wearing light clothing without shoes during health examination. Body mass index (BMI), which was viewed as a crucial confounder, was calculated by dividing body weight in kilograms by height in meters squared (kg/m2). Data about dietary behaviors (skipping breakfast, use of nutrition labels, a nutrition education), nutrient intake variables (g/day), and food group variables (times/week) were collected using the nutrition survey.
Statistical methods
All analyses were performed using SAS software (version 9.4; SAS Institute Inc., Cary, NC, USA) using PROC SURVEY because KNHANES data were collected using a complex sampling design, involving a variety of weightings, stratification variables, and clusters.
The χ2 test (for categorical variables) and the general linear model (for continuous variables) were used to analyze the characteristics of the study subjects with respect to chocolate consumption. A multivariable logistic regression model was used to determine whether chocolate consumption was independently associated with the presence of MetS using non-consumers as the reference in the primary analysis and using the lowest quartile of chocolate consumption as the reference in the secondary analysis. We calculated adjusted odds ratios (ORs) (95% confidence interval [CI]) using 5 following models: 1) adjusted for nothing (Model 1); 2) adjusted for socio-demographic variables such as gender, age (years), income level (low, medium-low, medium-high, high), education level (elementary school or less, middle school, high school, college or more) (Model 2); 3) Model 2 with additional adjustment for health-related lifestyle factors such as current smoker (yes/ no), current drinker (yes/ no), and regular exercise (yes/ no) (Model 3); 4) Model 3 with additional adjustment for dietary factors such as total energy intake (kcal/day), skipping breakfast (yes/ no), use of nutrition labels (yes/ no), receipt of nutrition education (yes/ no), and total energy intake (kcal/day) (Model 4); and 5) Model 4 with additional adjustment for BMI (kg/m2) (Model 5). For secondary analysis, median values were assigned to each categories of chocolate quartile group and linear trend testing was conducted.
Based on previous epidemiological studies which reported remarkable gender differences for the prevalence and incidence of chronic diseases [2024], we conducted effect modifier analysis to determine the effect of gender on the relation. However, no gender interaction was observed (P = 0.1147, data not shown), thus, our analyses were performed on combined groups of men and women.
Statistical significance was defined as a 2-sided P < 0.05.
Go to :
RESULTS
Socio-demographics and health-related characteristics
The characteristics of all subjects are summarized in Table 1. The number of all subjects was 6,982, 46.4% (n = 3,241) were chocolate consumers and 53.6% (n = 3,741) were non-consumers. Chocolate consumers were younger, more likely to be highly-educated and physically active, but less likely to smoke. In addition, chocolate consumers were more likely to read nutrition labels, had higher energy, protein, and fat intakes, and more frequently consumed vegetables, fruits, and dairy products, but consumed less carbohydrate-sourced energy and grain-based products. Secondary analysis revealed a similar pattern (Table 2), but although chocolate intake was found to be significantly related to some characteristics, the magnitudes of these relations were weak or inconsistent across quartiles.
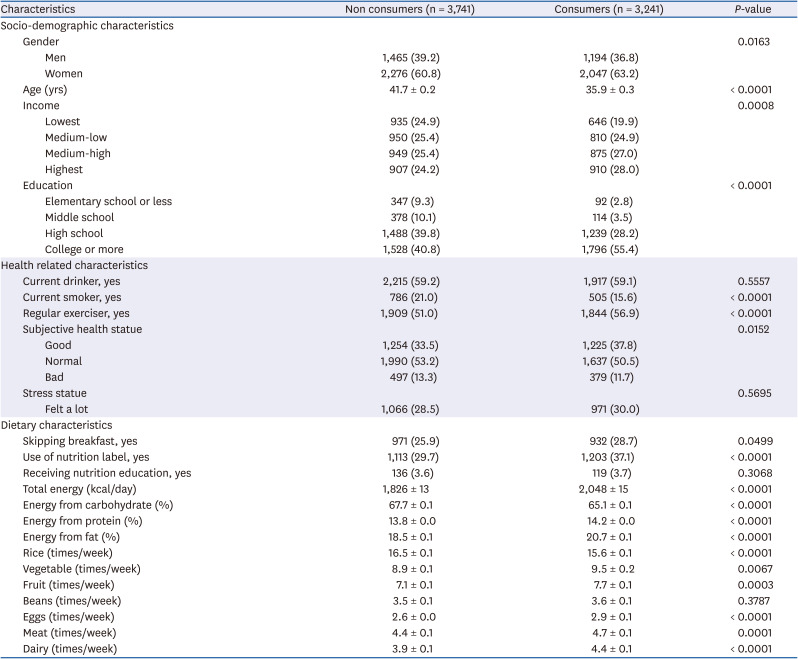
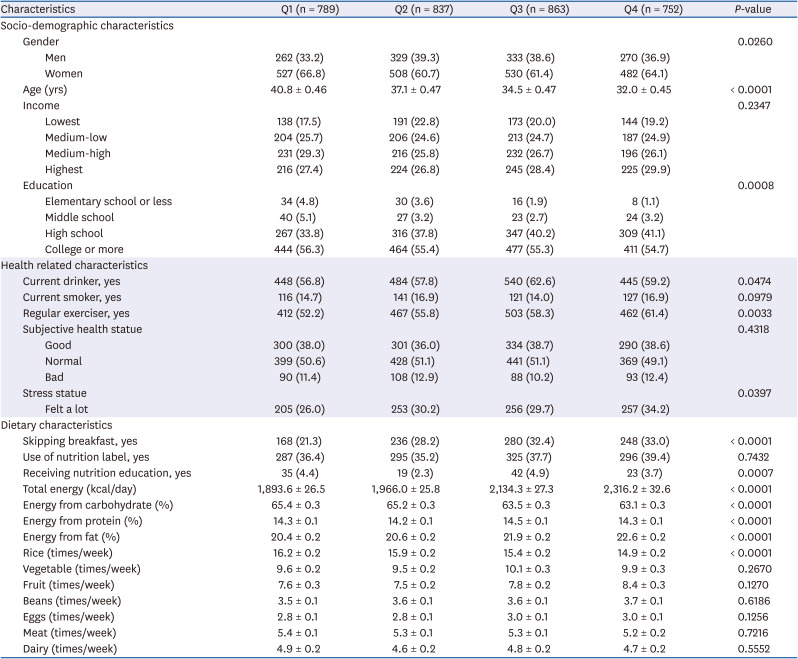
Table 1
Characteristics of all subjects (n = 6,982)
Categorical variables are presented as frequencies (percentages). Continuous variables (except age) are presented as means ± SEs adjusted for gender and age. Food group variables are presented as means ± SEs with additional adjustment for total energy intake.
![]()
Table 2
Characteristics of chocolate consumers (n = 3,241)
Categorical variables are presented as frequencies (percentages). Continuous variables (except age) are presented as means ± SEs adjusted for gender and age. Food group variables are presented as means ± SEs with additional adjustment for total energy intake.
Q1 (median intake=2.5 g/week); Q2 (median intake=3.8 g/week); Q3 (median intake=9.6 g/week); Q4 (median intake=33.0 g/week).
![]()
Metabolic profiles
Chocolate consumers had significantly lower mean waist circumstances (81.3 ± 0.2 vs. 80.2 ± 0.2 cm2; P < 0.0001), BMIs (23.8 ± 0.1 vs. 23.4 ± 0.1 kg/m2; P < 0.0001), FGL (95.9 ± 0.4 vs. 94.3 ± 0.3 mg/dL; P < 0.0001), TG (138.0 ± 2.0 vs. 125.6 ± 2.4 mg/dL; P < 0.0001), SBP (114.2 ± 0.3 vs. 113.1 ± 0.3 mmHg; P < 0.0001), and DBP (75.8 ± 0.2 vs. 75.3 ± 0.2 mmHg; P < 0.0001) and furthermore, they had significantly higher mean HDL cholesterol (51.6 ± 0.2 vs. 52.8 ± 0.2 mg/dL; P < 0.0001) than non-consumers after adjusting for age and gender (Table 3). However, secondary analysis showed chocolate intake was not significantly related to metabolic markers among chocolate consumers (Table 4).
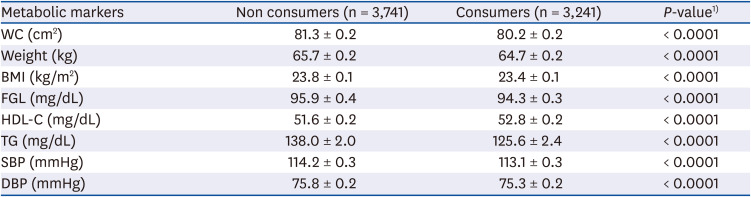
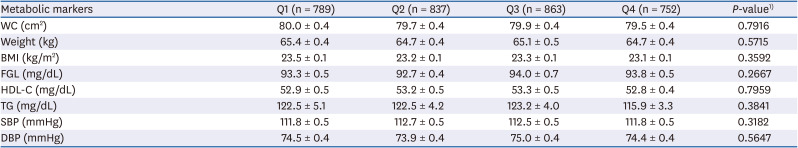
Table 3
Metabolic marker levels of all subjects (n = 6,982)
All values are presented as means ± SEs adjusted for gender and age.
WC, waist circumstance; BMI, body mass index; FGL, fasting glucose level; HDL-C, high-density lipoprotein cholesterol; TG, triglyceride; SBP, systolic blood pressure; DBP, diastolic blood pressure.
1)P-values are derived using PROC SURVEYREG.
![]()
Table 4
Metabolic marker levels of chocolate consumers (n = 3,241)
All values are presented as means ± SEs adjusted for gender and age.
WC, waist circumstance; BMI, body mass index; FGL, fasting glucose level; HDL-C, high density lipoprotein cholesterol; TG, triglyceride; SBP, systolic blood pressure; DBP, diastolic blood pressure.
1)P-values are derived using PROC SURVEYREG.
Q1 (median intake=2.5 g/week); Q2 (median intake=3.8 g/week); Q3 (median intake=9.6 g/week); Q4 (median intake=33.0 g/week).
![]()
Risk of MetS
Consumers had a 30% lower prevalence of MetS than non-consumers (OR, 0.70; 95% CI, 0.58–0.86; P = 0.0005) after adjusting for confounding factors in Model 5 (Table 5). Consumers in the highest quartile had a 32% lower prevalence of MetS than those in the lowest quartile (OR, 0.68; 95% CI, 0.50–1.00; P = 0.0342) but significance was lost after adjusting for confounding factors (Table 6).
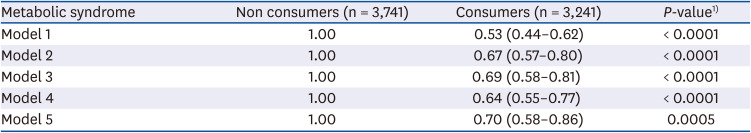
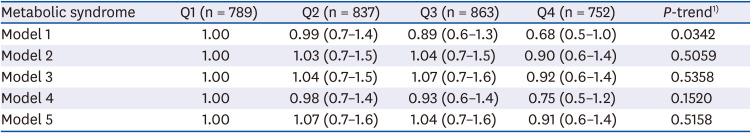
Table 5
OR (95% CI) of metabolic syndrome among all subjects (n = 6,982)
Data calculated using 5 following models: 1) Not adjusted (Model 1), 2) Adjusted for gender, age, income level and education level (Model 2), 3) Model 2 with additional adjustment for current smoke, current drinking and regular exercise (Model 3), 4) Model 3 with additional adjustment for skipping breakfast, use of nutrition label, and total energy intake (Model 4), and 5) Model 4 with additional adjustment for BMI (kg/m2).
OR, odds ratio; CI, confidence interval; BMI, body mass index.
1)P-values are derived using PROC SURVEYLOGISTIC.
![]()
Table 6
OR (95% CI) of metabolic syndrome among chocolate consumers (n = 3,241)
Data calculated using 5 following models: 1) Not adjusted (Model 1), 2) Adjusted for gender, age, income level and education level (Model 2), 3) Model 2 with additional adjustment for current smoke, current drinking and regular exercise (Model 3), 4) Model 3 with additional adjustment for skipping breakfast, use of nutrition label, and total energy intake, and 5) Model 4 with additional adjustment for BMI (kg/m2).
OR, odds ratio; CI, confidence interval; BMI, body mass index.
1)Linear trends across categories of chocolate consumption were tested using the median consumption value for each category as a continuous variable.
Q1 (median intake=2.5 g/week); Q2 (median intake=3.8 g/week); Q3 (median intake=9.6 g/week); Q4 (median intake=33.0 g/week).
![]()
Go to :
DISCUSSION
In this cross-sectional study, we found an inverse relationship between chocolate consumption and the prevalence of MetS among all subjects by primary analysis. Although statistical significance of dose-response effects was not found during the second analysis among chocolate consumers, a similar pattern was partially observed. Many issues have to be taken into account when interpreting the results of this cross-sectional study.
Commercially available chocolates contains many ingredients (e.g., cocoa, cocoa butter, sugar, milk, nuts, etc.) and can be classified simply as dark chocolate or milk chocolate. Here, we discuss the effects of chocolate ingredients on health, focusing on potential mechanisms involved in the response to cocoa, milk, and sugar.
Nutritional epidemiologists have already found that the polyphenols in cocoa have the following beneficial effects by their activation of nitric oxide and antioxidant effects: 1) the prevention of oxidative damage to low-density lipoprotein cholesterol; 2) the disruption of inflammatory atherosclerotic processes; 3) a reduced risk of thrombosis; and 4) the promotion of normal endothelial function and these effects ultimately lead to lower blood pressure and insulin resistance [56], that are related with MetS [25]. The results of the present study show that chocolate consumers enjoyed better health than non-consumers. However, could it be possible to explain that our cross-sectional results are due to the effects of polyphenols?
Unfortunately, we were not able to investigate the effects of polyphenol on MetS because the KNHANES FFQ data do not distinguish between different types of chocolate (e.g., dark, milk, and white). We analyzed 24 hour-recall data in order to determine what types of chocolate were most consumed in Korea. Among chocolate consumers, 7% consumed dark chocolate, 92% consumed milk chocolate or snacks covered with milk chocolate, and only 1% consumed white (data not shown). According to this additional data analysis, far more milk chocolate was consumed in Korea, which raises questions concerning the health benefits of milk versus dark chocolate. Furthermore, this might have led to our inaccuracies in our assessment of the relationship between chocolate consumption and MetS, because ingredients in chocolate, such as cocoa, sugar, and milk, have different health effects.
Though researchers have conducted several experimental trials to examine the effects of different chocolate types on health, the situation remains unclear. For example, one study published in Nature found that dark chocolate resulted in an increase in total antioxidant capacity, but that milk chocolate significantly reduced antioxidant capacity. Serafini et al. [11] suggested this was due to reduced absorption of cocoa polyphenols in the gastrointestinal tract due to binding by milk proteins. On the other hand, other studies on milk chocolate have reported positive effects on serum cholesterol levels [1326], blood pressure [26], and antioxidant capacity [2627]. Clearly, the has not been resolved, further study is needed to elucidate the mechanism responsible for the health benefits of milk chocolate due to its far greater consumption in Korea and other countries.
Sugar is another major ingredient of chocolate, and much epidemiological evidence indicates sugar consumption is associated with the risk of metabolic diseases such as obesity [2829], diabetes [2930], and cardiovascular disease [31]. Interestingly, in our study, chocolate consumers paid more attention to food nutrition labels (Table 1). We assumed that this health-related habit may naturally lead to their choice of dark chocolate with less sugar and also lead to their health MetS markers (Table 3). In order to confirm this presume, prospective studies used the modified FFQ to enable assessments of chocolate types are needed.
Primary analysis showed that chocolate consumers; 1) were more physically active; 2) less likely to smoke; 3) paid more attention to food nutrition labels, and 4) had healthier dietary patterns, that is, they consumed vegetables, fruits, and dairy products more frequently than non-consumers (Table 1). Secondary analysis of chocolate consumers revealed a similar though non-significant pattern (Table 2). These health-related characteristics could be the result of chocolate consumers having better metabolic bio-markers than non-consumers (Table 3) and the fact that Q4 had better (though non-significant) metabolic markers than Q1 (Table 4). Furthermore, before adjusting for socio-demographic variables, health-related lifestyle variables, and dietary characteristics, we found 47% relative reduction in MetS prevalence in consumers compared to non-consumers (OR, 0.53; 95% CI, 0.44–0.62; P < 0.0001) and 32% relative reduction in Q4 than in Q1 (OR, 0.68; 95% CI, 0.50–1.00; P = 0.0342) in secondary analysis, which may be explained by results of following cross-sectional studies: 1) Kim et al. [32] reported that high activity was associated with a lower risk of MetS; 2) Oh et al. [33] demonstrated that smoking increases risks of MetS; 3) Kang et al. [34] reported that the practice of reading nutrition labels was associated with a lower risk of MetS; and 4) Hong et al. [35] found that a fruit and dairy consumption pattern was significantly associated reduced risk of MetS.
MetS is an obesity-related disorder and evidence concerning the association between chocolate consumption and obesity is inconsistent. Two cross-sectional studies [3637] reported that habitual chocolate consumption was associated with a lower body weight, which supports our result in Table 3 (65.7 ± 0.2 vs. 64.7 ± 0.2 kg; P < 0.0001), but two prospective cohort studies [3839] showed that chocolate intake was dose-dependently associated with long-term weight gain. These differences between studies may have been due to different study designs, differences between the consumption level cutoffs used, or differences between the biochemical profiles of individuals.
A high FGL and a high BP are features of MetS. In the present study, chocolate consumers had a lower FGL (95.9 ± 0.4 vs. 94.3 ± 0.3 mg/dL; P < 0.0001) and a lower BP (SBP: 114.2 ± 0.3 vs. 113.1 ± 0.3 mmHg, P < 0.0001; DBP: 75.8 ± 0.2 vs. 75.3 ± 0.2 mmHg, P < 0.0001) than non-consumers. These results is in-line with the findings of previous observational [91040] and experimental studies [2441] And this beneficial effects on FGL and BP may be partially explained by the fact that the polyphenols in cocoa may decrease insulin resistance and reduce blood pressure by the activation of nitro oxide [56].
Cocoa butter is a fat derived from the cacao plant and contains around 33% stearic acid, a saturated fat [5]. Thus, our results on lipid profiles in Table 3 (HDL cholesterol: 51.6 ± 0.2 vs. 52.8 ± 0.2 mg/dL; P < 0.0001, TG: 138.0 ± 2.0 vs. 125.6 ± 2.4 mg/dL; P < 0.0001) are somewhat surprising, because we believed that saturated fat in diet increases the risk of dyslipidemia. However, a number of chocolate feeding studies have shown stearic acids in cocoa butter have a neutral effect on blood lipid levels [124243]. Furthermore, it was reported in a small-scale clinical trial that chocolate intake might increase HDL cholesterol concentration [3], which is in-line with our findings.
The results of our study are similar to those of a study performed in the US [44]. Both studies used data from NHANES (a nationwide cross-sectional survey conducted with the aim of providing reliable information on nutrition and health) and compared the odds of the risk of MetS by simply dividing into chocolate consumers and non-consumers. As a result, they found chocolate consumers had a 15% reduced risk of MetS (OR, 0.85; 95% CI, 0.73–1.00; P = 0.0453), which supports our result that chocolate consumers had a 30% lower risk of MetS (Table 5). However, the following differences should be considered when comparing the results of these 2 studies: 1) the US population was older (mean age = 45.7) than our population (mean age = 39.0); 2) dietary assessment instruments used were different (FFQ vs. 24-hour recall); 3) mean BMI was lower in our Korean subjects (23.4 vs. 27.9 kg/m2); and 4) the covariates adjusted in the final logistic regression model differed with the exception of age and gender.
Chocolate epidemiological studies have been conducted mostly in Europe and the United States where chocolate consumptions are relatively high [1920]. Could their results be applied to people in Asia where chocolate consumption is relatively low? To our knowledge, only two chocolate observational studies [2045] have been conducted in Asia, as they adopted diabetes and stroke as outcome variables, which are closely related to MetS [2546], so, it is meaningful to compare the two.
A study by Oba et al. [45] published in 2010 used Japanese cohort data and divided subjects into three groups based on frequency of chocolate consumption (never or almost never, once/month to less than once/week, once/week or more), and they found inverse association between chocolate consumption and diabetes. In the second study conducted in Asia by Dong et al. [20] in 2017 using data from a large Japanese cohort, subjects were divided into quartiles based on chocolate intake per week (g/week), and the consumption cut-offs used were similar to those used in the present study (Q1: 0 vs. 2.5 g/week; Q2: 5.8 vs. 3.8 g/week; Q3: 11.6 vs. 9.6 g/week; Q4: 37.5 vs. 33.0 g/week). Interestingly, Dong et al. [20] included non-consumers when allocating subjects to group even though almost 49.9% of men and 34.9% of women were non-consumers (55.1% of men and 52.6% of women in present study; data not shown). On the other hand, we excluded non-consumers in order to achieve adequate statistical power for subgroup analyses as discussed in Methods. And in this secondary observational study in Asia, an inverse association was observed between chocolate intake and stroke. These 2 results are in-line with our main result because MetS is known to increase the risk of chronic disease like diabetes and stroke [2546]. Further intervention studies in Asia are needed to robust these results.
Because of the cross-sectional design of present study, we could not explore causal relationships. For example, we found that chocolate consumers had healthier life styles and dietary patterns and better metabolic profile than non-consumers. However, could there be a reverse causality that non-consumers did not eat chocolate for their better health condition?
There was an interesting study about this issue. Greenburg et al. [39] posed a hypothesis that a positive association exists between chocolate consumption and obesity, and that differences between cross-sectional and prospective study results are due to the presence of obesity-related disease. In a large US cohort, they found that cross-sectional analysis produced an inverse relationship, but that prospective analysis resulted in a positive association.
In view of this evidence, we excluded subjects with a history of diabetes, hypertension, or dyslipidemia during study subject selection, because the presence of individuals with these chronic disease might change dietary patterns, however, the inverse relationship between chocolate consumption and MetS did not change. We suggest prospective studies be conducted on chocolate consumption and the risk of MetS in a Korean population to confirm this cross-sectional finding.
The present study has several limitations that warrant consideration. First, due to its cross-sectional design, causal relationships were not examined as discussed above. Second, chocolate consumption was defined based on FFQ data, which provided no information on chocolate types as discussed above. Despite our efforts to identify chocolate types, we did not combine results obtained using the 24 recall method with FFQ derived results because these two assessment methods are quite different and complex to combine, although attempts have been made to combine the 2 methods [474849]. Therefore, we suggest the FFQ be modified to enable assessments of chocolate types or the 24-hour recall method be modified to enable assessments of habitual chocolate intake. Third, our exposure variable, chocolate consumption, was self-reported and this may have resulted in measurement errors. Fourth, although we adjusted for crucial lifestyle and dietary factors, we cannot rule out the possibility that some unmeasured or residual confounders influenced our results. Finally, our secondary analysis conducted on chocolate consumers failed to reveal a relation between quartiles of chocolate intake and MetS, which may have been due to the lower validity of FFQ for estimating intake amounts than the 24-hour recall method [50].
Despite these limitations, our study has several strengths. First, our findings are representative of healthy Korean adults because KNHANES provides a reliable, nationally representative database. Second, the large dataset used provided adequate statistical power for subgroup analyses. Third, to the best our knowledge, the present study is the first population-based, epidemiologic study to be undertaken on the relation between chocolate consumption and MetS in the Korean population.
In conclusion, chocolate consumers had healthier lifestyles and dietary patterns and a lower prevalence of MetS than non-consumers, as determined by our primary analysis. Although dose-response effects were not found to be significant among chocolate consumers during secondary analysis, the patterns were partially similar. This cross-sectional finding shows chocolate consumption does not increase the risk of MetS. Prospective studies and intervention trials in the Korea population are needed to confirm this cross-sectional finding.
Go to :
 XML Download