

 PDF
PDF Citation
 Print
Print


INTRODUCTION
As 1 of the 4 major diseases recognized by the Ministry of Health and Welfare, diabetes affects more than 3 million Koreans aged > 30 years [1]. According to the World Health Organization (WHO), the prevalence of diabetes in the Korean population aged > 30 years is 9.5%, which is approximately 2 times higher than the world average. The main cause of diabetes is obesity, which has been attributed to excessive sugar consumption [2]. Currently, several policies are being established to reduce the excessive consumption of sugar worldwide [3]. In line with this, many “well-being” food products focusing on health and safety are being introduced [4], and the consumer demand for them is also increasing [5]. “Well-being” food products are characterized by their high protein and fiber contents, but no sugar. Hence, they are popular among the urban population [6], who restrict their consumption of regular food products.
International organizations, such as the WHO and the American Diabetes Association (ADA), have emphasized the importance of diet management and exercise to prevent and control diabetes. On the other hand, while diabetic patients recognize the importance of diet management, they express difficulties with its practical implementation [7]. These patients are forced to restrain themselves from consuming their preferred foods and have to restrict their diet to healthier, bland food products. Such foods include alternative sweetener-based food products, low-sugar food products, and blood glucose-reducing products to satisfy the consumer needs [8910]. Furthermore, the development of meal products and snack products is ongoing.
According to the Ministry of Food and Drug Safety, “High protein” refers to a protein content of ≥ 11 g per 100 g food [11]. Studies have shown that glucose levels in the plasma of people with diabetes can be reduced when they reduce their carbohydrate intake and increase their protein intake [12], suggesting that high protein intake is a promising material for the prevention and treatment of diabetes [1314].
Although food products for diabetic patients are not defined in Korea, many products are being developed with nutritional considerations. Recently, there have been many online stores that sell food products for diabetic patients, and the demand has also begun to increase.
Although products for diabetic patients have been developed and sold, and many studies have been conducted on these products, few studies have carried out blood tests on diabetic patients. Previous studies were conducted on healthy participants with normal blood glucose control or involved the use of materials known to assist in blood glucose control. Hence, they could not identify the effects on actual blood glucose levels. Therefore, in this study, high-protein snacks were developed using plant-based proteins, and the blood glucose response in patients with type 2 diabetes who consume these snacks was identified to test the effect of these developed high-protein snacks in controlling the blood glucose levels.
Go to : 
MATERIALS AND METHODS
Development of high-protein snacks for diabetes
Table 1 lists the ingredients and mixture of the 2 types of high-protein snacks used in this study for diabetes (grain flavor, chocolate flavor), which were developed through previous research and a pilot study [6]. High-protein powder, milk, sugar, butter, salt, and baking powder were mixed. The sugar content was decreased by > 50% compared to the sugar content in snacks currently available on the market. Furthermore, 2 types of high-protein powders as the main ingredients replacing flour were used in this study: a mixture of isolated soy and almond proteins. For the chocolate flavor, xylose and cocoa power manufactured by G Company were added (Korea, 2005) (Table 2).
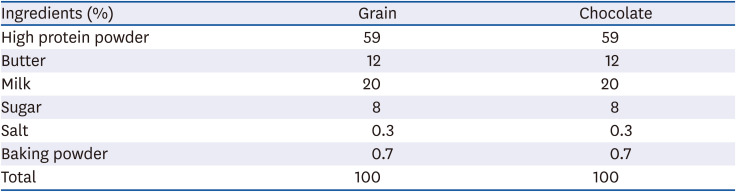
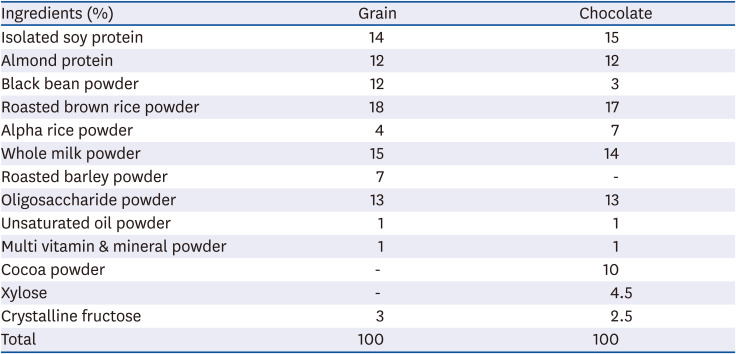
Table 1
Ingredients of the high-protein snacks for diabetics
| Ingredients (%) | Grain | Chocolate |
|---|---|---|
| High protein powder | 59 | 59 |
| Butter | 12 | 12 |
| Milk | 20 | 20 |
| Sugar | 8 | 8 |
| Salt | 0.3 | 0.3 |
| Baking powder | 0.7 | 0.7 |
| Total | 100 | 100 |
![]()
Table 2
Ingredients of the high-protein powder (Grain, Chocolate)
![]()
In sample production, the powdered ingredients (protein powder, sugar, salt, baking powder) were first mixed evenly by sifting. Subsequently, butter that had been softened at room temperature for 20 min was added. After combining the powdered ingredients and butter evenly, milk was added to form a dough. The dough was wrapped in plastic and rested a refrigerator set to 4°C for 20 min. The dough was rolled to a 1-mm thickness using a rolling pin and cut into 5 cm × 5 cm squares using a cookie cutter. They were placed on a cookie sheet lined with parchment paper and baked for 5 min in a Convotherm oven (C4eT-610ES; Daeryung Co., Ltd., Seoul, Korea) preheated to 165°C. These cookies were cooled to room temperature for 30 min.
Participants and methods
Patients with type 2 diabetes who participated in this study were aged between 30 and 75 yrs. The diabetic control was defined as having hemoglobin A1c (HbA1c) levels < 7.5% for a duration of < 10 yrs [13]. The cutoff age of the participants was set to ≥ 30 yrs because of an increasing prevalence of diabetes in young individuals, i.e., those aged ≥ 30 yrs, according to Korean Diabetes Association(KDA), both domestically and internationally, as well as an increasing number of individuals at risk of developing diabetes. Elderly individuals aged > 75 yrs were excluded because of the high likelihood of occurrence of other complicating diseases with increasing age.
In a previous study, 28 subjects were tested for the responses of blood glucose and insulin after eating cookies containing resistance starch [15]. A study on the extent to which Korean types of meals affect blood glucose and insulin was conducted on 48 normal and 40 diabetics [16]. With reference to this, 30 subjects were assessed in this study.
The Ethics Committee of the participating facility approved this study, and all requirements for human research, including the Seoul Medical Center division of endocrinology and metabolism, were fulfilled (IRB No. 2019-04-005). The study was conducted from August 15 to October 31, 2019, in the Seoul Medical Center.
The exclusion criteria were subjects who did not agree to participate in a clinical trial or those who were undergoing cancer treatment or insulin therapy, had kidney or liver disease, were pregnant or had allergies to milk, soy, or any other ingredient in the snack product. Furthermore, there were no restrictions on hormones before and after menopause in women or on glucose-lowering agents. The subjects received written consent in advance if they wished to participate in the study.
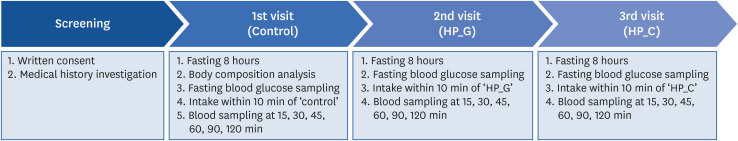
This study was conducted using a crossover design. The participants attended a screening session and 3 subsequent visits separated by a washout period of 7 days. Informed consent, medical history, demographics, disease history, height, weight, and waist circumference measurement were obtained at screening, along with the samples for the blood chemistry tests (including measurement of the HbA1c level), followed by a brief physical examination. The weight and vital signs were measured at all subsequent visits to the clinic.
The postprandial blood glucose response was measured in all 3 groups. In the first control group, white bread (Tous les Jours, daily milk sandwich bread) was used as the control food, as recommended by the WHO/Food and Agriculture Organization of the United Nations (FAO). In the second and third test groups, the postprandial blood glucose responses were measured after consuming the developed high-protein snacks with a grain flavor and chocolate flavor, respectively. All samples were produced one day before the evaluation. The white bread used as the control was divided into pieces weighing 50 g each after removing the edges, stored in the freezer (−18°C), and used after thawing at room temperature for 30 min before the study. In the second and third groups, grain flavored and chocolate flavored high-protein snacks were provided in the same amount as the carbohydrates. The snacks were stored at room temperature in a sealed container before being given to the participants.
The participants were requested to fast for more than 8 h on the day of the test. Their usual medications were not limited. The fasting blood was drawn in a relaxed condition. The participants were instructed to consume all of the sample provided, along with 200 mL water, within 10 min of drawing the blood. While drawing blood, the consumption of additional water was restricted. Light activities, such as reading a book and using a smartphone, were allowed. The interval between each visit was set to more than 7 days so that the consumption of the samples did not interfere with the blood glucose levels (Fig. 1) [17].
Analysis of blood samples
Blood was collected at each time point using SST tubes. The catheter was flushed with 2 to 3 mL of a saline solution to prevent blood coagulation. The plasma glucose concentration was measured using a hexokinase-based analyzer (Roche COBAS 8000; Roche, Basel, Switzerland). Insulin was measured using a CMIA-based analyzer (Abbott Architect, Berlin, Germany). The blood samples remaining after use were not stored and were disposed of immediately.
Statistical analysis
The postprandial blood glucose responses were analyzed using the statistical program, SPSS 22.0 for Windows (SPSS Inc., Chicago, IL, USA). The means and SDs of changes in blood glucose and insulin in each sample over time were calculated, and an analysis of the variance was performed. The mean values were tested for any significant differences using a Duncan's multiple test at the significance level of P < 0.05. The incremental area under the curve (iAUC), which identifies the area of the blood glucose response, was calculated using the GraphPad Prism program (version 6; GraphPad Software, San Diego, CA, USA).
Go to :
RESULTS
High-protein snacks developed for diabetic patients
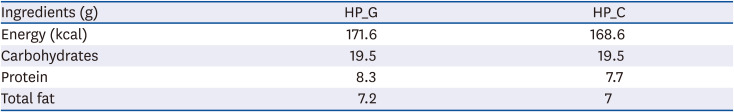
The high-protein snacks developed for diabetic patients in this study were of the following 2 types: high-protein grain (HP_G) snack and high-protein chocolate (HP_C) snack. The nutritional facts were found by combining the information provided in the ingredients (Table 3). The results from averaging 7 commercial snacks revealed each serving size to be 181.6 kcal of calories, 25.6 g of carbohydrates, 3 g of proteins, and 7.6 g of fats. A comparative analysis of the commercial snacks with the developed snacks showed that the developed snacks had lower-than-average calories, carbohydrates, and fats, as well as an approximately 2.5 times higher protein content. The protein content per serving (35 g) was 8.3 g and 7.7 g for HP_G and HP_C, respectively, which meets the ‘high protein’ labeling standard of the Ministry of Food and Drug Safety, and the protein is strengthened compared to commercial snacks.
Clinical research
Participants' characteristics
Table 4 lists the general characteristics of the participants. The mean age was 59.93 yrs. The HbA1c level, which reflects the blood glucose over the past 2–3 months, was 6.34%. The mean body mass index (BMI) was 27.77 kg/m2. Seventeen subjects (56%) were obese (BMI ≥ 25 kg/m2), and 13 subjects (44%) were normal. The duration of diabetes was 5 years on average. Ninety percent of people with diabetes took glucose-lowering agents.
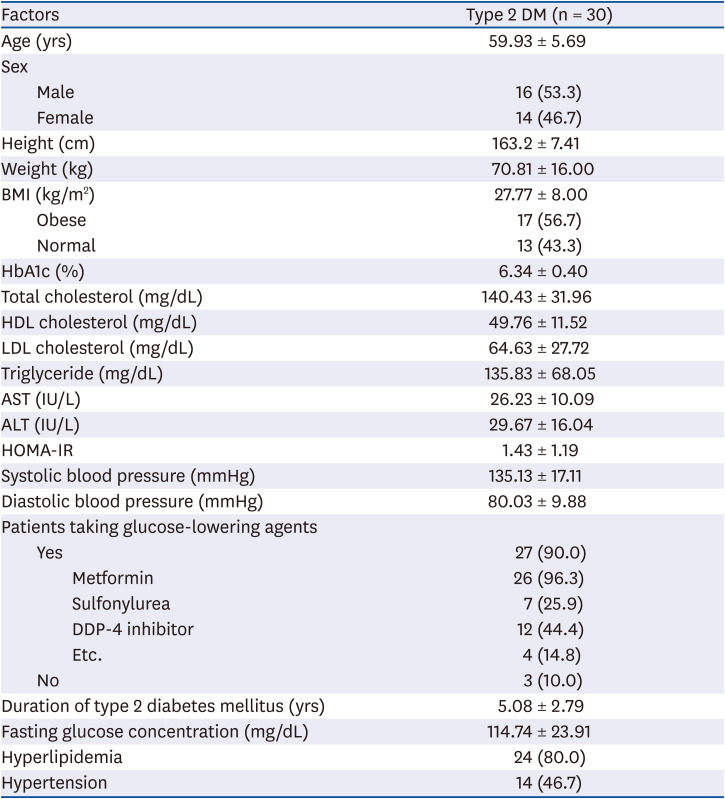
Table 4
Baseline characteristics of the study subjects
Values are presented as mean ± SD or number (%).
DM, diabetes mellitus; BMI, body mass index; HbA1c, hemoglobin A1c; HDL, high-density lipoprotein; LDL, low-density lipoprotein; AST, aspartate transaminase; ALT, alanine aminotransferase; HOMA-IR, homeostatic model assessment insulin resistance value; DDP-4, dipeptidyl peptidase 4.
![]()
All glucose-lowering agents were selected, and metformin was the highest at 92% (Table 4). Three people who did not take glucose-lowering agents were controlling their blood glucose levels only with meals and exercise.
The homeostatic model assessment insulin resistance value (HOMA-IR), which represents the resistance to insulin, was 1.43 ± 1.19.
Postprandial blood glucose change in high-protein snacks for diabetes
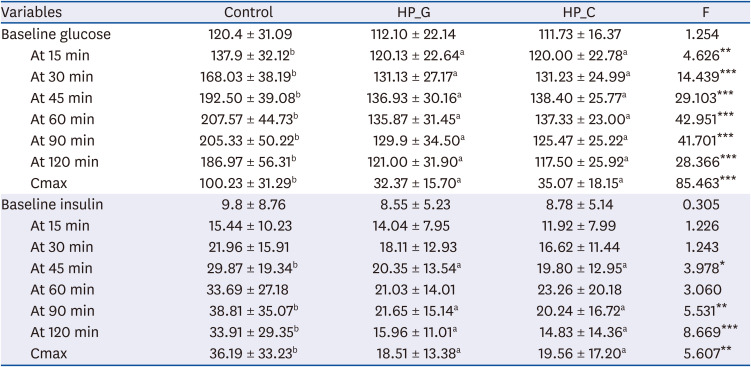
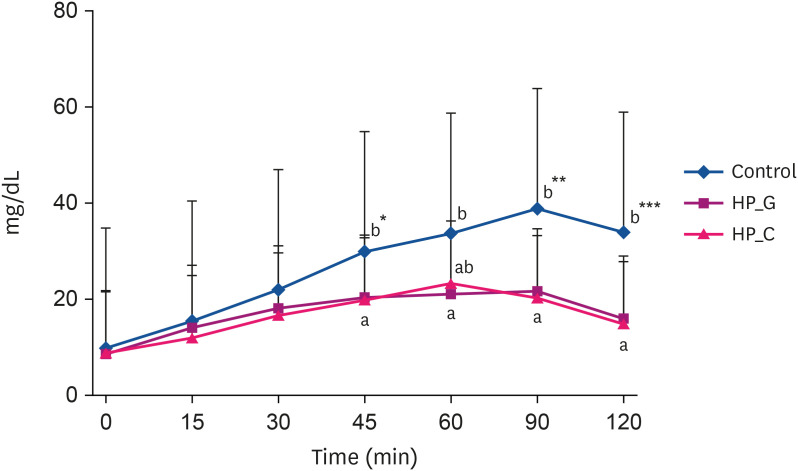
The results depicting the trends in the levels of postprandial blood glucose after consuming the 3 food products (white bread, HP_G,HP_C) are as follows (Table 5, Fig. 2). The fasting blood glucose levels were similar before snack consumption in the 3 groups. Significant differences were observed from 15 min after consumption, with the control, HP_G, and HP_C groups showing 137.90 ± 32.12 mg/dL, 120.13 ± 22.64 mg/dL, and 120.00 ± 22.78 mg/dL, respectively (P < 0.01). Thirty minutes after consumption, there were greater differences in the postprandial blood glucose concentrations between the control and 2 snack groups; this difference persisted until 2 h after consumption (P < 0.001). The postprandial blood glucose in the control group was highest at 60 min after consumption, with the values of 207.57 ± 44.73 mg/dL. The postprandial blood glucose levels 45 min after consuming HP_G and HP_C were 136.93 ± 30.16 mg/dL and 138.40 ± 25.77 mg/dL, respectively, showing that the increase in blood glucose levels and its duration were higher than those associated with the consumption of the control snack. Cmax, which represents the maximum change in the postprandial blood glucose over time, was 100.23 ± 31.29 mg/dL, 32.37 ± 15.70 mg/dL, and 35.07 ± 18.15 mg/dL for the control, HP_G, and HP_C, respectively, showing significant differences (P < 0.001). This suggests that the changes in postprandial blood glucose of the developed high-protein snacks were no greater than the changes after consumption of the control.
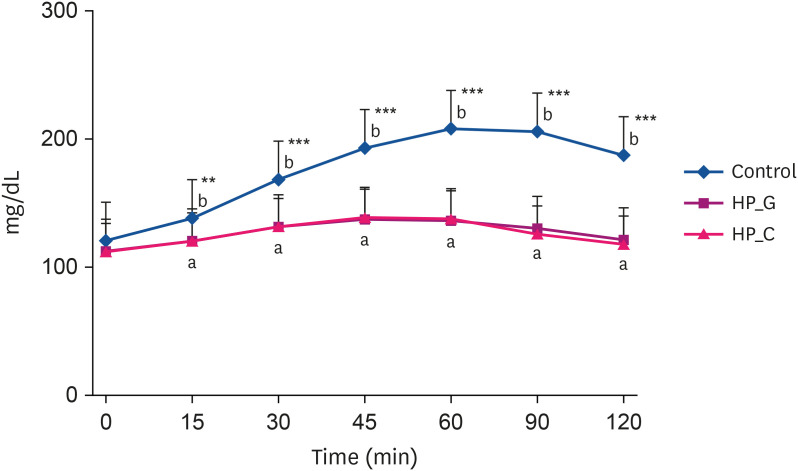 | Fig. 2Blood glucose responses after administration of the control (white bread) and test snacks (HP_G and HP_C).HP_G, high-protein grain; HP_C, high-protein chocolate.
a,bDuncan's multiple range test significantly different between superscript letter groups at P < 0.05 in the same column. **P < 0.01, ***P < 0.001.
|
Table 5
Changes in blood glucose and insulin variables of the control and test snacks
Values are presented as mean ± SD.
HP_G, high-protein grain; HP_C, high-protein chocolate.
a,bDuncan's multiple range test significantly different between superscript letter groups at P < 0.05 in the same column. *P < 0.05, **P < 0.01, ***P < 0.001.
![]()
Furthermore, the iAUC, which represents the area under the curve, depicts the area above the cut-off line in the blood glucose response curve (Table 6, Fig. 3). This indicator represents an increase in blood glucose levels after food consumption. The results of the analyses showed that the iAUC values for the control, HP_G, and HP_C groups were 1,065 ± 72.83, 771.1 ± 50.74, and 767.1 ± 41.49, respectively, indicating that the values associated with the snacks developed for the diabetes patients were significantly lower (P < 0.001).

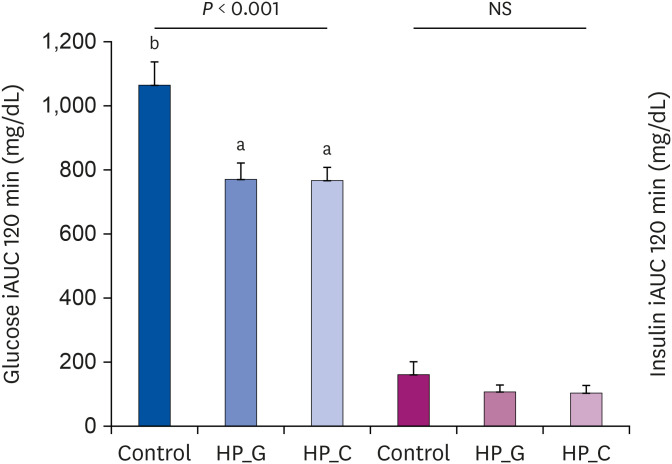 | Fig. 3iAUC over 120 min for the control (white bread) and test snacks (HP_G and HP_C).iAUC, incremental area under the curve; HP_G, high-protein grain; HP_C, high-protein chocolate.
a,bDuncan's multiple range test significantly different between superscript letter groups at P < 0.05 in the same column.
|
Table 6
iAUC values in subjects after ingestion of the control and test snacks
| Variables | Control | HP_G | HP_C | F |
|---|---|---|---|---|
| iAUC (glucose) | 1,065 ± 72.83b | 771.1 ± 50.74a | 767.1 ± 41.49a | 9.122*** |
| iAUC (insulin) | 161.6 ± 39.81 | 107.5 ± 21.37 | 103.6 ± 24.14 | 1.201NS |
Values are presented as mean ± SD.
iAUC, incremental area under the curve; HP_C, high-protein chocolate; HP_G, high-protein grain; NS, non-significant.
a,bDuncan's multiple range test significantly different between superscript letter groups at P < 0.05 in the same column. ***P < 0.001.
![]()
Postprandial insulin change in high-protein snacks for diabetes
Table 5 and Fig. 4 show the changes in the postprandial insulin response after consuming the 3 types of food products (control, HP_G, and HP_C). There were no significant differences in the fasting insulin levels after consuming the 3 food products. On the other hand, significant differences were observed between the control, HP_G, and HP_C groups at 45 min after consumption, with the insulin levels being 29.87 ± 19.34 μU/mL, 20.35 ± 13.54 μU/mL, and 19.80 ± 12.95 μU/mL (P < 0.05), respectively. At 90 min after consumption, the postprandial insulin response decreased compared to the postprandial insulin response immediately after consumption of the control food item (P < 0.01). At 2 h after consumption, the most significant difference in the postprandial insulin concentration was observed between the control and high-protein snack groups (P < 0.001). Furthermore, Cmax, which represents the maximum change in the postprandial insulin concentration, was 36.19 ± 33.23 μU/mL, 18.51 ± 13.38 μU/mL, and 19.56 ± 17.20 μU/mL for the control, HP_G, and HP_C groups, respectively. This shows that the insulin response was lower in diabetic patients who consumed the high-protein snacks than in the participants who consumed the control food item, which is consistent with the findings for the blood glucose levels (P < 0.01).
 | Fig. 4Blood insulin responses after administration of the control (white bread) and test snacks (HP_G and HP_C).HP_G, high-protein grain; HP_C, high-protein chocolate.
a,bDuncan's multiple range test significantly different between superscript letter groups at P < 0.05 in the same column. *P < 0.05, **P < 0.01, ***P < 0.001.
|
Go to :
DISCUSSION
This study developed snack products that elicited a stable increase in postprandial blood glucose and was pleasant for consumption by diabetic patients. Using isolated soy protein, which is a plant-based protein, the protein content was enhanced 2.5-fold, and the levels of carbohydrates and fats were reduced compared to the average nutritional content of commercial snacks. Commercial snacks have a 10%–20% of sugar content and are unsuitable for consumption by diabetic patients.
Isolated soy protein, which is a plant-based protein, was used as the main ingredient to reduce the impact of high-protein snacks on the blood glucose levels of diabetic patients. Unlike animal-based protein, the consumption of plant-based protein was unrelated to the prevalence of diabetes [18]. Only isolated soy protein has been recognized to reduce the risk of coronary artery disease in 13 countries, including the U.S. Food and Drug Administration and Health Canada. Moreover, it is the only plant-based protein to have an even distribution of essential amino acids [19]. Ingredients, such as isoflavone and saponin, can help maintain health and prevent adult diseases [20]. Furthermore, they reduce the cholesterol concentration [21] and BMI with increasing consumption and decrease the severity of obesity [22]. Hence, it has substantial potential as a candidate ingredient for diabetic patients and obese individuals and children.
The postprandial blood glucose response to high-protein snacks developed for diabetic patients showed that the grain-flavored and chocolate-flavored snacks did not increase the postprandial blood glucose levels any more than the control food did. Despite the same amount of carbohydrates, both snacks showed different blood glucose levels. This is in line with previous studies that reported that increased isolated soy protein was associated with smaller increases in blood glucose [23]. A similar study was conducted to compare the blood glucose response to a snack bar that was developed with glucose concentrate and whey protein as the main ingredients and contained 50 g of carbohydrates [24]. In contrast, in another study, snacks were developed using inulin and oats to compare the blood glucose and insulin responses with that observed after the administration of 50 g of glucose. These studies aimed to develop products for patients and healthy individuals [25] and provide products with confirmed blood glucose stability.
When consumed, isolated soy protein increases the secretion of insulin to inhibit glucose [26]. Therefore, it is believed to be a suitable ingredient for diabetic patients, and its development into more diverse food products is anticipated. On the other hand, the difference in insulin secretion with the change in protein amount could not be determined because this study set identical amounts of protein in the grain and chocolate-flavored snacks.
The blood glucose level and insulin secretion increased at a lower rate in diabetic patients who consumed the developed snacks than the control food item. This was attributed to blood glucose being secreted at a lower level. Insulin resistance is defined as an insulin dysfunction resulting in a higher level of insulin secretion when food products with identical amounts of carbohydrates are consumed. The developed snacks did not result in the excessive secretion of insulin, but the effect of insulin resistance recovery was not confirmed because this was not a study on long-term consumption.
The developed high-protein snacks for diabetic patients can provide additional health benefits. The Protein Digestibility Corrected Amino Score of isolated soy protein was the maximum at 1.00% or 100%, which is the same score given to milk and eggs that are known as complete protein food [27]. As a soy protein diet also does not include saturated fat, cholesterol, or lactose, the resulting levels of saturated fat and cholesterol are lower than those associated with an animal-based protein diet [2829].
Furthermore, a high-protein diet increases the satiety and fullness to facilitate appetite suppression. In addition, high protein foods do not increase the blood glucose level significantly when ingested [12], so they can be consumed by people with diabetes safely. The developed snacks help increase satiety and decrease weight within a short duration as well as help maintain the reduced weight for the long-term [29]. Because more calories are expended when proteins break down than when carbohydrates and fat break down, a high-protein diet reportedly increases the body heat, promotes satiety, and speeds up the metabolism [26]. Protein can also help maintain muscles while maintaining a calorie-restricted diet. Therefore, the developed high-protein snacks can help maintain body weight and are expected to manage obesity, which is the most common complication in diabetic patients.
This study had some limitations. The postprandial blood glucose and insulin results of the subjects were integrated regardless of gender or obesity. Although studies have shown that glucose is affected differently depending on gender, which in turn affects diabetes [30], this study suggests that there is no difference in the blood glucose and insulin reactions depending on gender. In addition, this study did not show a difference between obesity and normal glucose. When glucose and cinnamon were ingested in normal weight and obesity adolescents to determine the difference in glucose, there was no difference in glucose flow caused by obesity [31]. Similarly, although this study did not show any difference in glucose depending on obesity, further research will be needed to determine if the same applies to people with diabetes.
In addition, it was not possible to check whether there was a difference in the blood glucose and insulin response because the women who were recruited were not examined for menopause. One study reported that glucose levels change according to aging, not because of menopause [3233]. On the other hand, the risk of diabetes increases during menopause [34]; hence, further research on diabetes, menopause, and blood sugar reactions will be necessary.
In this study, 2 flavors of high-protein snacks were developed to identify the changes in postprandial blood glucose and insulin responses when the diabetic subjects ingested the snacks. The developed high-protein snacks are products that are convenient and can provide high-quality protein nutrition. This can be a good alternative for diabetic patients who remain conflicted owing to the limitations in choices and the diversity of suitable food products. This study offers healthier snack options that provide balanced nutrition. These results may be used as basic data for the development of products for individuals with diabetes and pre-diabetes, for whom blood glucose control is important.
Go to :
 XML Download