

 PDF
PDF Citation
 Print
Print


INTRODUCTION
Abdominal obesity is a predictive factor of metabolic disorders, including insulin resistance, hypertention, or hyperglycemia, and it is considered as the most common type and the core component of metabolic syndrome (MetS) [123]. In recent years, the prevalence of abdominal obesity has steadily increased among the Korean population, with the prevalence in 2015 reaching 24.6% [4]. According to the data of the National Health Insurance Service-National Sample Cohort, people with higher waist circumference had considerably higher medical expenses than people with lower waist circumference [5], so abdominal obesity is associated with more and more social costs. According to several previous studies, reduction in abdominal fat leads to the improvement of other cardiovascular risk factors [678]. Since obesity is the result of overnutrition and sedentary lifestyle in general, lifestyle modification is critical for obesity management [39]. Several randomized controlled trials (RCTs) have found that lifestyle modifications are effective for the management of obesity and other cardiovascular risk factors [101112]. In particular, dietary behavior is a major lifestyle factor affecting obesity and other cardiovascular risk factors [91314]. A number of studies pointed out the primary cause of obesity as overnutrition, i.e. excessive consumption of food [151617]. Therefore, for the management of obesity, changing one's dietary habits is recommended first and foremost, preceding any other lifestyle change (i.e. increasing physical activity) [15181920]. In addition, interventions on dietary change such as caloric reduction [21] and low-fat diet [22] were found to have effects on significant weight loss or consequent improvement in cardiovascular risk factors, whereas interventions which focused on physical activity without the changes in diet were not effective in terms of obesity improvement [2324]. Therefore, in the present study, we developed an intervention for the management of abdominal obesity. The proposed intervention focuses on modifying eating-related attitudes and dietary behaviors. We recruited abdominally obese people in Korea and implemented the intervention program for 6 mon. We reported program details and the assessment of its 3-mon effect elsewhere [25]. This study aimed to evaluate the long-term effect of the program—specifically, during a 12-mon period—as compared to the previously published paper. Along with identifying the amount of changes before and after the program, we also explored the pathway of improvements in abdominal obesity. Specifically, the focus was on investigating what changes in dietary cognition and dietary behavior lead to a reduction in waist circumference.
SUBJECTS AND METHODS
Participants
Abdominally obese adults with at least one cardiovascular risk factor were recruited at one of the 16 medical facility branches in South Korea from year 2013 to 2014. Abdominal obesity was defined as a waist circumference of ≥ 90 cm for men and ≥ 85 cm for women. Cardiovascular risk factors were defined as follows: 1) high-density lipoprotein (HDL) cholesterol < 40 mg/dL for men and < 50 mg/dL for women; 2) triglyceride (TG) ≥150 mg/dL; 3) systolic blood pressure (SBP) ≥ 130 mmHg or diastolic blood pressure (DBP) ≥ 85 mmHg; and 4) fasting blood glucose ≥ 100 mg/dL. These criteria were defined by the United States (US) National Cholesterol Education Programme Adult Treatment Panel III criteria [26] and the Korean standard for abdominal obesity [27]. Exclusion criteria were as follows: being on medication or treatment for hypertension, diabetes, hyperlipidemia, or obesity, as well as not providing informed consent for participation.
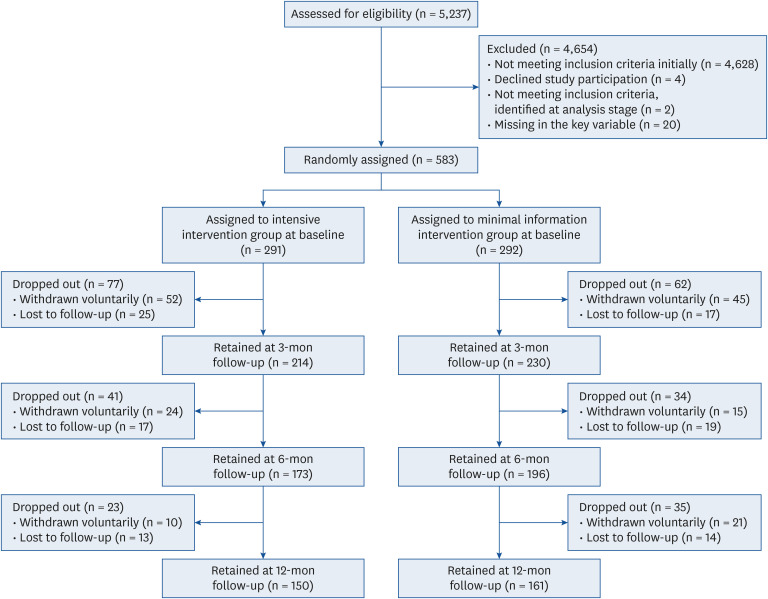
The effect size was determined based on the results of our previous studies on lifestyle interventions for improving obesity and MetS [2829]. To achieve 80% statistical power at a 5% significance level with an anticipated dropout rate of 30%, the required sample size was 166 per group. Based on this estimate, a total of 609 participants were recruited; however, four people decided not to participate in the study at the final decision-making stage, leaving a total of 605 participants. Enrolled participants were randomized into 2 groups by using ‘select cases’ function of SPSS 18.0 (SPSS Inc., Chicago, IL, USA). The selected participants were allocated to an intensive intervention group (IG), and the rest were allocated to a minimal intervention group (MG). Among 605 participants, 2 people were excluded from the analysis because they were identified as not abdominally obese at baseline. Another 20 people were excluded because they failed to provide their eating control self-efficacy scores for both 6- and 12-mon follow-up, although they did not drop-out. Those people's data were considered suspicious to be included in further analysis because of the missing in the key variable for more than half of the follow-up. Therefore, a total of 583 people were included in the final sample, 291 of whom were allocated to the IG and 292 to the MG. A detailed flowchart is shown in Fig. 1. This study was conducted according to the guidelines specified in the Declaration of Helsinki, and all procedures involving research study participants were reviewed and approved by the Institutional Review Board of the Korea Association of Health Promotion (#KAHP-13-B-01).Written informed consent was obtained from all study participants. This study was registered in the Clinical Research Information Service by Korea Centers for Diseases Control and Prevention as KCT0000762.
Interventions
A single-blind, parallel-group RCT was conducted to compare the effectiveness of 2 types of interventions to manage abdominal obesity and cardiovascular risk factors. Participants in the IG received an intensive intervention named “Healthy Life Plan” for 6 mon. The intervention aimed to control abdominal obesity and other cardiovascular risk factors mainly by correcting poor quality diet and abnormal eating behaviors associated with obesity in everyday life. Target outcomes were defined as a 3-phase process: 1) initial outcomes, such as enhanced self-efficacy related to the management of eating behaviors; 2) intermediate outcomes, e.g. correction of abnormal eating behavior and improved diet; and 3) final outcomes, including the reduction in abdominal obesity and subsequent improvements of other cardiovascular risk factors. The components of the intervention program were designed based on the 2012 US Preventive Services Task Force recommendations for the management of obesity in adults. The program was developed as multiple behavioral intervention activities that combined individual counseling with education and monitoring. In order to facilitate the behavioral change process, social cognitive theory, transtheoretical model, and theory of self-regulation were applied to develop intervention strategies. Individual health counseling was the main strategy used to motivate the study participants, raise self-efficacy, and induce behavior changes. Trained clinical nutritionists provided 12 counseling sessions focusing on nutrition or healthy eating to each participant every other week, and telephone counseling was offered when face-to-face counseling was not possible. A health education booklet was given to provide tailored information according to the readiness of the study participants to change their behavior. Through counseling and reading of the booklet, the participants were provided with healthy meal options and healthy eating habits applicable to everyday life. Tips on how to deal with stressful and depressive situations, such as starting conversations with others, exercising, or meditating instead of engaging in unhealthy eating behaviors, were also offered. Other strategies proposed include seeking help from others, reminding oneself about the objectives, or reflecting on health improvement efforts and achievements. As mentioned earlier, the short-term effects of the program are described in a previously published article [25].
The participants in the MG were provided with brief information on their health examination results and the necessity of lifestyle change.
Measures
Eating control self-efficacy and dietary behavior
Health examinations and questionnaire interviews were conducted with all study participants at four times: baseline, and 3-, 6-, and 12-mon follow-up. The reliability of the variables measured by the questionnaires was evaluated by Cronbach's alpha. A survey of dietary awareness and behavior was conducted using previously validated tools. Self-efficacy for eating control was measured using the 20-item Weight Efficacy Lifestyle Questionnaire [30]. The participants were asked to rate their confidence of resisting the desire to eat when not hungry in 5 risky situations; negative emotions, food availability, social pressure, physical discomfort, and positive activities. Each item was measured on a 9-point scale, ranging from 1 “not confident” to 9 “very confident”. For each participant, the mean scores for each risky situation were calculated. Accordingly, the score in each risky situation could range from 1 to 9, and the maximum total score was 45. The Cronbach's alpha value of self-efficacy for eating control was 0.939. To evaluate the overall dietary quality, the 10-item Mini Dietary Assessment (MDA) index [31] was used. This index measures the intake of food groups (the consumption of which should either be encouraged or limited), food variety, and frequency of consumption using the scale: “always” = 5, “generally” = 3, “seldom” = 1. The total score ranged from 10 to 50 points. The overall diet quality of the participants was considered as “poor” (≤ 25 points), “moderate” (26–35 points), or “good” (≥ 36 points). The Cronbach's alpha value of overall dietary quality was 0.452. Obesity-related eating behaviors were assessed using the Dutch Eating Behavior Questionnaire (DEBQ) [32]. This questionnaire measures three categories of eating behaviors: 1) restrained eating (restricting food intake to control weight); 2) emotional eating (eating large quantities of food in response to an arousal state [such as anger, fear, or anxiety] instead of hunger); and 3) external eating (the tendency to eat in response to food-related stimuli regardless of hunger). The DEBQ includes the measures of restrained eating (10 items), emotional eating (4 items), and external eating (10 items), which were evaluated on a 5-point scale: “never” = 1, “seldom” = 2, “sometimes” = 3, “often” = 4, and “very often” = 5. The mean scores were calculated for each of the 3 categories. The Cronbach's alpha value was 0.896 for restrained eating, 0.867 for emotional eating, and 0.860 for external eating. For anthropometric and physiological parameters, height and weight were measured using the Fatness Measuring System (DS-102, Dong Sahn Jenix, Seoul, Korea).
Anthropometric measurements
Two trained researchers independently measured waist circumference of each study participant using a tape measure for anthropometry, at the midpoint between the top of the iliac crest and the lower margin of the last palpable rib. The value was cross-checked, and the mean value for 2-time-measured waist circumference was used. SBP and DBP were measured using an automatic sphygmomanometer (TM-2655P, A&D, Tokyo, Japan) after a 5-min rest. To estimate TG, HDL cholesterol, and fasting glucose levels, fasting blood samples were obtained and analyzed using an automated chemistry analyzer (HITACHI 7600-110, HITACHI, Tokyo, Japan) at the laboratories.
Statistical analysis
Baseline characteristics of the study participants are presented as mean values with standard deviations or frequencies with percentages. Independent t-tests and χ2 tests were performed to identify baseline differences between the 2 groups. Changes at 3-, 6-, and 12-mon follow-up as compared with the baseline were calculated as mean differences for each group separately, and the significance of the change was analyzed using a paired t-test. Between-group comparison for the mean changes at each follow-up were evaluated by an independent t-test. In addition, possible time effects, group effects, and time × group interaction effects across a 12-mon period were assessed by repeated-measures analysis of variance. Furthermore, a path analysis was conducted to identify whether there was a process governing the changes in eating-related self-efficacy—behavior—and abdominal obesity, to identify which specific factors influenced the improvement of abdominal obesity, and to explore the pathway underlying the improvement. A total of 5 kinds of self-efficacy for eating control, 4 kinds of behaviors (restrained eating, external eating, emotional eating, and diet quality), and waist circumference were included in the model. Among the variables related to eating behaviors, restrained, emotional, and external eating were measured by questions asking about the intention to eat [33], and it is quite different from diet quality, which is the actual act of eating. We also considered evidence that restrained, emotional, and external eating may affect dietary quality, such as sweet or fatty food intake and snacking [3435363738]. Therefore, ‘behavior’ variables were divided into the following 2 steps: 1) restrained, emotional, and external eating and 2) overall diet quality. For the measurement points of the variable used in the analysis, self-efficacy was measured at 3-mon follow-up, the behavior of averaging points was assessed at 3- and 6-mon follow-up, and waist circumference was measured at 6-mon follow-up. The results of the path analysis were presented for each group separately with standardized regression weight (β), SE, and P-value. To test the model fit, we used the Tucker-Lewis Index (TLI), the comparative fit index (CFI), and the root mean square error for approximation (RMSEA). For TLI and CFI, the values > 0.90 indicate a good model fit [39], and an RMSEA value of < 0.10 can be considered a fair fit [40]. The initial model with all possible paths drawn contained statistically non-significant (P > 0.05) paths. Therefore, following a previously suggested way of refining the overall model for better fitting [4142], we constructed a more parsimonious model by removing paths that were non-significant in the IG data. The significance of the mediating effect was assessed via the bootstrapping method, and the path effect difference between the two groups was evaluated via the cross-group equality constraints method. Intention-to-treat analysis was used, meaning that variables for the participants who dropped-out were replaced with the most recently observed measures. SAS 9.4 (SAS Institute, Cary, NC, USA) and AMOS 23 (IBM Corp., Armonk, NY, USA) were used, and a P-value of < 0.05 was considered statistically significant.
RESULTS
The baseline characteristics
The baseline characteristics of the study sample are shown in Table 1. The mean age was 53.68 years in the IG and 53.94 years in the MG. There were 118 (40.5%) and 106 (36.3%) men in the IG and MG, respectively. With regard to self-efficacy for eating control, the participants had a total score of 30.20 out of 45.00 in IG and 30.35 out of 45.00 in MG. The participants of both the groups were “seldom” to “sometimes” shown to exhibit restrained, emotional, and external eating behavior. They represented moderate quality of the overall diet. All participants exhibited abdominal obesity at baseline, with a waist circumference of 92.49 cm in IG and 92.22 cm in MG. For all variables used in the present study, no significant inter-group differences were observed at baseline.
Table 1
The baseline characteristics of the study population
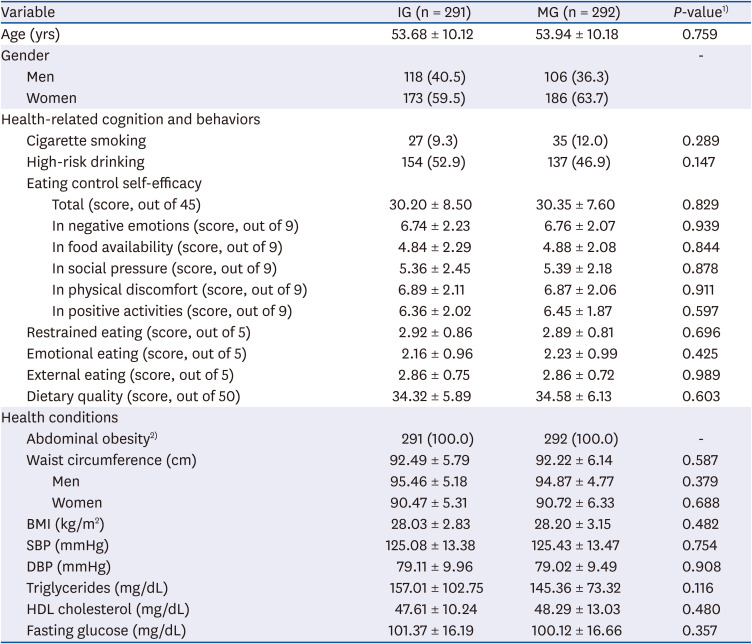
Data are presented as mean ± SD or n (%).
IG, intensive intervention group; MG, minimal information intervention group; BMI, body mass index; SBP, systolic blood pressure; DBP, diastolic blood pressure; HDL, high-density lipoprotein.
1)P-values from independent t-test or χ2 test. Values under 0.05 indicate a significant difference between the groups; 2)Abdominal obesity was defined as waist circumference of ≥ 90 cm for men and ≥ 85 cm for women.
The effect of the interventions and the changes over 12-mon period
The effect of the interventions, determined using mean or proportion differences of 3-, 6-, and 12-mon follow-up compared to baseline measurements, is presented in Table 2. For the score of eating control self-efficacy, the IG showed a significant improvement at 3-mon follow-up for all of the five situations except for social pressure. At the same time, the MG showed a significant improvement for only two situations: ‘food availability’ and ‘positive activities’. At the 6-mon follow-up, the IG increased their self-efficacy for all five kinds of situations, while the MG increased their self-efficacy for the aforementioned 2 situations. At 12-mon follow-up (six months after the end of the intervention), the IG participants showed a relapse for two situations (negative emotion and physical discomfort), but the overall improvements maintained. The IG participants became more prone to restrained easting and less prone to eat due to external factors. While people in the MG became more prone to restrained easting and less prone to eat due to external factors in 3-mon follow-up; however, from 6-mon follow-up, all three obesity-related eating behaviors improved. Dietary quality was significantly improved only in the IG at 3- and 6-mon follow-up, but the effect was not maintained at 12-mon follow-up. In the obesity index, significant decreases in body mass index (BMI) and waist size were observed in both groups; however, the extent of this decrease was slightly larger in the IG as compared to the MG. At 12-mon follow-up, the reduced obesity index was maintained or even more reduced in both groups. We examined whether the change of each variable from baseline time point was significantly different between the two groups. The results showed that most of the changes through 12-mon of follow-up were not significantly different between the 2 groups.
Table 2
Participants characteristics through 12-month follow-up as compared to baseline measurements
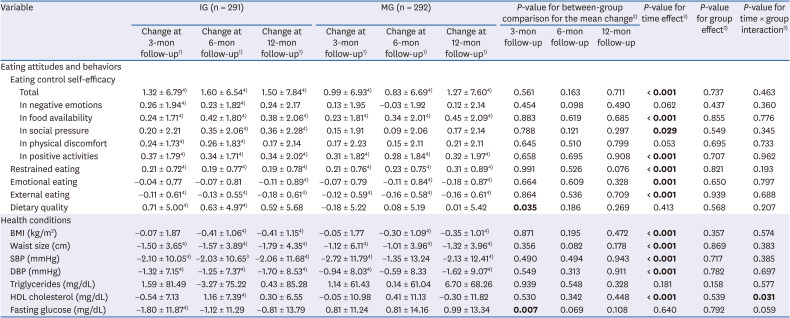
Data are presented as mean ± SD. Significant P-values (< 0.05) are in bold. Intention-to-treat analysis was used; variables for people who dropped-out were replaced with the most recently observed measures.
IG, intensive intervention group; MG, minimal information intervention group; BMI, body mass index; SBP, systolic blood pressure; DBP, diastolic blood pressure; HDL, high-density lipoprotein.
1)Measures of 3-, 6-, 12-mon follow-up − Measures at baseline.
2)Between-group comparison for the mean change at each follow-up, assessed by independent t-test.
3)Assessed from repeated-measures analysis of variance. Mauchly's test indicated that the sphericity assumption was violated for all variables, so the results from the multivariate test were presented.
4)Significantly different as compared to baseline, assessed by a paired t-test.
The significance of the time effects, group effects, and time × group interaction effects over 12 months is reported in Table 2. There were significant time effects in many of the key variables. Among eating control self-efficacy score, overall (P < 0.001), food availability (P < 0.001), social pressure (P = 0.029), and positive activities (P < 0.001) had significant time effects; in both groups, the scores for eating control self-efficacy increased since baseline. Among the dietary behaviors, there were significant time effects for restrained (P < 0.001), emotional (P = 0.001), and external eating (P < 0.001). Compared to baseline, the participants of both groups became more restrained in their eating, less emotional about eating, and less prone to eat due to external factors. Among the variables related to health conditions, BMI, waist size, SBP, DBP, HDL cholesterol had significant time effects (for all, P < 0.001). Since baseline, obesity has improved, and both systolic and diastolic blood pressures decreased in the participants of both groups. For HDL cholesterol in the IG, the level decreased at 3-mon follow-up, increased sharply at 6-month follow-up, and then decreased at 12-mon follow-up; in the end, there was a slight increase. Furthermore, in the MG, HDL cholesterol slightly decreased at 3-mon follow-up, increased at 6-mon follow-up, but again decreased at 12-mon follow-up; overall, there was a slight decrease. As such, the different aspect was shown in HDL cholesterol between the 2 groups (P-value for time × group interaction = 0.031). Except for the significant time × group interaction effect in HDL cholesterol, no other significant group effects or time-group interaction effects were observed.
The effect of self-efficacy and behaviors regarding diet on waist size change
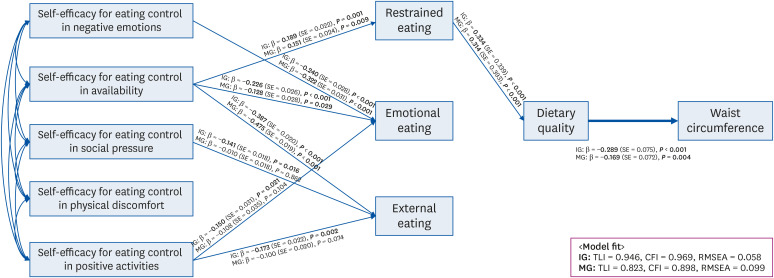
Fig. 2 shows the results of path analysis, which was separately performed for each group. The model was constructed by considering self-efficacy for eating control as the initial outcome, eating behaviors as an intermediate outcome, and waist circumference as the final outcome. As mentioned earlier, all possible paths were drawn at first; however, the paths that were not statistically significant in the IG data were removed to create a simple and clear model. The results for the model including all possible paths are shown in Supplementary Table 1. The analysis with data of IG revealed an acceptable model fit (TLI = 0.946, CFI = 0.969, and RMSEA = 0.058). Generally, the higher was the self-efficacy for eating control, the better were the restrained, emotional, or external eating behaviors. Also, the better was the dietary quality, the lower was the waist circumference. The only path that had an impact on the final outcome was self-efficacy for eating control in availability to restrained eating, to dietary quality, and then to waist circumference. This double mediating effect was statistically significant (P = 0.001). The MG data were also analyzed using the same model. The model fit (TLI = 0.823, CFI = 0.898, and RMSEA = 0.099) was lower as compared to that of IG. The path coefficients were similar as those of IG; however, some paths that were significant in IG were not significant in MG (namely, self-efficacy for eating control under social pressure to external eating, and self-efficacy for eating control in positive activities to emotional eating and to external eating). Specifically, while the path coefficients of dietary quality to waist circumference were β = −0.289, SE = 0.075, P < 0.001 in IG and β = −0.169, SE = 0.072, P = 0.004 in MG, a significant group difference in this path effect was observed at a P-value of < 0.10 (P = 0.095).
Fig. 2
Effects of self-efficacy and eating behaviors on abdominal obesity. The presented model was reconstructed by removing statistically non-significant (P > 0.05) paths in the IG data, to make a more parsimonious model. The bolded arrow indicates significant differences between the effects of the two groups at P < 0.10.
IG, intensive intervention group; MG, minimal information intervention group; TLI, Tucker Lewis Index; CFI, comparative fit index; RMSEA, root mean square error of approximation.
DISCUSSION
In summary, the results of the present study revealed that the people who received the intensive intervention program focusing on eating behavior improvement for the management of abdominal obesity showed an improvement in self-efficacy for eating control and diet quality at the end of the program. Abdominal obesity improved not only in the group provided with an intensive intervention, but also in the group provided with minimal information. Both groups generally showed improvements in eating control self-efficacy, eating behaviors, and abdominal obesity until 6-month follow-up. Even after that time point, improvements persisted, and a better state as compared to that of baseline in both groups was observed. Waist circumference decreased through the path of “improved self-efficacy for eating control in food availability—more restrained eating—improved dietary quality”. Most of the changes occurring at each follow-up were not significantly different between the 2 groups.
The results of the path analysis revealed that, by undergoing the program, the participants with higher confidence to refrain from eating when food was right in front of them had a higher quality diet (regarding the type and diversity of diet, as well as eating regularity), which might have resulted in a significantly reduced waist circumference. In fact, the IG participants indicated that there would be risky situations that would prevent them from changing to health behaviors, and several coping strategies were provided through booklets and counseling. That is, in situations where unhealthy food is available (which is a risky situation), the IG participants could have applied “healthy alternative behaviors,” such as eating healthy food, exercising, and talking to others, rather than involving in unhealthy behaviors. The acquired coping skills might have improved related self-efficacy, which led to improved diets and abdominal obesity.
With regard to the effect of self-efficacy on dietary behaviors, some of the previously reported findings in the literature are consistent with our results. Enhanced self-efficacy for weight control was reported to have an effect on improved dietary habits [43]. Furthermore, self-efficacy for eating resistance was reported to decrease binging or overeating behaviors [44]. In a study conducted with adolescent girls involving the investigation of self-efficacy to resist eating in a situation of food availability, results similar to those obtained in our study were noted, i.e. self-efficacy in availability and the total energy intake or consumption of snacks and desserts were inversely related to each other [45]. This result is analogous to our observation that those who believe in their ability to resist eating even though food is available appear to be less vulnerable to an environment abundant with unhealthy food. However, in other studies, self-efficacy was not found to have any effect on dietary behaviors such as low-sodium diet [46], fruit and vegetable intake [47], or overall dietary intake [48].
Among three kinds of eating behaviors, improvement in external or emotional eating behavior did not have any effect on waist circumference; however, an improvement in diet quality led to a reduction in waist circumference along the route of restrained eating. Moreover, the effect of diet quality on waist size was stronger in IG than in MG, which was different at a P-level of < 0.10. This might be because a significant improvement in dietary quality was observed only in the IG, and this improvement might have led to a reduction in the waist sizes of the IG study participants as different from those in MG. This gives rise to a pertinent question of why external or emotional eating behavior did not affect waist circumference ere. One possible explanation is that, while there may have been an improvement in these eating behaviors (through improvements in self-efficacy) in both groups, this change may not be substantial to cause a reduction in waist circumference. Another explanation is that these behaviors may not have any effect on waist size reduction due to some potential interactions with other factors. In fact, slightly larger improvements in external eating and emotional eating were noted in MG, and we assumed this to be a result of factors not considered in this study. Therefore, in further research, it is necessary to use qualitative methods to understand factors related to dietary and obesity improvement.
During 6 mon of the intervention period and an additional 6-mon follow-up, improvements in dietary self-efficacy, behavior, and abdominal obesity occurred in both groups. Between-group-comparison analysis showed that there was no significant difference in these changes between the two groups. The reason for the improvements in the MG, which was provided with a simple intervention consisting of regular health examinations and notification of examination results, can be explained as follows. The regular health check-up itself might have made people stay alert and led them to routine practicing of healthy behavior. According to a review of RCT studies that validated the effect of screening on health behavior [49], the trials on screening for risk factors suggested a positive effect on health behavior such as diet, physical activity [50], smoking [51], and adherence to guidelines for healthy living [52]. Being informed of the results after health check-ups might also have increased risk perception and led the study participants to increase the practice of healthy behavior. According to several previous studies, perceived health status is a factor that increases risk perception [53], and this “self-perceived health” is also closely related to health-related behavior [54]. The results of another meta-analysis study showed that increased risk perception is associated with the subsequent practice of health behavior [55]. Therefore, if it is not possible to provide intensive interventions, regular health check-ups with a brief consultation should be provided to induce people to increase practicing healthy behaviors.
Although the 12-mon change was not different between the two groups in most of the variables, the results of repeated-measures analysis of variance showed that there was a significant time × group interaction effect in HDL cholesterol. In IG, the level of HDL cholesterol fluctuated widely across 12 mon, as compared to that in the MG where a relatively moderate degree of change was observed. Lifestyle modification including dietary change, such as increasing intake of unsaturated fatty acids, is known as one of the factors that may increase HDL cholesterol levels [565758]. Therefore, it can be assumed that the dietary change of the participants who were recommended to correct poor quality diet and abnormal eating behaviors through the intensive intervention might have induced a fluctuation in the level of HDL cholesterol.
The present study makes several important contribution to previous research on abdominal obesity. First, we used behavioral theories for the development of the program. Many related previous publications did not report the use of health behavior change theories as the basis for the strategies used to deliver the intervention content. This aspect should be considered in future studies, as lifestyle modification interventions for abdominal obesity or cardiovascular risk factors mostly aim to promote healthier diets and increased physical activity. These 2 are healthy behaviors for which there is a significant amount of evidence supporting the effectiveness of health behavior theories to promote behavior change [5960]. Second, since the aim of our intervention was to improve abdominal obesity by raising self-efficacy, and given that the results showed that individuals with high self-efficacy in food availability had an improved diet quality which, in turn, improved abdominal obesity, this study contributes to the prevention and improvement of the obesity problem. In a modern day food environment where high-calorie and nutrient- poor foods are readily available [61], individuals are already aware of which food is good or bad for health, but have less control over their own food consumption. Third, the present study identified pathways through which specific eating-related attitudes and eating habits initiate an improvement in abdominal obesity. As our program aimed to improve abdominal obesity through increasing self-efficacy of eating control and through better eating behaviors, the effectiveness of the intervention was evaluated based on the framework created during the development stage.
The present study has several limitations. First, the participant dropout rate was higher than expected (23.8% from baseline to 3-mon follow-up; 26.5% for IG and 21.2% for MG, 36.7% from baseline to 6-mon follow-up; 40.5% for IG and 32.9% for MG, and 46.7% from baseline to 12-mon follow-up; 48.5% for IG and 44.9% for MG). However, we also included the participants who dropped out on the basis of intention-to-treat (known to be one of the most conservative methods of estimating treatment effect) [62] and verified the effectiveness of the intervention. An additional analysis was conducted to evaluate whether there was a difference between 311 people who completed 12-mon follow-up and 272 people who dropped out. The results showed that the proportion of women (65.3% vs. 57.4%, P = 0.050), mean age (54.8 years vs. 52.7 years, P = 0.016), mean score of self-efficacy for eating control in positive activities at baseline (6.55 vs. 6.23 points), and mean score of overall dietary quality at baseline (35.13 vs. 33.68 points) were higher among the people who completed a 12-mon follow-up. In other key variables, no significant differences were observed. Generally, women [6364656667] and older people [66] are known to have higher concerns about health. Also, people with higher concerns about health practice more healthy behaviors, such as having a quality diet, as compared to people with lower concerns about their health [6869]. In subsequent research, the strategies to prevent dropouts of individuals such as men and relatively younger age groups should be developed and implemented. Second, owing to our selection of the participants from those individuals who visited medical facilities and who might have had a particular interest and motivation in improving their health (as opposed to those who did not volunteer to participate), there is a possibility of volunteer bias. Said differently, the effects of the program might not be the same among people with low health-related interest. Third, the magnitude of changes in the scores for eating control self-efficacy, dietary quality, or and eating behavior from baseline to each follow-up was not large. In particular, even there were statistically significant increases for dietary quality scores in the IG, the scores were still in the “moderate” dietary quality range at baseline and at subsequent follow-ups. However, those changes, despite their small magnitude, had a meaningful effect on the decrease in waist circumference. Moreover, the improved aspects of the dietary quality were consistently observed and compared with the baseline, and we could verify the effect of the intensive intervention on improved dietary quality.
The results of the present study demonstrated that an intensive intervention focusing on the changes in diet and eating habits helped to prevent and manage abdominal obesity and cardiovascular risk factors; this effect occurred through a step-by-step process of change in dietary self-efficacy, behavior, and health status. The effect was maintained even until six months after the intervention. Generally, improvements in dietary self-efficacy, behavior, and abdominal obesity were also observed in the participants who received regular health check-ups with minimal information. The results of the present study can be used as the basis for the development and implementation of more successful interventions to reduce abdominal obesity in order to combat MetS. Future programs should focus on increasing the domain-specific self-efficacy by providing individuals with behavioral skills and training them to better deal with risk situations that prevent the implementation of healthy eating.
 XML Download