

 PDF
PDF Citation
 Print
Print


INTRODUCTION
With the major changes in people's lifestyle and dietary structure in recent years, the prevalence of hyperuricemia has significantly increased [1]. In addition, it has been found that hyperuricemia is an independent risk factor affecting renal function [2], which seriously threatens human health. Renal injury caused by hyperuricemia is mainly triggered by the accumulation of large amounts of uric acid crystals in the collecting ducts, pelvis, and ureters of the kidney during a short period of time. Urate crystals are deposited in renal tissues and block renal tubules, causing acute and chronic uric acid nephropathy and uric acid kidney stones. In patients with long-term hyperuricemia, the renal structure is impaired, which can lead to renal fibrosis formation, glomerulosclerosis, arteriosclerosis, and arterial wall thickening [3]. Currently, allopurinol is the main drug used for the treatment of hyperuricemia, but serious side effects such as allergic reactions and damage to the blood system, liver, and kidney limit its clinical application [4]. Resveratrol does not have such side effects. In this study, the effects of resveratrol on the inflammatory response and renal injury in hyperuricemic rats were investigated.
Resveratrol is a polyphenolic compound, chemically known as 3,5,4′-trihydroxystyrene, which was first extracted from white hellebore in 1940. Animal studies on the protection of renal function by resveratrol have focused on diabetes [5], gestational diabetes, a high-fat diet [6], a high-sugar diet, and other rat models [7]. Additionally, resveratrol has been reported to exhibit nephroprotective effects in potassium oxinate-induced hyperuricemic mice [8]. Moreover, the expression of organic ion transporter protein is increased in this model. Despite these findings, the mechanism of resveratrol regulating hyperuricemic nephropathy is still not clear.
Resveratrol has a variety of biological effects, such as antioxidant stress, anti-inflammatory, antitumor, neuroprotection, and regulation of blood lipids. Furthermore, resveratrol has protective effects against gout, renal inflammation in diabetic rats, lipopolysaccharide-mediated acute renal injury, and renal ischemia–reperfusion injury in rats [9]. The mechanism may be related to the improvement of antioxidant enzyme activity, reduction of oxidative stress injury, anti-inflammatory effects, and inhibition of renal tissue cell apoptosis by resveratrol. In addition, resveratrol treatment has been reported to attenuate contrast-induced nephropathy and to inhibit the expression of interleukin (IL)-1β [10]. Moreover, in a model of polycystic kidney disease, resveratrol has been demonstrated to decrease the expression levels of monocyte chemoattractant protein-1 and tumor necrosis factor (TNF)-α in a dose-dependent manner [11]. Likewise, resveratrol has been shown to decrease the levels of the proinflammatory cytokines IL-1, IL-6, and TNF-α in the blood of rats with type 2 diabetes [1213]. Thus, we hypothesized that resveratrol may protect against hyperuricemic nephropathy by regulating the inflammatory response.
In this study, resveratrol was used to interfere with a rat model of hyperuricemia with renal injury, which was induced by adenine and potassium oxinate. The anti-inflammatory and antioxidative effects of resveratrol in hyperuricemic rats were evaluated. The present study sheds light on the possible protective mechanism of resveratrol on hyperuricemic nephropathy.
Go to : 
MATERIALS AND METHODS
Animals
Specific pathogen-free male Sprague-Dawley rats (2 months old, 150–200 g, n = 40) were provided by the Guangdong Experimental Animal Center (certificate No.: 44007200044758, license No.: SCXK2013-0002). All animal experiments were approved by the Research Ethics Committee of Guangdong General Hospital (No. GDREC2017199A). Adaptive feeding was conducted for 1 week before the experiment, and the animals were allowed free access to food and water throughout the experiment.
Experimental protocol
After adaptive feeding for 1 week, 40 rats were randomly divided into the following 5 groups (8 mice per group): control group, hyperuricemia group, hyperuricemia with low-dose resveratrol (25 mg/kg, catalog number: CY170927, Yangling Ciyuan Biotechnology Co., Ltd., Xi'an, China) group, hyperuricemia with medium-dose resveratrol (50 mg/kg) group, and hyperuricemia with high-dose resveratrol (100 mg/kg) group [14].
To induce hyperuricemia [15], a drug mixture containing adenine (100 mg/kg/day, catalog number: rz1006, Shanghai Ruiyong Biological Technology Company, Shanghai, China) and potassium oxinate (1,000 mg/kg/day, TCI brand, Tokyo Chemical Industry Company, Tokyo, Japan; OSHA Haz Com: CFR 1910.1200) was diluted into a 200-mL suspension with distilled water. For the control group, the mice were fed with distilled water. For the hyperuricemia group, the mice were orally administered with the drug mixture (20 mL/kg/day). For the other three groups, the mice were fed with the drug mixture (20 mL/kg/day) in the morning and resveratrol (25, 50, or 100 mg/kg/day, respectively) in the afternoon. The experiments were performed for 21 days, and the body weight of each rat was recorded daily (Fig. 1A).
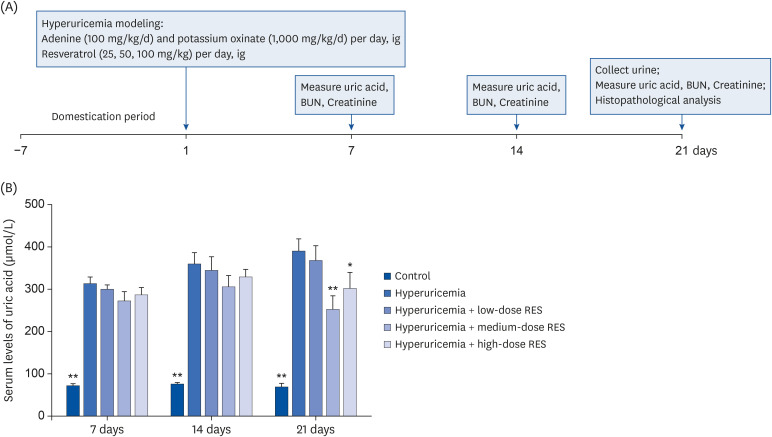 | Fig. 1The serum uric acid level in the hyperuricemia group after treatment with different dosages of resveratrol. (A) Adenine (100 mg/kg/day) and potassium oxinate (1,000 mg/kg/day) or vehicle were orally administered every morning. Low-dose (25 mg/kg/day), medium-dose (50 mg/kg/day), and high-dose (100 mg/kg/day) RES were administered every afternoon. (B) The serum levels of uric acid from the control or hyperuricemic rats treated without or with different concentrations of RES were measured. Samples were collected at 7, 14, and 21 days after treatment. Data are expressed as the mean ± SEM (n = 8).RES, resveratrol; SEM, standard error of the mean; BUN, blood urea nitrogen.
*P < 0.05, **P < 0.01 compared with the hyperuricemia group.
|
Biochemical analysis
For the collection of urine, all animals were allowed water but no food after the final gavage. Urine was collected for 24 h and was centrifugated at 3,500 rpm. The supernatant was used for biochemical analysis of the urinary protein contents, microalbuminuria, and β2-microglobulin.
For detection of various indicators in serum, blood was collected from the tail vein once on days 7, 14, and 21 in each group. After the urine was collected in each group, blood was collected from the abdominal aorta after intraperitoneal injection of 3% pentobarbital sodium (catalog number: SLBZ4028, Sigma-Aldrich, St. Louis, MO, USA) at a dose of 1 mL/kg, according to the body weight of the rats. The blood samples were placed at room temperature for 1 h and centrifuged at 2,500 rpm for 15 min. Serum was placed into a sterile Eppendorf tube and frozen at −80°C. The serum uric acid, urea nitrogen, and creatinine levels were determined using a Cobas 702 automated blood analyzer (Roche Diagnostics, Mannheim, Germany).
The mice were sacrificed after the experiment, and the capsule of the left kidney was removed on ice and weighed. The renal index was calculated as the kidney weight (g)/body weight (g) × 1,000.
Histopathological evaluation
The left kidney was fixed with 4% paraformaldehyde solution (catalog number: XS185005, Wuhan Servicebio Company, Wuhan, China), embedded in paraffin, sectioned, dewaxed, and hydrated. After conventional hematoxylin and eosin (H&E) staining, the morphological and structural changes of the renal tissues in each group were observed by optical microscopy at 200× magnification.
Enzyme-linked immunosorbent assay (ELISA)
The serum samples were collected and kept at −80°C. The malondialdehyde (MDA), superoxide dismutase (SOD), xanthine oxidase (XOD), total antioxidant capacity (TAOC), IL-1β, IL-6, and TNF-α levels were determined using rat ELISA kits (catalog numbers: mb-1926a, mb-1927a, mb-6649a, mb-6651a, mb-1588a, mb-1731a, and mb-1721a, respectively), according to the manufacturer's instructions. All these kits were purchased from the Jiangsu Microplate Biotechnology Company (Jiangsu, China).
Statistical analysis
All data were statistically analyzed using SPSS ver. 13.0 software. The measurement data are presented as the means ± standard error of the mean (SEM). The differences of means between multiple groups were compared using one-way analysis of variance. Dunnett's t-test was applied for the intergroup comparisons. The enumeration data are expressed as a percentage and were examined using the χ2 test. P < 0.05 was considered to be statistically significant.
Go to :
RESULTS
Effect of resveratrol on uric acid levels in rat serum
As shown in Fig. 1B, compared with the control group, the serum uric acid level in the hyperuricemia group was significantly increased (P < 0.01). Meanwhile, compared with the hyperuricemia group, the serum uric acid levels were decreased in the hyperuricemia groups treated with different dosages of resveratrol, especially in the high-dose group at 21 day (P < 0.01).
Effects of resveratrol on body weight and kidney indices in hyperuricemic rats
The body weight and kidney indices of the hyperuricemic rats are summarized in Fig. 2. There was no significant difference in the body weight between the control group and the model group (P > 0.05). However, there was a trend of weight loss in the groups treated with different dosages of resveratrol. Compared with the control group, the kidney indices in the hyperuricemia group were significantly increased (P < 0.01); while there were no obvious differences between the hyperuricemia group and the hyperuricemia groups treated with various dosages of resveratrol.
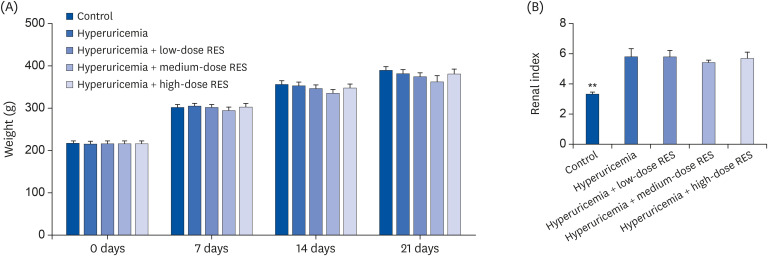 | Fig. 2The body weight and kidney indices of the hyperuricemic rats were measured after treatment with resveratrol. (A) The body weight and (B) kidney indices of the control or hyperuricemic rats treated without or with different concentrations of RES were measured at 0, 7, 14, and 21 days after treatment. Data are presented as the mean ± SEM (n = 8).RES, resveratrol; SEM, standard error of the mean.
**P < 0.01 compared with the hyperuricemia group.
|
Effects of resveratrol on the serum biochemical indicators in hyperuricemic rats
Compared with the control group, the serum levels of creatinine and urea nitrogen in the hyperuricemia group were significantly increased (P < 0.01). Meanwhile, compared with the hyperuricemia group, the levels of serum creatinine were decreased in the hyperuricemia groups treated with different dosages of resveratrol, especially in the high-dose group at 21 day (P < 0.01). However, there was no significant difference in the serum levels of urea nitrogen between the hyperuricemia group and the groups treated with different dosages of resveratrol (Fig. 3).
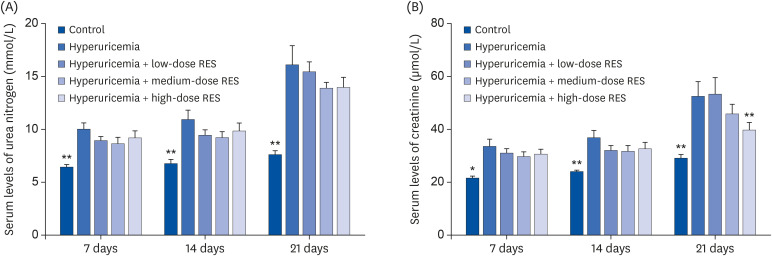 | Fig. 3The different doses of RES were administered every afternoon. (A) Serum urea nitrogen and (B) creatinine were measured to assess the renal function. Data are presented as the mean ± SEM (n = 8).RES, resveratrol; SEM, standard error of the mean.
*P < 0.05, **P < 0.01 compared with the hyperuricemia group.
|
Effects of resveratrol on urine biochemical indicators in hyperuricemic rats
As shown in Fig. 4, compared with the control group, the levels of urine protein contents, microalbumin, and β2-microglobulin in the hyperuricemia group were significantly increased (P < 0.01). Meanwhile, compared with the hyperuricemia group, the levels of microalbumin and β2-microglobulin were significantly decreased in each group treated with resveratrol, especially in the medium-dose group (P < 0.01). However, the level of urine protein contents was not significantly different between the hyperuricemia group and each resveratrol group.
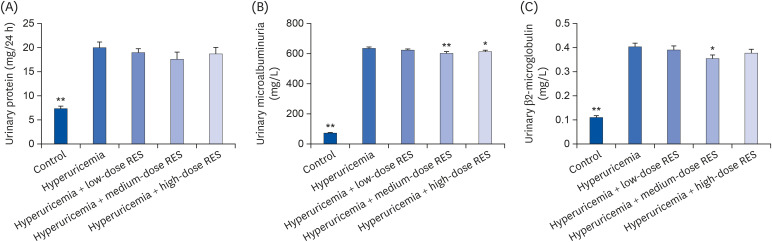 | Fig. 4The levels of (A) urine protein contents, (B) microalbumin, and (C) β2-microglobulin in urine from the control or hyperuricemic rats treated without or with different concentrations of RES were measured. Data are presented as the mean ± SEM (n = 8).RES, resveratrol; SEM, standard error of the mean.
*P < 0.05, **P < 0.01 compared with the hyperuricemia group.
|
Effects of resveratrol on morphologic changes in hyperuricemic rat kidneys
Compared with a normal kidney size in the control group, the kidneys were swollen and had a white granular surface in the hyperuricemia group (Fig. 5). After H&E staining, the kidney slices in the hyperuricemia group were characterized by tubular dilatation, cast formation, edema, and even a decrease in the number of renal tubular epithelial cells, suggesting that the pathological injury of the kidney in each resveratrol group was improved to different degrees, especially in the medium- and high-dose groups.
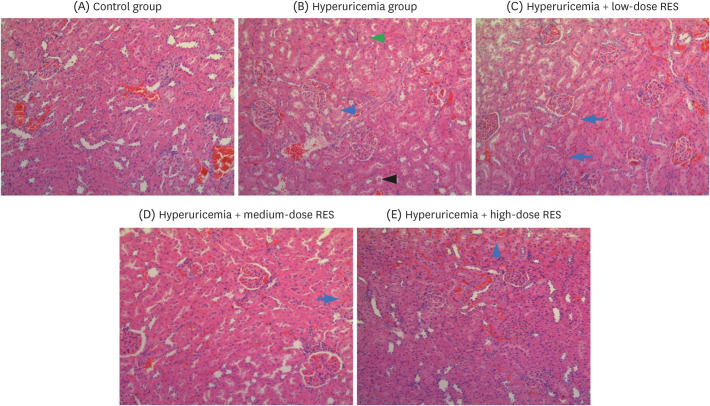 | Fig. 5RES ameliorates renal morphological changes and reduces the infiltration of inflammatory cells in the kidney. Representative photographs of H&E-stained rat renal sections at a magnification of 200×. The groups were as follows: control group, hyperuricemia group (sham), hyperuricemia with low-dose RES, hyperuricemia with medium-dose RES, and hyperuricemia with high-dose RES. The blue arrows represent eosinophilic insoluble proteins; the black arrow represents salt crystals; and the green arrow represents edema of renal tubular epithelial cells.RES, resveratrol; H&E, hematoxylin and eosin.
|
Effects of resveratrol on the inflammatory and oxidative responses
To further investigate the effects of resveratrol on the inflammatory and oxidative responses, the levels of MDA, SOD, TAOC, IL-1β, IL-6, and TNF-α in kidney tissue (Fig. 6) and the levels of SOD, XOD, TAOC, IL-1β, IL-6, and TNF-α in serum (Fig. 7) were evaluated by ELISA. Compared with the control group, the renal MDA level in the hyperuricemia group was significantly increased (P < 0.01); and it was decreased in each resveratrol group, especially in the medium-dose group. Compared with the control group, the serum level of XOD in the hyperuricemia group was significantly decreased; and it was increased by resveratrol treatment, especially in the high-dose group. In addition, compared with the control group, the levels of SOD and TAOC were decreased and the levels of IL-1β, IL-6, and TNF-α were increased in kidney tissue and serum; and these levels could be reversed by resveratrol treatment (all dosages).
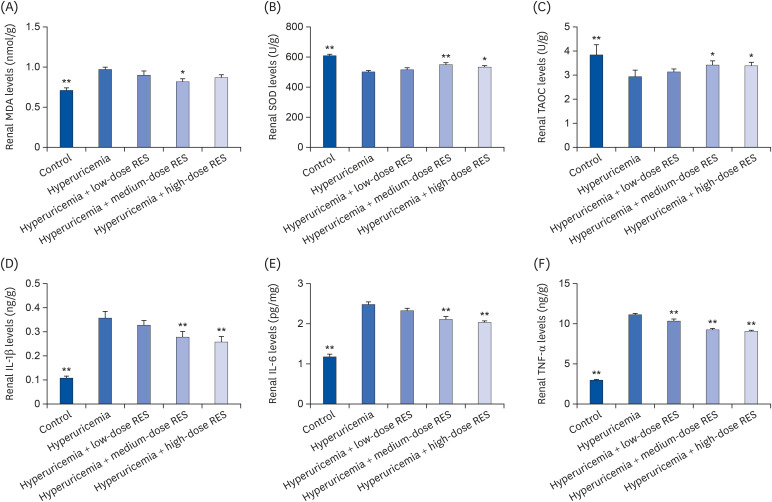 | Fig. 6RES preserves rat renal function and reduces cytokine production induced by hyperuricemia. The concentrations of (A) MDA, (B) SOD, (C) TAOC, (D) IL-1β, (E) IL-6, and (F) TNF-α in kidney tissue were measured by ELISA. The groups were as follows: control group, hyperuricemia group, hyperuricemia with low-dose RES, hyperuricemia with medium-dose RES, and hyperuricemia with high-dose RES. Data are presented as the mean ± SEM (n = 8).MDA, malondialdehyde; SOD, superoxide dismutase; TAOC, total antioxidant capacity; IL-1β, interleukin-1β; TNF-α, tumor necrosis factor-α; ELISA, enzyme-linked immunosorbent assay; RES, resveratrol.
*P < 0.05, **P < 0.01 compared with the hyperuricemia group.
|
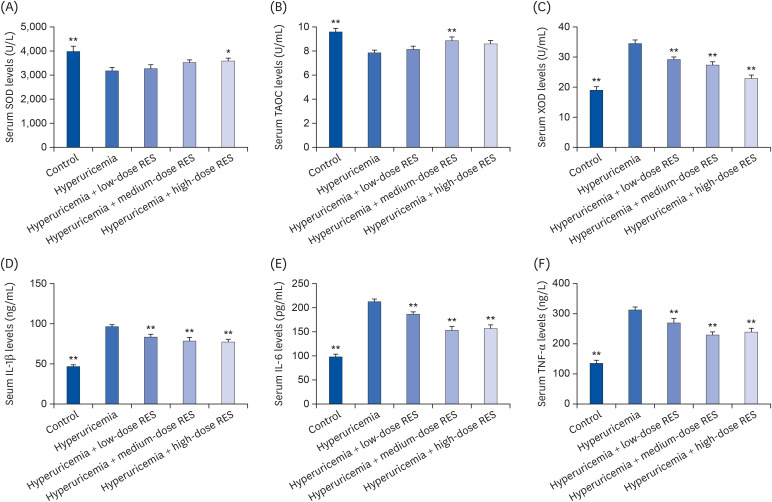 | Fig. 7The levels of (A) SOD, (B) TAOC, (C) XOD, (D) IL-1β, (E) IL-6, and (F) TNF-α in serum were measured by ELISA. The groups were as follows: control group, hyperuricemia group, hyperuricemia with low-dose RES, hyperuricemia with medium-dose RES, and hyperuricemia with high-dose RES. Data are presented as the mean ± SEM (n = 8).SOD, superoxide dismutase; TAOC, total antioxidant capacity; XOD, xanthine oxidase; IL, interleukin; TNF, tumor necrosis factor; ELISA, enzyme-linked immunosorbent assay; RES, resveratrol.
*P < 0.05, **P < 0.01 compared with the hyperuricemia group.
|
Go to :
DISCUSSION
In the present study, a rat model of hyperuricemic nephropathy was successfully established by the oral administration of a mixture of adenine and potassium oxinate. Vesicular degeneration, glomerular atrophy, tubular dilatation, infiltration of inflammatory cells, and interstitial fibrosis were obviously observed in the hyperuricemia group. Resveratrol treatment could reduce the urea nitrogen, creatinine, and uric acid levels as well as the urinary protein contents. Furthermore, resveratrol exhibited obvious anti-inflammatory and antioxidative effects in hyperuricemic rats, suggesting that resveratrol may protect against hyperuricemic nephropathy by regulating the inflammatory and oxidative responses.
The innate immune system provides the first barrier to infection and disease through various processes including activation of inflammation. Inflammation is a biological process whereby immune cells, including macrophages, respond to and work together to eliminate damage from injury and disease. In this study, resveratrol treatment reversed the increased levels of IL-1β, IL-6, and TNF-α in kidney tissue and serum under hyperuricemic conditions, indicating that regulation of the inflammatory response may be a crucial part of resveratrol protecting against hyperuricemic nephropathy. Additionally, resveratrol has been demonstrated to alleviate acute kidney injury in lipopolysaccharide-treated mice [16] and to reduce the serum levels of TNF-α, IL-1β, and IL-6 in septic rats [171819]. However, nuclear factor (NF)-related factor 2 signaling also has been shown to be regulated by resveratrol in sepsis-induced acute kidney injury [20]. In another study, resveratrol has been shown to ameliorate cyclosporine-induced renal injury [21]. Meanwhile, in cisplatin-treated mice, resveratrol decreased the interstitial leukocytic infiltration in kidney tissues and lowered the serum levels of urea, creatinine, IL-1β, and TNF-α. Furthermore, resveratrol protected against kidney injury in spontaneously hypertensive rats by inhibiting the expression of IL-6, intercellular adhesion molecule 1, and monocyte chemoattractant protein-1 [22]. It is interesting that pretreatment with resveratrol has been demonstrated to increase the mRNA expression of cytokine genes such as cyclooxygenase 2, TNF-α, IL-1β, IL-8, etc. [23]. Additionally, resveratrol treatment has been shown to increase TNF-α and NF-κB mRNA levels as well as to decrease caspase 3 cleavage in a rat renal ischemia–reperfusion injury model [24]. These findings were confirmed by the report by Li et al. [25], which revealed that resveratrol alleviates oxidative stress in the same animal model and lessens H2O2-induced NRK-52E cell apoptosis. However, resveratrol has shown no protective effect on ischemia-induced kidney injury in a rat model [26]. These discrepant results may be caused by the different conditions of kidney ischemia.
The protective mechanism of resveratrol also involves regulation of the oxidative response. Resveratrol has been shown to decrease intracellular reactive oxygen species levels via downregulation of the nicotinamide adenine dinucleotide phosphate oxidase subunits NOX1 and NOX4 in high glucose-treated human tubular epithelial cells (HK2) [27]. In addition, resveratrol has been demonstrated to ameliorate post-contrast acute kidney injury (PC-AKI) following diabetic nephropathy in vivo and in vitro [28]. Moreover, resveratrol reduced the expression levels of IL-1β and cell apoptosis in a PC-AKI model [10]. Furthermore, targeting renal oxidative stress with resveratrol could alleviate nicotine-induced renal injury [29]. These findings are in agreement with the results of this study. We found that the serum levels of key regulators of the oxidative response, such as SOD, XOD, and TAOC, were increased under hyperuricemic conditions and that these levels could be reversed by resveratrol treatment. Resveratrol also has been shown to activate manganese SOD in renal proximal tubule cells (NRK52E), thus protecting against nicotine-induced oxidative injury [30]. Moreover, supplementation of resveratrol improved glomerular filtration as well as decreased proteinuria, oxidative stress, and the levels of circulating SOD in a pig model of kidney autotransplantation [31]. Furthermore, the higher kidney tissue levels of MDA and the lower levels of reduced glutathione and activities of glutathione peroxidase and superoxide dismutase were reversed by resveratrol treatment [32]. Resveratrol also exhibited a protective effect against cisplatin-induced kidney oxidative injury in rabbits [33] and trifluralin toxicity in rats [34]. In addition, resveratrol has been shown to be protective against aluminum chloride-induced nephrotoxicity in rats as well as reduce renal oxidative stress and the inflammatory response [35].
In conclusion, we investigated the effect of resveratrol on hyperuricemia and kidney inflammation in adenine and potassium oxinate-induced hyperuricemic rats. The medium-dose and high-dose resveratrol groups showed good hypouricemic effects and inflammation-reducing effects in kidney tissue and serum. Thus, our results provide new evidence showing the effect of resveratrol on hyperuricemia and inflammation.
Go to :
 XML Download