

 PDF
PDF Citation
 Print
Print


INTRODUCTION
Health indicators, such as the mortality rate or life expectancy (LE) in subnational areas, provide information that is necessary to improve community health and to address local health problems in vulnerable geographic areas. Local governments in Korea are establishing regional health care plans at the district level (i.e., ‘si’, ‘gun’, ‘gu’) to improve the quality of health care services for local residents and thereby to improve the health of local residents.1 LE presented at the district level could be used as a performance indicator of health policies, and calculating the LE gaps across geographic areas at the district level each year could help achieve a long-term health equity policy.
The National Health Insurance Service (NHIS) in Korea is the mandatory health insurance scheme for the entire Korean population. The National Health Information Database (NHID) provided by the NHIS consists of sub-databases (DBs) including the eligibility DB, the healthcare utilization DB, the health screening DB, and the healthcare provider DB.2 The NHID DB has been used to monitor health status and health equity at the national and local levels for the entire Korean population. Several Korean studies have examined subnational life expectancies using the NHID DB.345678 Bahk et al.3 showed that the crude mortality rate and LE at birth across the national, provincial, and district levels calculated using the NHID DB were consistent with the corresponding results calculated using the Korean Statistical Information Service (KOSIS) data from Statistics Korea, indicating that the NHID DB was a good source for monitoring the mortality rate and LE with representation of the entire Korean population. Kim et al.4 presented town-level life expectancy and other mortality metrics using the NHID DB. Lim et al.5 used the NHID DB to measure differences in quality-adjusted life expectancy by income in Korea at the national and district levels. Bahk et al.6 presented LE for 253 electoral constituencies in Korea using the NHID DB. However, these studies on LE and mortality metrics at the local level in Korea have limitations because their analyses were based on the assumption that observations are independent from one another (i.e., that there is no spatial autocorrelation), despite similar mortality rates in adjacent regions. Similarly, mortality rates in adjacent years should not be assumed to be independent from one another.
Moreover, estimating LE at the local level in Korea may encounter difficulties because of the rarity of deaths and small populations, especially in rural areas, which lead to uncertainty in estimating mortality rates. A previous study reported that the minimum population required to calculate a stable LE was 5,000.9 In order to ensure the minimum population needed to calculate income-quintile specific LE in small areas, Bahk et al.3 used 6-year pooled data and Lim et al.5 used 7-year pooled data for the number of population and deaths in each region. As a result, it was impossible to estimate LE by year.
These issues could be addressed effectively within the framework of spatio-temporal modeling, which allows for dependence of mortality rates on both space and time and improves the robustness of mortality estimates in subnational populations. Studies on the estimation of LE and mortality metrics at the local level using spatio-temporal models have been recently conducted,1011121314 but, to the best of our knowledge, no such studies have been conducted in Korea. This study aimed to estimate the annual district-level LE at birth in Korea based on the estimated mortality rates from spatio-temporal models using the NHID DB.
METHODS
Data sources
We obtained aggregated data from the NHID provided by the NHIS on the numbers of deaths and population by gender (both sexes, men, women) over the course of 14 years (2004–2017), divided into 19 age groups (0, 1–4, 5–9, …, 80–84, and 85+ years), and 250 districts based on the administrative districts in Korea in 2017 (the most recent year available at the time of this study). As administrative district classification criteria have changed several times during the study period (2004–2017), we reclassified the districts by year according to this 2017 administrative district classification to maintain the consistency of administrative district classifications in the NHID DB. In particular, the Sejong Special Provincial Municipality, which was established in 2012, was reclassified using the previous administrative district (‘dong’ unit). These reclassification processes have been applied in the previous studies.3578
Because there is considerable variation in education levels among districts in Korea, a district-level covariate for the proportion of the population aged 25 years or older who have completed a 4-year college or higher (= the number of people over 25 years old who have graduated from a 4-year college or higher / the number of people over 25 years old) was used in the spatio-temporal model. The covariate was created using data from the Population and Housing Census of Korea, with the proportion of college graduates from 2004 to 2009 based on the 2005 census data, the proportion of college graduates from 2010 to 2014 based on the 2010 census data, and the proportion of college graduates from 2015 to 2017 based on the 2015 census data.
Statistical analysis
Spatial autocorrelation of mortality rates
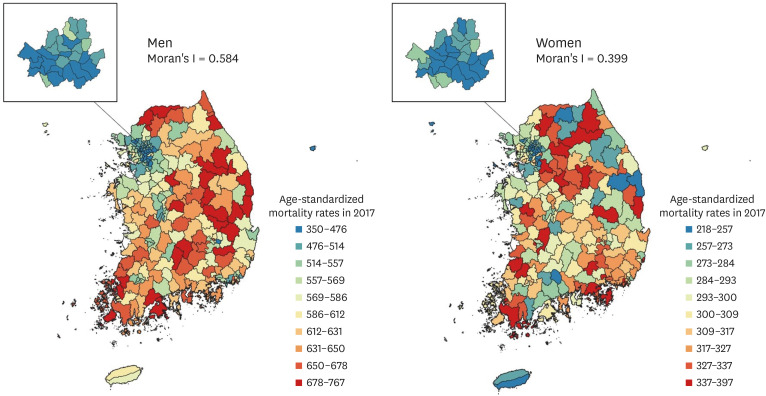
Fig. 1 shows the distribution of age-standardized mortality rates at the district level by gender in 2017. The age-standardized mortality rates show little evidence of complete spatial randomness. Age-standardized mortality rates in neighboring districts were similar and showed clustered patterns. The extent to which similar (or dissimilar) districts are clustered can be quantified by a measure, such as Moran's I spatial statistic,15 a measure of global spatial autocorrelation that measures how the mortality rate in one district is similar to others surrounding it: Moran's I spatial statistic is close to +1 when similar values are spatially clustered, 0 when mortality rates are completely randomly distributed (i.e., no spatial autocorrelation), and -1 when dissimilar values are next to each other. Moran's I spatial statistic for age-standardized mortality rates at the district level by gender in 2017 was 0.584 for men and 0.399 for women, respectively, supporting the need to calculate LE based on mortality rates at the district level estimated using models that allow spatial dependence. The distribution of age-standardized mortality rates at the district level for both sexes in 2017 is given in Supplementary Fig. 1. Moran's I spatial statistic for both sexes was 0.611.
Spatio-temporal model
The allocation of numbers of deaths into units grouped by gender, 19 age groups, and 250 districts can result in few deaths in some units, leading to highly variable estimates of mortality rates. To overcome this issue, we used a Bayesian hierarchical model to estimate mortality rates by sharing information across age groups and regions and over time. In this approach, mortality rates for each age group, region, and year are informed by data in that age group-region-year unit, as well as by those in the adjacent age groups, adjacent districts, and adjacent years. The extent to which the estimated mortality rates are affected by adjacent units depends on the number of deaths, with larger groups and those with higher mortality rates being mostly informed by their own data and smaller groups with lower mortality rates being affected by a combination of their own data and data in other units.
The following model13 was used to estimate mortality rates by age group, region, and year, and then LE was calculated based on the estimated mortality rates. All analyses were done separately by gender (men, women, and both sexes combined):
where mita is the mortality rate in region i (= 1, …, 250 district), year t (= 0, …, 13, renumbered sequentially from 2004–2017), and age group α (= 0, …, 18, renumbered sequentially from 0, 1–4, 5–9, …, 80–84, and 85+); β0 is a fixed intercept; Xit is a vector of covariates for region i and year t, and β1 is the associated vector of regression coefficients; γ1,i is a region-level random intercept; γ2,i and γ4,i are region-level random slopes for year and age group, respectively; γ3,it, γ5,ia, and γ6,ta are random intercepts on the region-year level, the region-age group level, and the year-age group level, respectively. γ1,i, γ2,i, and γ4,i were each assumed to follow a conditional autoregressive (CAR) distribution1617 and these random effects allow for spatial variation beyond those already described by covariates at the overall level (γ1,i), linear deviation from the overall time trend (γ2,i), and linear deviation from the overall age group trend (γ4,i). The spatial structure of the CAR prior was imposed through an adjacency matrix W of size n × n, with n being the number of regions. The diagonal entries of W are 0, and the off-diagonal entries are specified such that wij = 1 if regions i and j are neighbors and wij = 0 otherwise. In this study, spatial weights based on Queen contiguity, which defines neighbors as spatial regions sharing a common edge or a common vertex, were used. γ3,it and γ5,ia were assumed to follow N(0, ?2γ3) and N(0, ?2γ5)
 , respectively. These random effects allow for non-linear region-level deviations in the year and age group trends that are not captured by other trend components (i.e., linear deviations are accounted for by γ2,i and γ4,i). γ6,ta was assumed to follow a normal distribution, with the precision matrix specified as the Kronecker product of the structure matrices using a first-order random walk for each of year and age group (i.e., a type IV interaction in the Knorr-Held classification17), which allows for simultaneous smoothing over year and age groups. logGamma (1, 0.001) hyper-priors were specified for the logarithm of the precision of each random effect and normal (0, 1000) hyper-priors were used for the common intercept and slope.
and N(0, ?2γ5), respectively. These random effects allow for non-linear region-level deviations in the year and age group trends that are not captured by other trend components (i.e., linear deviations are accounted for by γ2,i and γ4,i). γ6,ta was assumed to follow a normal distribution, with the precision matrix specified as the Kronecker product of the structure matrices using a first-order random walk for each of year and age group (i.e., a type IV interaction in the Knorr-Held classification17), which allows for simultaneous smoothing over year and age groups. logGamma (1, 0.001) hyper-priors were specified for the logarithm of the precision of each random effect and normal (0, 1000) hyper-priors were used for the common intercept and slope.Calculation of life expectancy at birth
LE at birth was calculated based on the life table method, using the mortality rates at the district level estimated from the spatio-temporal models. Separate life tables were established for each combination of gender (both sexes, men, and women), 250 districts, and 14 years. We employed the Kannisto-Thatcher method18 to expand the terminal age group 85+ to estimate the probability of dying for each of the 5-year age groups 85–89, 90–94, …, 120–124, 125+. The 95% credible intervals (CIs) for LE at birth were calculated based on the 2.5th and 97.5th percentiles of the posterior distribution of the estimated mortality rates.
All statistical analyses were performed using SAS version 9.4 (SAS Institute Inc., Cary, NC, USA) and R version 3.4.1 (www.r-project.org). The models for estimating mortality rates were implemented in the R-INLA software. Subsequent procedures for estimating LE at birth were performed using SAS. The maps were created using QGIS version 3.12.0.
RESULTS
Table 1 summarizes the results for death at the national and district levels from 2004 to 2017. The first section shows the number of population, the number of deaths, and age-standardized mortality rates at the national level: for example, in 2017, 145,935 of 25,062,848 men died, and the age-standardized mortality rate per 100,000 population was 548 in men, which was higher than the corresponding rate of 290 in women. The age-standardized mortality rate at the national level decreased by 333 deaths per 100,000 population in men and by 185 deaths per 100,000 population in women between 2004 and 2017. Differences in the age-standardized mortality gap between men and women tended to increase over time. The second section shows the distribution of age-standardized mortality rates in districts: for example, in 2017, the mean (standard deviation) of age-standardized mortality rates in men was 583 (80) deaths per 100,000 population, and the lowest mortality rate in men was 350 deaths per 100,000 population, compared with 537, 585, and 642 deaths per 100,000 population in districts in the 25th, 50th, and 75th percentiles, respectively, and 767 deaths per 100,000 population in the district with the highest rate. The difference between the minimum and maximum age-standardized mortality rate in districts decreased by 306 deaths per 100,000 population in men and by 182 deaths per 100,000 population in women between 2004 and 2017. The last column in the second section shows Moran's I spatial statistic. From 2004 to 2017, Moran's I spatial statistic ranged from 0.552 to 0.623 for men and from 0.329 to 0.482 for women, indicating that there were geographic patterns of spatial clustering in age-standardized mortality rates across districts. The results for both sexes combined are provided in Supplementary Table 1.
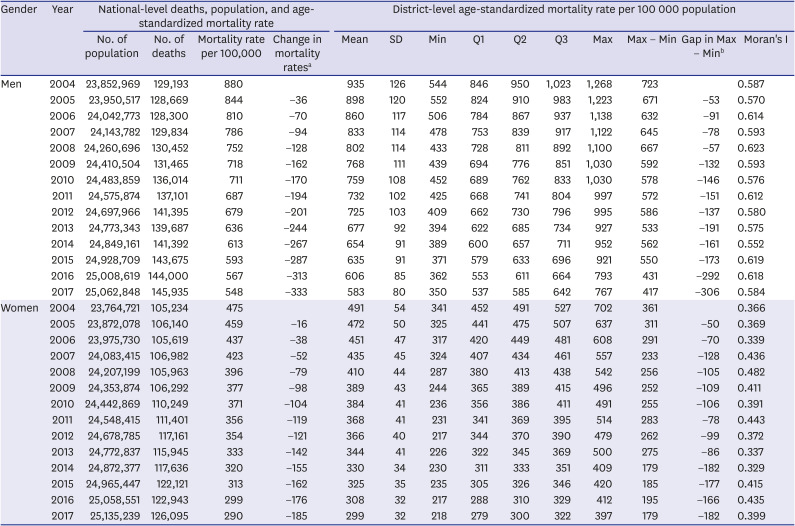
Table 1
National-level deaths, number of population, and age-standardized mortality rates, and district-level distribution of age-standardized mortality rates by gender in Korea, 2004–2017
SD = standard deviation, Q1 = 25th percentile, Q2 = 50th percentile, Q3 = 75th percentile.
aChange in mortality rates: the gap in age-standardized mortality rate per 100,000 population between 2004 and each year; bGap in Max − Min: the gap in the difference between the maximum and minimum age-standardized mortality rate per 100,000 population between 2004 and each year.
![]()
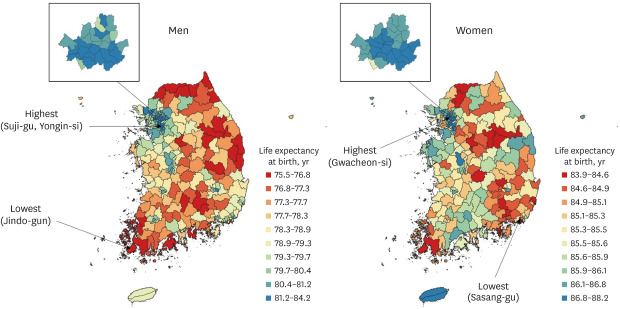
In 2017, the LE at birth was 78.9 years (95% CI, 77.9–80.0 years) for men and 85.6 years (95% CI, 84.8–86.3 years) for women. For men, a high LE at birth was observed in the west (Seoul, Gyeonggi, Sejong, and Daejeon), while a low LE at birth was mainly observed in the northeast (Gangwon and Gyeongbuk) and south (Jeonnam and Gyeongnam). For women, high LE at birth was observed particularly in Sejong, Seoul, and Jeju, while low LE at birth was observed in some regions in Chungbuk, Ulsan, and Gyeongnam. Among 250 districts, LE at birth for men ranged from a minimum of 75.5 years (95% CI, 74.0–77.0 years) in Jindo-gun, Jeonnam to a maximum of 84.2 years (95% CI: 83.4–85.0) in Suji-gu, Yongin-si, Gyeonggi. LE at birth for women ranged from a minimum of 83.9 years (95% CI, 83.2–84.6 years) in Sasang-gu, Busan to a maximum of 88.2 years (95% CI, 87.3 to 89.1 years) in Gwacheon-si, Gyeonggi (Fig. 2). The results of district-level LE at birth from 2004 to 2017 are presented in Table 2. The results for both sexes combined are given in Supplementary Fig. 2 and Supplementary Table 2.
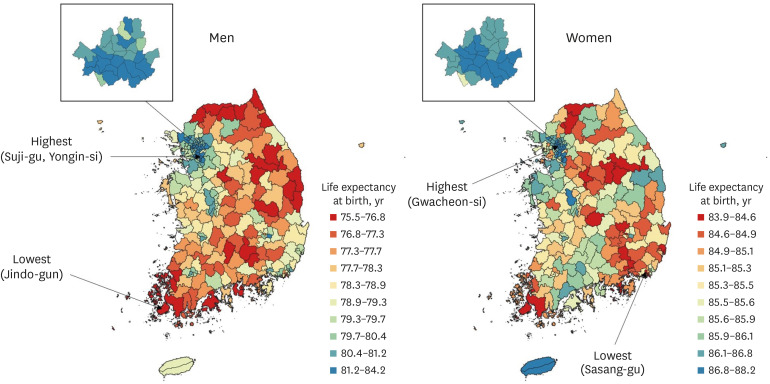
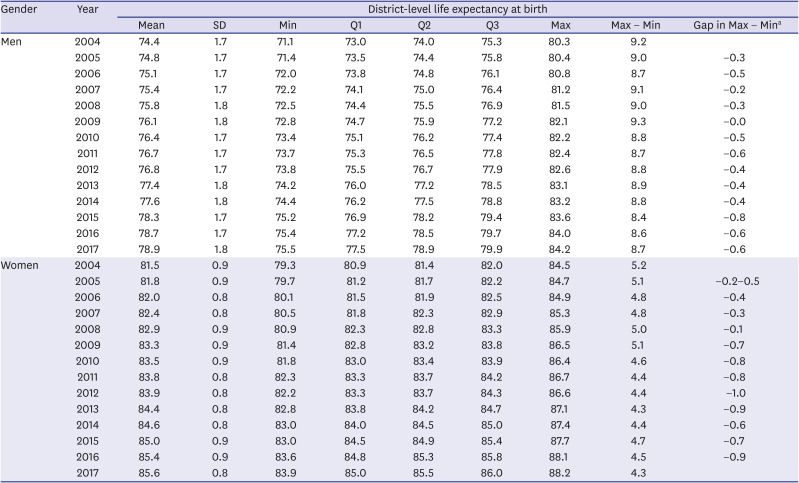
Fig. 2
Life expectancy at birth in 250 districts for men (left) and women (right) in Korea, 2017, shown in 10 color groups with ranges for the categories determined by the deciles of life expectancy at birth.
![]()
Table 2
Distribution of district-level life expectancies at birth based on the spatio-temporal model by gender, 2004–2017
SD = standard deviation, Q1 = 25th percentile, Q2 = 50th percentile, Q3 = 75th percentile.
aGap in Max − Min: the gap in the difference between the maximum and minimum life expectancy at birth between 2004 and each year.
![]()
Between 2004 and 2017, district LE at birth increased by 4.57 years (95% CI, 4.49–4.65 years) for men (from 74.4 years [95% CI, 73.3–75.5 years] to 78.9 years [95% CI, 77.9–80.0 years]) and by 4.06 years (95% CI, 3.99–4.12 years) for women (from 81.5 years [95% CI, 80.7–82.4 years] to 85.6 years [95% CI, 84.8–86.3 years]) on average. LE at birth increased in all districts between 2004 and 2017, but the magnitude of those increases varied widely, from 2.42 years (95% CI, 2.35–2.44 years) in Yanggu-gun, Gangwon to 8.02 years (95% CI, 7.92–8.11 years) in Gangseo-gu, Busan for men, and from 2.87 years (95% CI, 2.81–2.90 years) in Gangjin-gun, Jeonnam to 5.70 years (95% CI, 5.60–5.78 years) in Sejong for women. For men, between 2004 and 2017, high increases in LE at birth were mainly observed in the southeast (Ulsan, Busan, Daegu, and nearby areas) and northwest (some areas of Gyeonggi and Sejong), while low increases in LE at birth were mainly observed in the north (Gangwon), east (Gyeongbuk), and southwest (near the border between Jeonnam and Jeonbuk). For women, high increases in LE at birth were mainly observed in the southeast (Busan, Gyeongnam, and Gyeongbuk) and northwest (Gyeonggi and Sejong), while low increases in LE at birth were mainly observed in band-shaped areas that cross the country from north to south (Fig. 3). The results for both sexes combined are given in Supplementary Fig. 3.
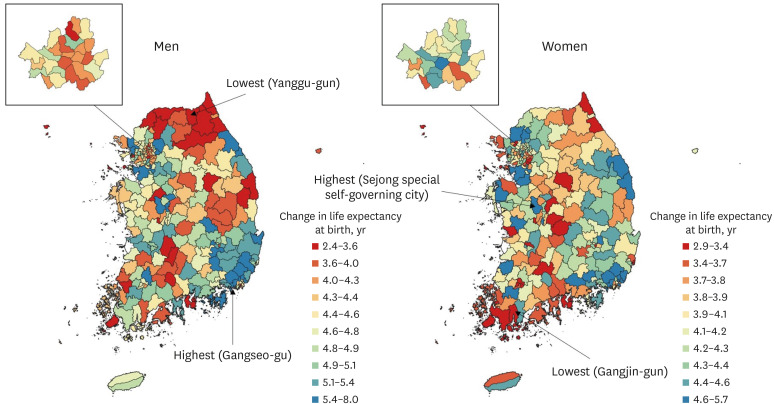
The gap in LE at birth between men and women decreased by 0.51 years (from 7.15 years in 2004 to 6.64 years in 2017). The gap between the lowest and highest LE at birth among districts decreased by 0.55 years (from 9.24 years to 8.69 years) for men and by 0.89 years (from 5.23 years to 4.34 years) for women between 2004 and 2017. The corresponding interquartile ranges increased by 0.12 years (from 2.28 years to 2.40 years) for men, but decreased by 0.09 years (from 1.08 years to 0.98 years) for women between 2004 to 2017. In 2017, very high LEs at birth, denoted by dots as outliers in the box plots, were observed in Suji-gu, Yongin-si, Gyeonggi; Bundang-gu, Seongnam-si, Gyeonggi; Seocho-gu, Seoul; Gangnam-gu, Seoul; Giheung-gu, Yongin-si, Gyeonggi; and Gwacheon-si, Gyeonggi for men, and observed in Gwacheon-si, Gyeonggi; Gangnam-gu, Seoul; Suji-gu, Yongin-si, Gyeonggi; Dongjak-gu, Seoul; Yongsan-gu, Seoul; Bundang-gu, Seongnam-si, Gyeonggi; Seocho-gu, Seoul; and Jung-gu, Seoul for women (Fig. 4). The results for both sexes combined are given in Supplementary Fig. 4.
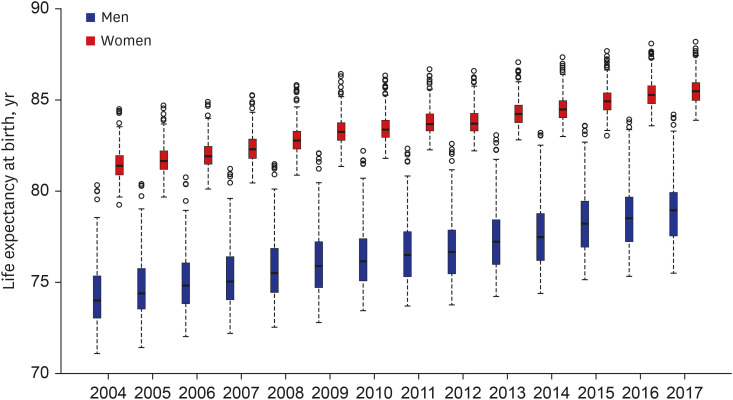
Fig. 4
Distribution of life expectancy at birth in 250 districts from 2004 to 2017 by gender in Korea; the bottom border, middle line, and top border of the boxes indicate the 25th, 50th, and 75th percentiles, respectively, across all districts; the dashed lines (whiskers) represent the full range across districts except outliers; and circles (outliers) represent the observations with the highest or lowest life expectancy at birth.
![]()
Table 3 shows a comparison of LE at birth at the district level, calculated from the observational data of NHID and from the spatio-temporal model. The absolute median differences between the observed and model-based LE at birth at the district level from 2004 to 2017 were less than 0.4 years for men and 0.3 years for women. The correlation coefficients between the observed and model-based LE at birth at the district level from 2004 to 2017 were 0.879 to 0.943 for men and 0.624 to 0.781 for women. The reason for the low correlation coefficients of LE at birth was that in some districts, LE at birth calculated from the observed mortality rates was unstable due to the small population numbers in each age group in the life table. For example, the observed and model-based LEs at birth at the district level in 2017 were quite different in some districts with small populations, such as Ongjin-gun, Imsil-gun, and Yanggu-gun (Fig. 5). To explore this issue, based on the finding of a previous study9 that the minimum population required for a stable LE was 5000, we calculated the LE at birth for 250 districts using 7-year pooled data for population and deaths (2004–2010 and 2011–2017), and the newly obtained correlation coefficients are in the last column in Table 3, showing that the observed and model-based LEs at birth were highly correlated. Thus, using LE obtained from spatio-temporal models, rather than LE calculated from the observed mortality rates, enables stable estimates of annual district-level LE to be obtained. The results for both sexes combined are given in Supplementary Table 3.
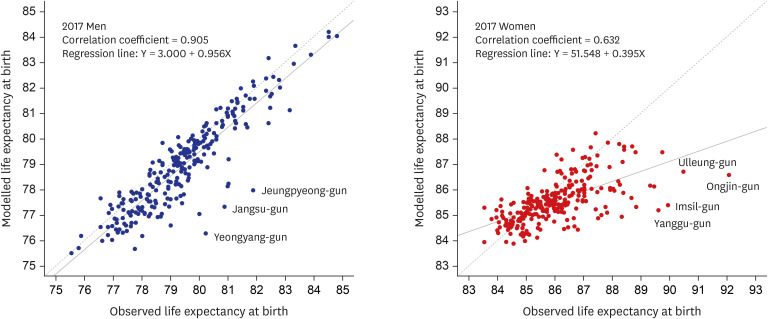
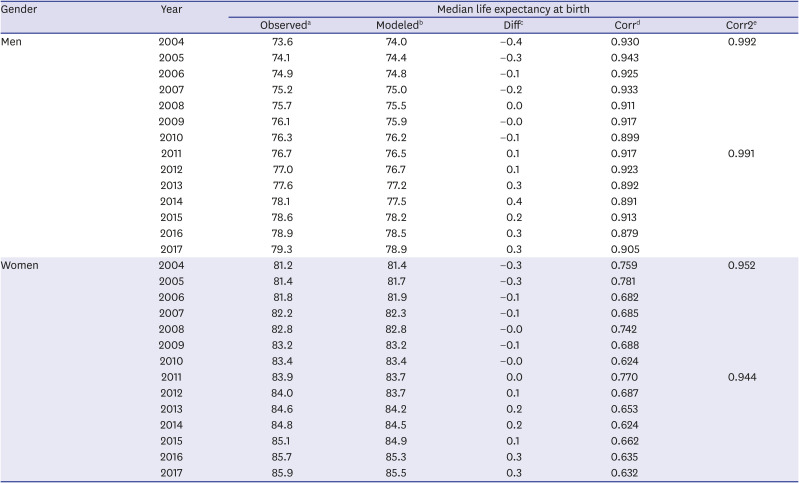
Fig. 5
Comparison of the life expectancy at birth calculated from observed mortality rates (x-axis) and the life expectancy at birth based on the spatio-temporal model (y-axis) in 2017; the solid lines represent the fitted regression lines and the dashed lines represent the straight lines with slope 1.
![]()
Table 3
Annual comparison of median results between the observed and model-based life expectancies at birth at the district level by gender
All correlation coefficients in Corr and Corr2 are statistically significant (P value < 0.001).
aObserved: median life expectancy at birth at the district level calculated from the observational data of the National Health Information Database; bModeled: median life expectancy at birth at the district level from the spatio-temporal model; cDiff: median difference between the observed and model-based life expectancies at birth at the district level; dCorr: correlation between the observed and model-based life expectancies at birth; eCorr2: correlation between the observed and model-based life expectancies at birth based on 7-year pooled data.
![]()
DISCUSSION
In this study, we estimated annual district-level LE using the NHID DB from 2004 to 2017 through spatio-temporal analysis. Compared to purely spatial analysis or time-series analysis, spatio-temporal analysis has the advantage of being able to simultaneously study the effects of space and time. Spatio-temporal models allow for various kinds of interactions and relationships (spatial dependencies, temporal dependencies, and space-time dependencies) that may be present in the data, thus avoiding inappropriate model fitting (e.g., by ignoring dependencies) that may lead to incorrect conclusions.
Estimating LE based on spatio-temporal modeling, as done in this study, is necessary for the following reasons. First, model-based LEs in districts with small populations are more stable than LEs calculated under the assumption of independent observations. Second, annual LEs can be calculated without pooling multi-year data to secure the minimum population number required for a stable LE in each geographic area. Third, since the mortality rates are similar in adjacent regions, it is statistically inappropriate to conduct an analysis assuming that the mortality rates in each area are independent of each other. This study is meaningful in that it is the first study, to the best of our knowledge, to estimate LE at the district level in Korea by addressing the above issues.
Table 2 and Fig. 4 present decreases in the gaps in LE across districts in Korea. These findings are in line with prior Korean studies, which also reported similar temporal decreases in mortality metrics across districts in Korea.1920 In addition, mortality inequalities by geographic deprivation index have decreased in Korea.2122 These temporal patterns in geographic mortality inequalities are in contrast with the increasing inequalities in mortality metrics (LE and age-adjusted mortality rates) by individual socioeconomic position indicators, such as income and education, in Korea.232425
Study results showed that the Moran’s I was greater in men than in women. The gender difference in the Moran's I means that geographical clustering in mortality is more pronounced in men than in women in Korea. In Korea as well as in many other countries, the magnitude of socioeconomic inequalities in mortality and life expectancy is greater in men than in women.57232425 If the geographic areas in Korea reflect socio-economic position and such geographic areas tend to cluster, it is expected that the magnitude of clustering in mortality would be greater in men than in women.
This study has certain limitations that should be acknowledged. First, when constructing the adjacency weight matrix W in the model, it was not considered whether there were obstacles (e.g., rivers, mountains) between regions. However, most of those regions are actually connected by bridges or tunnels. Second, there are many islands in the west and south of Korea, so it was not possible to create adjacency weights based on the Queen criterion (i.e., neighbors if they share a common edge or a common vertex) in those regions. Therefore, if the island regions were nearby on the map, they were considered adjacent regions. In fact, most islands are connected by highway or ship routes, so people can come and go. In the case of Ulleungdo island on the east coast, neighboring regions were defined based on four ship routes.
Based on the results of this study, the annual district-level LE could be used as a performance indicator of the local government's health policies to improve the health of local residents, and information on the LE gap between districts will ultimately contribute to stimulating health-equity policies and projects at the district level. It is also expected that annually monitoring and evaluating LE gaps across regions at the district level will help achieve a long-term health equity policy.
The approach to district-level analysis with a spatio-temporal modeling employed in this study could be used in future analyses to produce district-level health-related indicators (e.g., healthy LE) in Korea, such as forecasts of future mortality and LE, or cause-specific mortality rates.
 XML Download