Abstract
Background
Obesity has become one of the most serious issues threatening the health of humankind, and we conducted this study to examine whether and how celastrol protects against obesity.
Methods
We fed male Sprague-Dawley rats a high-fat diet and administered celastrol to obese rats for 3 weeks. By recording body weight (BW) and other measures, we identified the effective dose of celastrol for obesity treatment. Feces were collected to perform 16S rRNA sequencing, and hypothalami were extracted for transcriptome sequencing. We then treated leptin knockout rats with celastrol and explored the changes in energy metabolism. Male Institute of Cancer Research (ICR) mice were used to test the acute toxicity of celastrol.
Results
We observed that celastrol reduced BW and promoted energy expenditure at a dose of 500 µg/kg BW but that food intake was not changed after administration. The diversity of the gut microbiota was improved, with an increased ratio of Bacteroidetes to Firmicutes, and the gut microbiota played an important role in the anti-obesity effects of celastrol. Hypothalamic transcriptome analysis showed a significant enrichment of the leptin signaling pathway, and we found that celastrol significantly enhanced energy expenditure, which was mediated by the leptin signaling pathway. Acute lethal toxicity of celastrol was not observed at doses ranging from 0 to 62.5 mg/kg BW.
Obesity is defined as excessive fat accumulation resulting from a positive energy balance, meaning that the energy ingested exceeds the energy that is consumed. According to the World Health Organization, there are approximately 1.9 billion people suffering from overweight and obesity around the world, and this number has nearly tripled over the past 4 decades. Obesity and its numerous related complications, such as type 2 diabetes mellitus and cardiovascular diseases, are becoming great risks to global health [1]. Due to the socioeconomic burden of these diseases, effective prevention and treatment strategies are crucial for halting the obesity epidemic.
Based on the laws of thermodynamics, treatments for obesity have to reduce energy intake and/or increase energy expenditure (EE) [2]. Bariatric surgery, which includes gastric bypass, sleeve gastrectomy, and gastric banding, affects digestion and stimulates the vagus nerve reflex, leading to reduced food intake as well as improvements in metabolic pathways [3]. In addition to such direct interventions, the hypothalamic system is a potential clinical target that plays essential roles in regulating energy homeostasis [4]. Pro-opiomelanocortin (POMC)-expressing neurons give rise to multiple peptides, such as α-melanocyte stimulating hormone (α-MSH), and suppress appetite via the activation of MC receptors 3 and 4 (MC3r/MC4r) [5], while neuropeptide Y and agouti-related peptide (NPY/AgRP) act as antagonists in coexpressing neurons to promote hyperphagia [6]. Mounting evidence has established that leptin, an important adipocyte-secreted hormone, plays fundamental roles in regulating the hypothalamic nervous system and maintaining energy balance. Leptin is known to cross the blood-brain barrier, inhibit NPY/AgRP and stimulate POMC neurons, which in turn inhibits food intake [7]. Additionally, few potent therapeutics that target this network in the central nervous system and promote weight loss are currently available. The application of the several drugs currently approved by the U.S. Food and Drug Administration, e.g., lorcaserin and naltrexone+bupropion, are limited because of their potential cardiovascular and gastrointestinal side effects [8].
Natural plant-derived biomolecules are a great source of potential therapeutic candidates, and a number of traditional Chinese remedies, i.e., Ophiocordyceps sinensis, Antrodia cinnamomea, and Coptis chinensis, have been reported to exert anti-obesity effects [91011]. Celastrol, a triterpenoid quinine methide isolated from the root of Tripterygium wilfordii (also known as thunder god vine), is a potent immunosuppressive, anti-inflammatory, and anticancer agent used in the treatment of autoimmune and neurodegenerative diseases [1213]. Recently, celastrol has attracted great attention for its potential novel ability to treat obesity [1415]. It is well established that celastrol regulates EE through the activation of mammalian heat shock transcription factor (HSF1) to protect against high-fat diet (HFD)-induced energy excess [16]. However, the dose, type of administration, and detailed mechanisms of celastrol remain to be further studied.
The gastrointestinal tract, where the microbiota promotes carbohydrate and lipid metabolism and maintain energy balance, plays an important role in exchanging substances inside and outside the body [17]. Mounting evidence has shown that a disturbance of the two predominant phyla, Firmicutes and Bacteroidetes, is associated with the occurrence of obesity and other metabolic diseases [18]. On the other hand, the beneficial effects of fecal microbiota transplantation and nutritional intervention have been reported to maintain a stable metabolic homeostasis [19] which makes obesity treatment by reversing and improving the gastrointestinal environment through diet or drugs become true.
In the present study, we used HFD-induced obese rats to examine whether the gut microbiota mediated the anti-obesity effect of celastrol. Our results revealed that celastrol decreased body weight (BW), improved insulin sensitivity and enhanced EE at a dose of 500 µg/kg BW. In addition, the amelioration of the gut microbiota and the promotion of the leptin signaling pathway were involved in the enhancement of EE by celastrol. Thus, our data demonstrated that celastrol represents a potential therapeutic agent for treating obesity and its related complications.
All animal experiments were performed after approval by the Institutional Animal Care and Use Committee (IACUC-14030182) of Nanjing Medical University. Institute of Cancer Research (ICR) mice and Sprague-Dawley rats were purchased from Shanghai SLAC Laboratory Animal Co. Ltd. (Shanghai, China), while Lep−/+ rats were a kind gift from Dr. Guoping Fan's lab [20]. The animals were acclimated for 1 week before the study began. The Lep−/+ rats were crossed to obtain wild-type (WT) and Lep−/− rats. The animals were housed in a temperature- and humidity-controlled (23℃±1℃, 53%±2%) room and maintained on a 12-hour/12-hour light/dark cycle with food and water available ad libitum. For generation of diet-induced obese (DIO) rats, 9-week-old rats were fed a 60% kcal HFD (Cooperative Medical Biological Engineering Co. Ltd., Nanjing, China) until the age of 20 weeks.
For treatment, celastrol (Selleck.cn, Shanghai, China) was suspended in a 5% dimethyl sulfoxide (DMSO)/45% ethanol/50% saline solution, which was used as the vehicle. We generated vehicle-treated (n=8) and 500 µg/kg celastrol-treated (n=7) groups for initial examination. For oral administration, the rats were orally administered vehicle for 3 days before the experiments for acclimation, and then different doses of celastrol or vehicle were administered to the rats by gavage. For intraperitoneal injection, the rats received vehicle for 3 days before celastrol or vehicle treatment. Celastrol and vehicle were then injected into the rats. All treatments were performed within 2 hours before the dark cycle, and the rats received treatment every day until the end of the experiments.
For antibiotic interference, we generated vehicle+antibiotic-treated (n=6) and celastrol+antibiotic-treated (n=8) groups. An antibiotic cocktail including 10 µg/mL neomycin, 100 IU/mL pen/strep, 5 µg/mL vancomycin, and 10 µg/mL metronidazole was mixed in the drinking water and provided ad libitum according to the volume drank by the rats daily [21]. Water was replaced with freshly prepared cocktail every other day. Antibiotic interference was started since the second week of treatment until the end of the experiments.
Lep−/+ and Lep−/− rats were given vehicle, 500 µg/kg BW celastrol or 1,000 µg/kg BW celastrol in each experiment (n=9:7:8 for Lep−/+ rats and n=4:5 for Lep−/− rats) according to the abovementioned protocols.
To measure the metabolic effects of celastrol on WT and Lep knockout mice, Lep−/− rats were fed a controlled HFD to maintain a similar growth of BW as that of WT rats until the age of 20 weeks (n=5 for each group). We then fed the WT and Lep−/− rats the same volume of HFD to test metabolism based on an equivalent caloric intake.
For the acute toxicity test, we orally administered celastrol at doses of 0, 0.1, 0.5, 2.5, 12.5, and 62.5 mg/kg to 8-week-old male ICR mice (n=10 for each group). After administration, the mice in each group were fed normally, and reactions were monitored (continuous observation for 2 hours after administration; observation once every 30 minutes for 2 to 4 hours after administration; and observation once every 4 to 8 hours after administration). Then, the mice were observed once a day for 5 days. The mice were weighed at each observation, and general condition, poisoning symptoms and death were recorded. After 5 days of observation, all mice were killed, the organ coefficients of the main organs were recorded, and the serum was isolated for biochemical tests.
For the oral glucose tolerance test, animals were fasted from the beginning of the dark cycle. After 15 hours of fasting, blood glucose levels were measured from the tail vein. Subsequently, dextrose solution (2 g/kg BW) was administered by gavage. Blood glucose levels were measured from the tail vein 15, 30, 60, 90, and 120 minutes following glucose treatment with an automated reader (Roche Ltd., Welwyn Garden City, UK).
For the insulin tolerance test, the mice were fasted as mentioned above. Insulin (1 IU/kg BW) was intraperitoneally injected. Blood glucose levels were measured 15, 30, 60, 90, and 120 minutes following insulin injection from the tail vein with an automated reader.
To monitor the effects of celastrol treatment on metabolic parameters, 20-week-old DIO rats were housed individually and given free access to food and water (n=3 for each group). They were orally administered celastrol for 1 week for adaptation, and BW, oxygen consumption, food intake, the level of physical activity, etc., were measured for the next 3 days with a TSE Labmaster Caging System (TSE Systems, Bad Homburg, Germany). The first recorded cycle following the first day of measurement in the metabolic chambers was named the dark 1 cycle, which was followed by the light 1, dark 2, light 2, dark 3, and light 3 cycles.
Blood from the tail was collected in nonheparinized tubes once a week and transferred to ice-cold Eppendorf tubes. The tubes were centrifuged at 2,000 ×g for 30 minutes at 4℃. We collected the serum layer and stored it at −80℃ for long-term storage. Serum leptin levels were measured with enzyme-linked immunosorbent assay (ELISA) kits (Merck-Millipore, Darmstadt, Germany). Triglyceride and cholesterol levels were assayed by the Department of Animal Core Facility of Nanjing Medical University.
Dissected livers and abdominal white adipose tissue (WAT) from DIO rats that were treated with vehicle or celastrol for 3 weeks were fixed in 10% neutral buffered formalin and embedded in paraffin according to standard procedures. Tissue sections (5-mm thick) were stained with hematoxylin and eosin (H&E) kits following the manufacturer's instructions (Beyotime, Shanghai, China). Histopathological slides were scanned using Pannoramic Scan (3DHISTECH Ltd., Budapest, Hungary), which were taken at 40× magnification. Three photomicrographs per rat were compiled and analyzed using Adobe Photoshop version CS6 (Adobe, San Jose, CA, USA); ImageJ, version 2 (National Institutes of Health, Bethesda, MD, USA).
To prepare total lysates from the hypothalamus, samples were lysed in ice-cold tissue lysis buffer (25 mM Tris-HCl, pH 7.4; 100 mM NaF; 50 mM Na4P2O7; 10 mM Na3VO4; 10 mM EGTA; 10 mM EDTA; and 1% NP-40; supplemented with phosphatase and protease inhibitors) using Misonix Sonicator 3000 (Misonix, Nassau County, NY, USA). Following 2 minutes of homogenization, we centrifuged the samples at 13,400 ×g for 20 minutes at 4℃. Supernatants from the hypothalamus were used as protein extracts. We measured the protein concentration of each sample using a BCA protein assay kit (Beyotime), and an equal amount of protein from each sample was denatured in sample loading buffer by boiling at 95℃ for 5 minutes. The proteins were separated on sodium dodecyl sulfate polyacrylamide (SDS-PAGE) gels and transferred onto polyvinylidene fluoride membranes at 4℃ at 100 V for 2 hours. The membranes were blocked for 1 hour in tris-buffered saline (TBS) with 5% bovine serum albumin. The membranes were then incubated with primary antibody in TBS with 0.1% Tween-20 (TBST) at 4℃. After overnight incubation, the membranes were washed three times in TBST for 10 minutes and then incubated with secondary antibody in TBST for 1 hour at room temperature. Following three cycles of 15-minute washes with TBST, the membranes were developed using a chemiluminescence assay. Intensity analysis was performed on scanned Western blot images using ImageJ software. The primary antibodies used in this study included phospho-protein kinase-like endoplasmic reticulum kinase (PERK) (Thr980; Cell Signaling Technologies, Beverly, CA, USA), phosphorylated-signal transducer and activator of transcription 3 (p-STAT3, Tyr705; Cell Signaling Technologies), β-actin (Cell Signaling Technologies), PERK (T-19; Santa Cruz Biotechnology Inc., Santa Cruz, CA, USA) and STAT3 (F-2; Santa Cruz Biotechnology Inc.).
Total RNA was extracted from the hypothalamus and WAT and brown adipose tissue (BAT) tissues with TRIzol (Invitrogen, Carlsbad, CA, USA), and 1 µg of total RNA was reverse transcribed into cDNA with a PrimeScript Kit (Takara Bio Inc., Kusatsu, Japan) according to the manufacturer's instructions. Quantitative real-time polymerase chain reaction was performed in triplicate for each sample and analyzed with the ABI 7900 system (Applied Biosystems, Waltham, MA, USA). The data were expressed as arbitrary units after normalization to the levels of expression of the internal control glyceraldehyde 3-phosphate dehydrogenase (Gapdh) for each sample. The sequences of the primers used in this study are listed in Supplementary Table 1.
Stool samples from random rats from the vehicle-, celastrol-, and celastrol+antibiotics-treated groups (n=6 for each group) were freshly collected and stored at −80℃ until DNA isolation. The bacteria in the feces were extracted using a QIAamp DNA Stool Mini Kit (Qiagen, Hilden, Germany) according to the manufacturer's instructions. Then, the DNA was sent to Majorbio Bio-Pharm Technology Co. Ltd. (Shang, China) for 16S rRNA gene sequencing using primers for the V3 region (forward primer: CCAGACTCCTACGGGAGGCAG; reverse primer: CGTATTACCGCGGCTGCTG). After quality control and trimming of the adaptors, paired-end reads were joined and mapped to the Greengenes 13_8 release database using Qiime software version 1.8 (http://qiime.org/). Operational taxonomic units were picked against the Greengenes database using a 97% similarity threshold. To adjust for differences in sequencing depth, all samples were subsampled to the same number in the subsequent analysis. The workflow for microbiome data analysis [22] was used to filter unidentified and rarely prevalent phyla and compare the differential bacterial abundance among the groups with default settings. Plots were made by the Phyloseq package using R version 3.5.1 (R Foundation for Statistical Computing, Vienna, Austria).
For transcriptome profiling, three hypothalamic tissues from vehicle- and celastrol-treated rats were randomly collected and sent to Novogene Co. Ltd. (Beijing, China) for RNA extraction, library preparation and mRNA sequencing on an Illumina Hiseq 4000 platform (Illumina Inc., San Diego, CA, USA). The RNA-seq data were filtered and processed with STAR to generate read alignments with rn6. Raw read counts for annotated genes were obtained with HTSeq, normalized and analyzed using DEseq2 in accordance with the workflow for gene-level exploratory analysis [23]. A false discovery rate-adjusted P value <0.05 was used to identify the differentially expressed genes. We performed pathway enrichment analysis using Ingenuity Pathway Analysis (IPA; Qiagen).
For statistical analyses, Student's t-test or the rank sum test were used for comparisons between two groups. One-way analysis of variance (ANOVA) followed by Dunnett's post hoc test was used for multiple comparisons versus the vehicle-treated group. The results are shown as the mean±standard error using GraphPad Prism version 7.03 software (GraphPad, San Diego, CA, USA). P<0.05, P<0.01, and P<0.001 were considered as the threshold of statistical significance for all analyses.
According to the effective dose identified in a previous study [1416], we first treated DIO rats with celastrol at doses ranging from 15 to 250 µg/kg BW by oral gavage in the pilot test. As shown in Supplementary Fig. 1, the BW of the DIO rats did not decrease until the dose increased to 250 µg/kg BW To ensure the anti-obesity effect of celastrol, a dose of 500 µg/kg BW, which equals approximately 1,000 µg/kg BW in mice, was chosen for subsequent experiments.
The administration of celastrol significantly reduced the BW of the DIO rats from 813.28±12.20 g on day 0 to 787.69±12.13 g over the 3-week period, representing 3.11%±1.02% weight loss compared to the initial weights (Fig. 1A and B); however, the BW of the vehicle-treated rats showed a slight increase of 0.48%±0.50%. Consistent with this reduction, we observed that the livers of the vehicle-treated rats were filled with large lipid droplets and that lipid accumulation in the celastrol-treated rats decreased. The size and number of adipocytes in abdominal WAT and triglyceride and cholesterol levels, however, were not altered (Fig. 1C, F, and I). These results indicated improved lipid metabolism in the liver, but not in white fat, after treatment with celastrol.
Before treatment with celastrol, the fasting blood glucose levels of the rats from the vehicle- and celastrol-treated groups were 7.28±0.46 and 7.03±0.12 mmol/L, respectively, representing a phenotype of prediabetes. After 3 weeks of treatment, the impaired fasting glycemia was slightly improved (6.29± 0.16 and 6.23±0.26 mmol/L, respectively), but the rats still showed impaired tolerance to a glucose load (Fig. 1D and E, Supplementary Fig. 2A and B). Regarding response to insulin, the glucose levels of the celastrol-treated rats were slightly diminished and restored to the level of the vehicle-treated group after intraperitoneal insulin injection (Fig. 1G and H), although no significant difference in the area under curve (AUC) was observed (Supplementary Fig. 2C and D). Collectively, these results demonstrated that 3 weeks of treatment with celastrol ameliorated obesity in DIO rats.
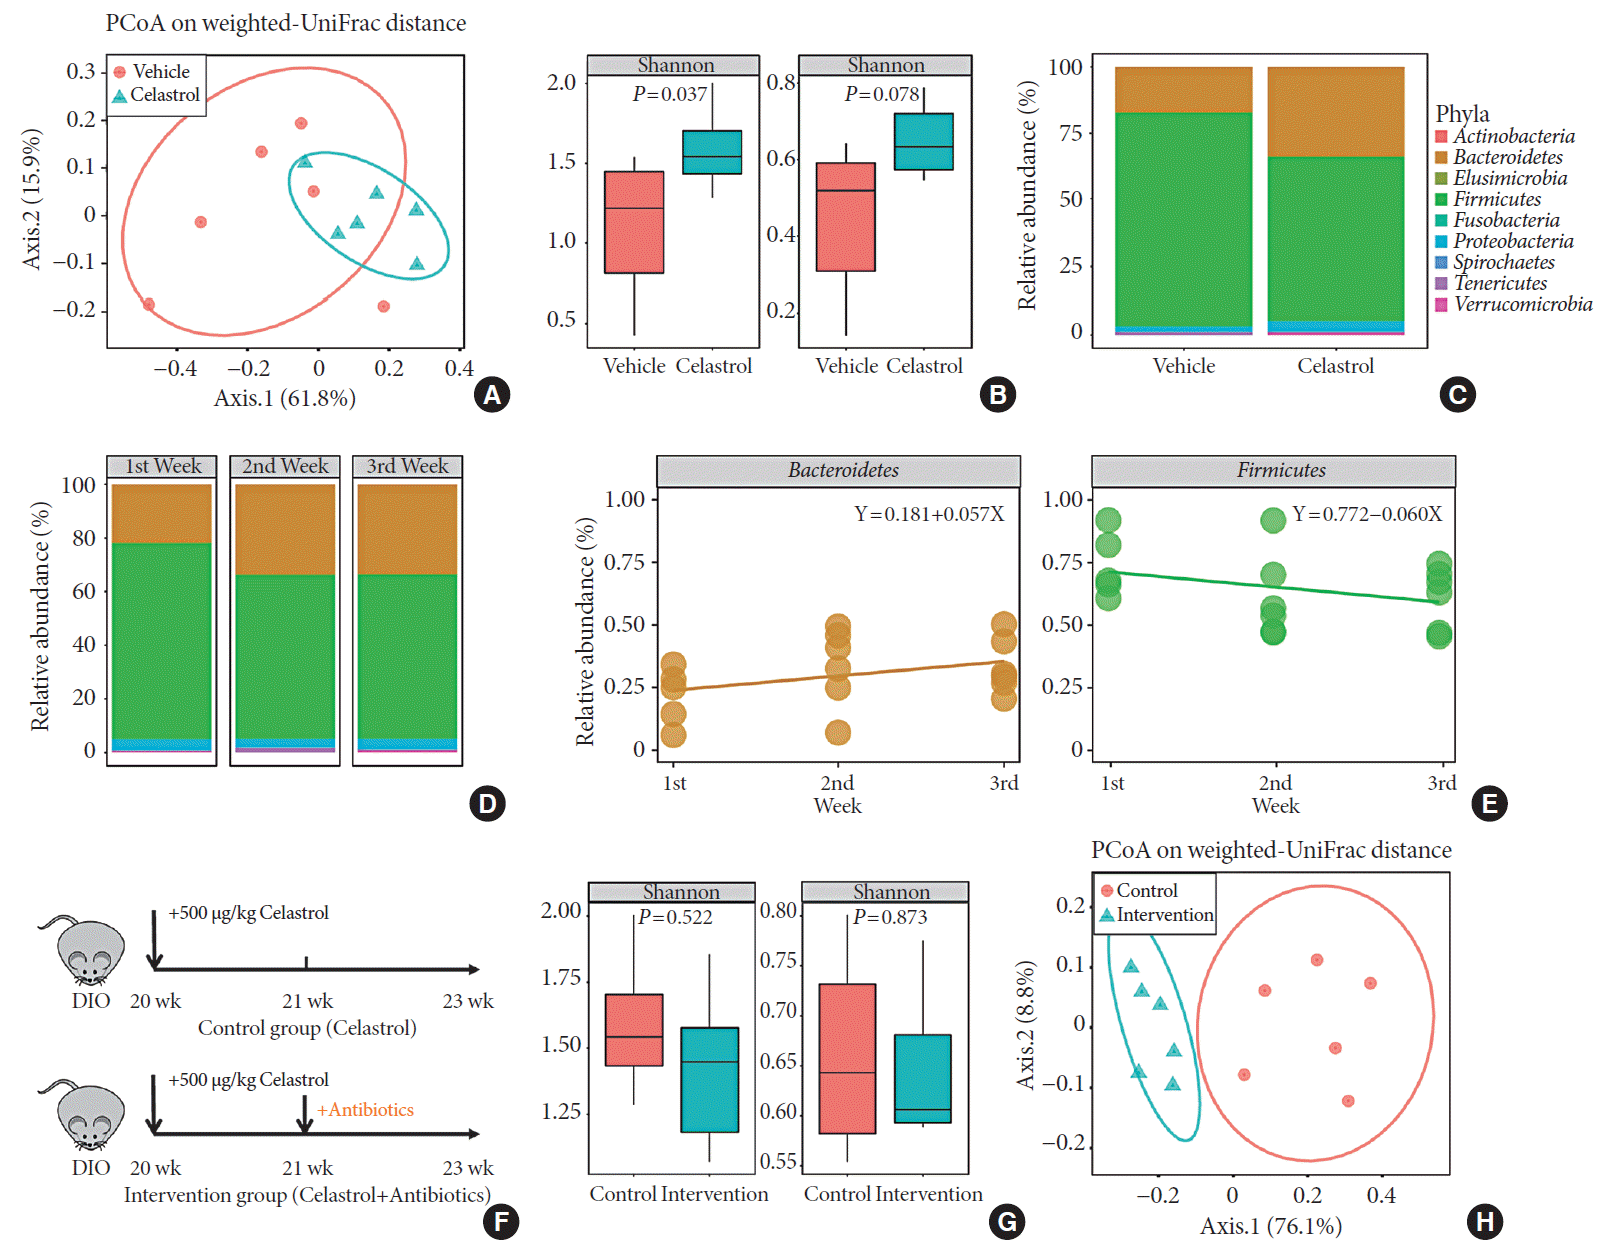
The gut microbiota, an intermediate between the host and the environment, comprises trillions of bacteria and contributes to energy harvesting and metabolism regulation [24]. Considering celastrol was orally administered, an interaction between celastrol and the gut microbiota may have occurred, but there was no evidence of this association. To assess this association, we collected the feces of the rats from the two groups after the 3 weeks of treatment on the second morning after cage change, and the microbiota composition in the feces was analyzed using 16S rRNA sequencing. Weighted UniFrac-based principal coordinate analysis (PCoA) revealed a scattered distribution of microbiota in the vehicle-treated group, reflecting a state of HFD feeding, while the microbiota of the celastrol-treated rats was concentrated (Fig. 2A). Within-habitat diversity, i.e., α-diversity, showed that the microbiota composition of the celastrol-treated rats was more abundant than that of the vehicle-treated group (Fig. 2B). Based on the negative correlation between α-diversity and the onset of obesity, the promotion of the gut microbiota accompanied by weight loss in the celastrol-treated rats was consistent with previous findings in humans [25]. As shown in Fig. 2C, there was an obvious difference in the relative abundance between the two groups at the phylum level, with Bacteroidetes, Firmicutes, and Proteobacteria as the major constituent phyla. After 3 weeks of treatment with celastrol, the relative abundance of Bacteroidetes in the feces was significantly increased by approximately 85% compared to that in the vehicle-treated group, while the relative abundance of Firmicutes was diminished by approximately 26%; this result is compatible with the aforementioned studies in murine models of obesity [24]. This finding indicated that celastrol improved the homeostasis of the microbiota composition in DIO rats, but there was still a lack of understanding of the dynamic changes.
To determine whether there was an association between the duration of treatment and the microbiota composition, we collected the feces of the celastrol-treated rats after 1, 2, and 3 weeks of treatment. After treatment with celastrol, the relative abundance of the microbiota in the DIO rats gradually changed and stabilized after 2 weeks (Fig. 2D). Linearized regression revealed a weekly 5.7% elevation in Bacteroidetes and a 6.0% reduction in Firmicutes, suggesting a synchronous change of the two phyla (Fig. 2E). Taken together, our data provided evidence that there was a close relationship between celastrol and the gut microbiota.
Although we demonstrated the association between celastrol and the gut microbiota, it was still unclear whether the microbiota mediated the anti-obesity effect of celastrol. Therefore, we added a mixture of antibiotics, including neomycin, penicillin, streptomycin, vancomycin and metronidazole [21], to the drinking water beginning the second week of treatment with celastrol (Fig. 2F) so that we could disturb the composition of the microbiota, observe its influence on the BW of the DIO rats and confirm the weight loss that was observed during the first week of treatment with celastrol. A separation between celastrol alone and the combination of celastrol and antibiotics is shown in the PCoA plot, and there was a weakened α-diversity in the rats after the addition of antibiotics, which suggested that 2 weeks of antibiotics administration disrupted the microbiota homeostasis promoted by celastrol (Fig. 2G and H). Consistent with the previous results, the BW of the rats in the celastrol+antibiotic-treated group decreased at a rate equivalent as that of the rats in the celastrol only-treated group during the first week (from day 1 to day 7) before the addition of antibiotics, which validated the anti-obesity effect of celastrol (Fig. 1B). Nevertheless, the rate slowed after the addition of antibiotics, and the slope of the broken line graphs indicates two totally different statuses of weight loss. By generating another group of rats that received only antibiotics, we aimed to control for the effects of the antibiotics themselves. As shown in Fig. 1B, the BW of the rats in this group diminished immediately after drinking water with antibiotics, and this was supposed to be induced by the disturbance of the gut microbiota [26]. Weight gain was observed in these rats 5 days later. These results implied that the gut microbiota but not antibiotics mediated the anti-obesity effect of celastrol.
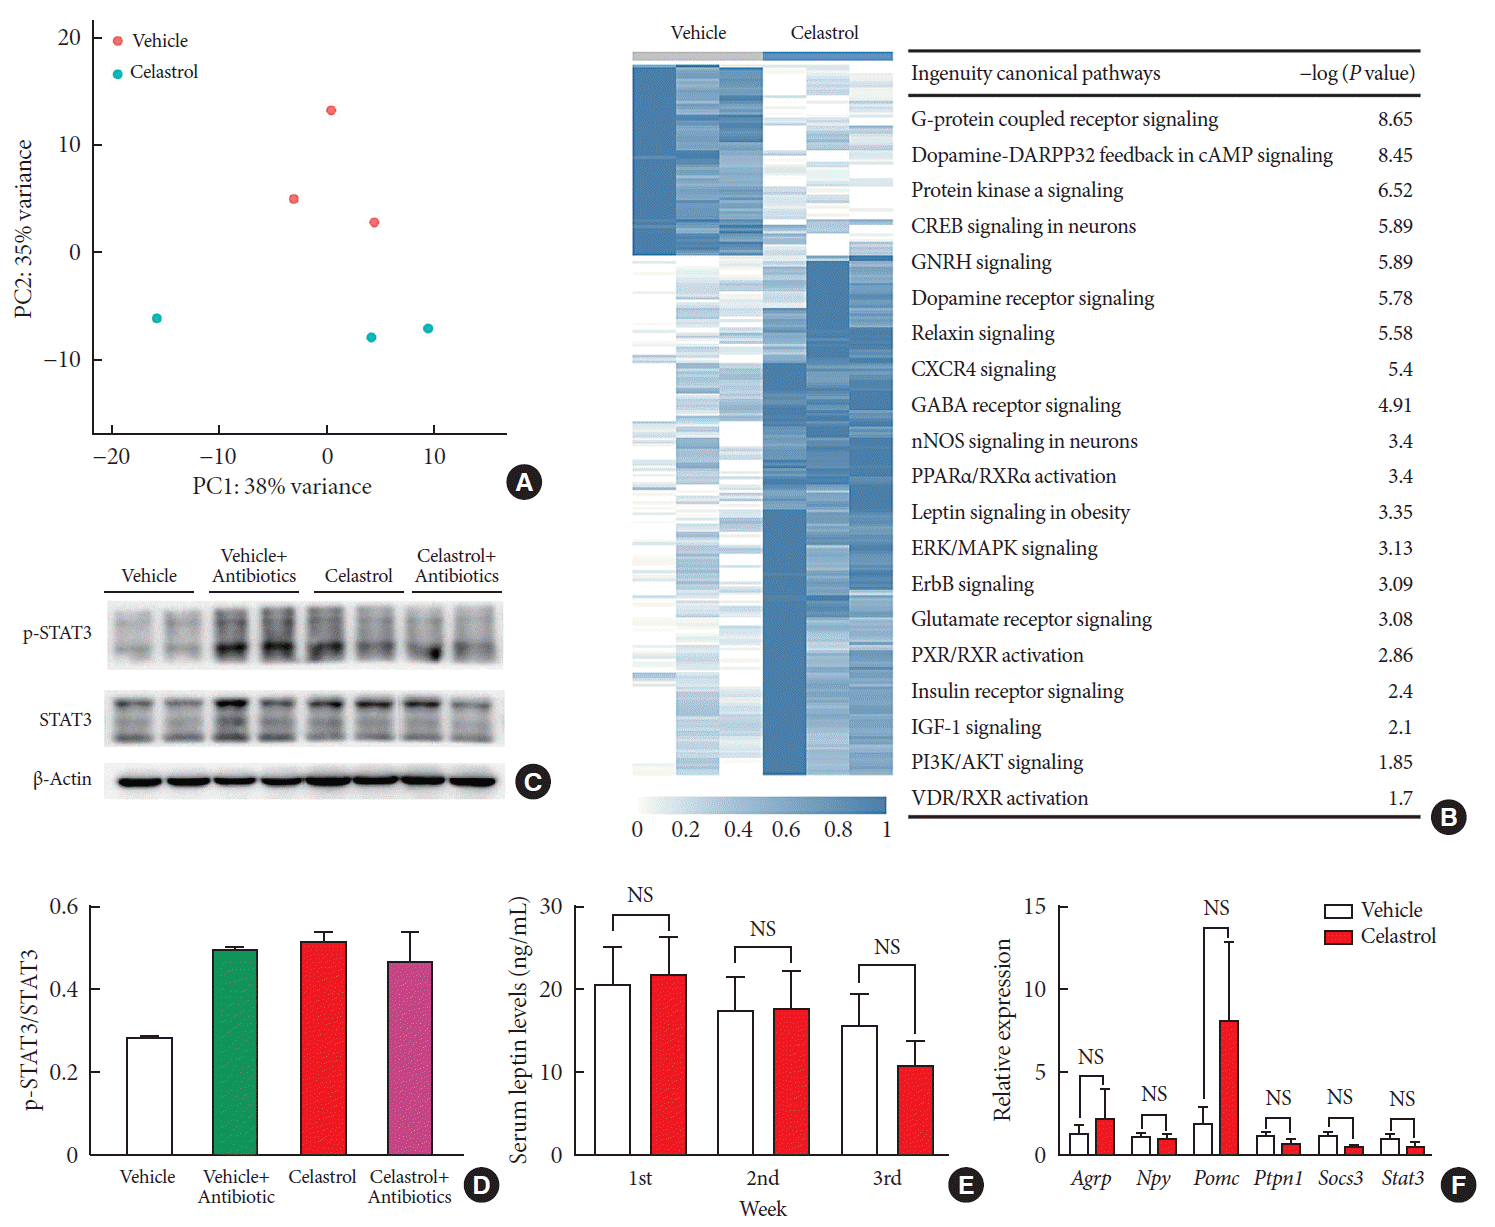
There is growing evidence that the bidirectional communication system between the gut and the brain, in other words, the gut-brain axis, is associated with metabolic diseases [27]. This is also a route through which the gut microbiota may impact neurodevelopmental processes and brain functions. To profile the changes in the hypothalamus after 3 weeks of treatment, we extracted RNA and performed transcriptome sequencing. The vehicle- and celastrol-treated rats were clustered separately (Fig. 3A and Supplementary Fig. 3A) in the principal component analysis plot, and there were 13 downregulated genes and 153 strongly upregulated genes in the celastrol-treated group. We analyzed enriched pathways with IPA, and it was revealed that G-protein coupled receptor signaling, dopamine-DARPP32 feedback in cyclic adenosine monophosphate (cAMP) signaling, protein kinase A signaling, etc., were enriched (Fig. 3B). Notably, we found that genes that participate in leptin signaling, including protein kinase cAMP-activated catalytic subunit beta (Prkacb), forkhead box Ow 1 (Foxo1), and adenylate cyclase 5 (Adcy5), were differentially expressed, indicating the potential involvement of leptin signaling in the anti-obesity effect of celastrol. However, the mRNA expression levels of Pomc, Agrp, Npy, etc., were expressed at comparable levels in the two groups (Fig. 3F and Supplementary Fig. 3B).
To determine the connection between leptin and celastrol-induced weight loss, we tested successive serum leptin levels, but there was no significant difference between the vehicle- and celastrol-treated rats after 1, 2, or 3 weeks of treatment (Fig. 3E). Nevertheless, the level of leptin in the celastrol-treated group showed a tendency to decrease, reflecting the association of a negative feedback loop of leptin with a reduction in body fat, which has been reported by others [28]. For leptin signaling in the hypothalamus, we found that the phosphorylation of STAT3, a downstream effector of leptin, at Tyr705 was significantly increased in the celastrol-treated group, which implied the activation of leptin signaling (Fig. 3C and D). In contrast to that in the celastrol-treated group, the ratio of p-STAT3 to total STAT3 protein in the celastrol+antibiotic-treated group was slightly reduced, which was in accordance with the slowing of weight loss (Fig. 1B). Together, our data demonstrated that the hypothalamic leptin signaling pathway was activated after treatment with celastrol even though the serum leptin level did not change; this may have been due to the improved leptin sensitivity in the hypothalamic center for energy homeostasis.
It is well established that leptin and insulin resistance in obesity results from endoplasmic reticulum (ER) stress and that improvements in ER homeostasis induced by chaperones such as 4-phenylbutyric acid (4-PBA) contributes to the improved sensitivity to leptin [29]. We thus analyzed the level of PERK protein as well as its phosphorylation at Thr980, but the reduction in PERK was not obvious (Supplementary Fig. 3C–F), implying that the involvement of ER homeostasis still needs to be validated by further studies.
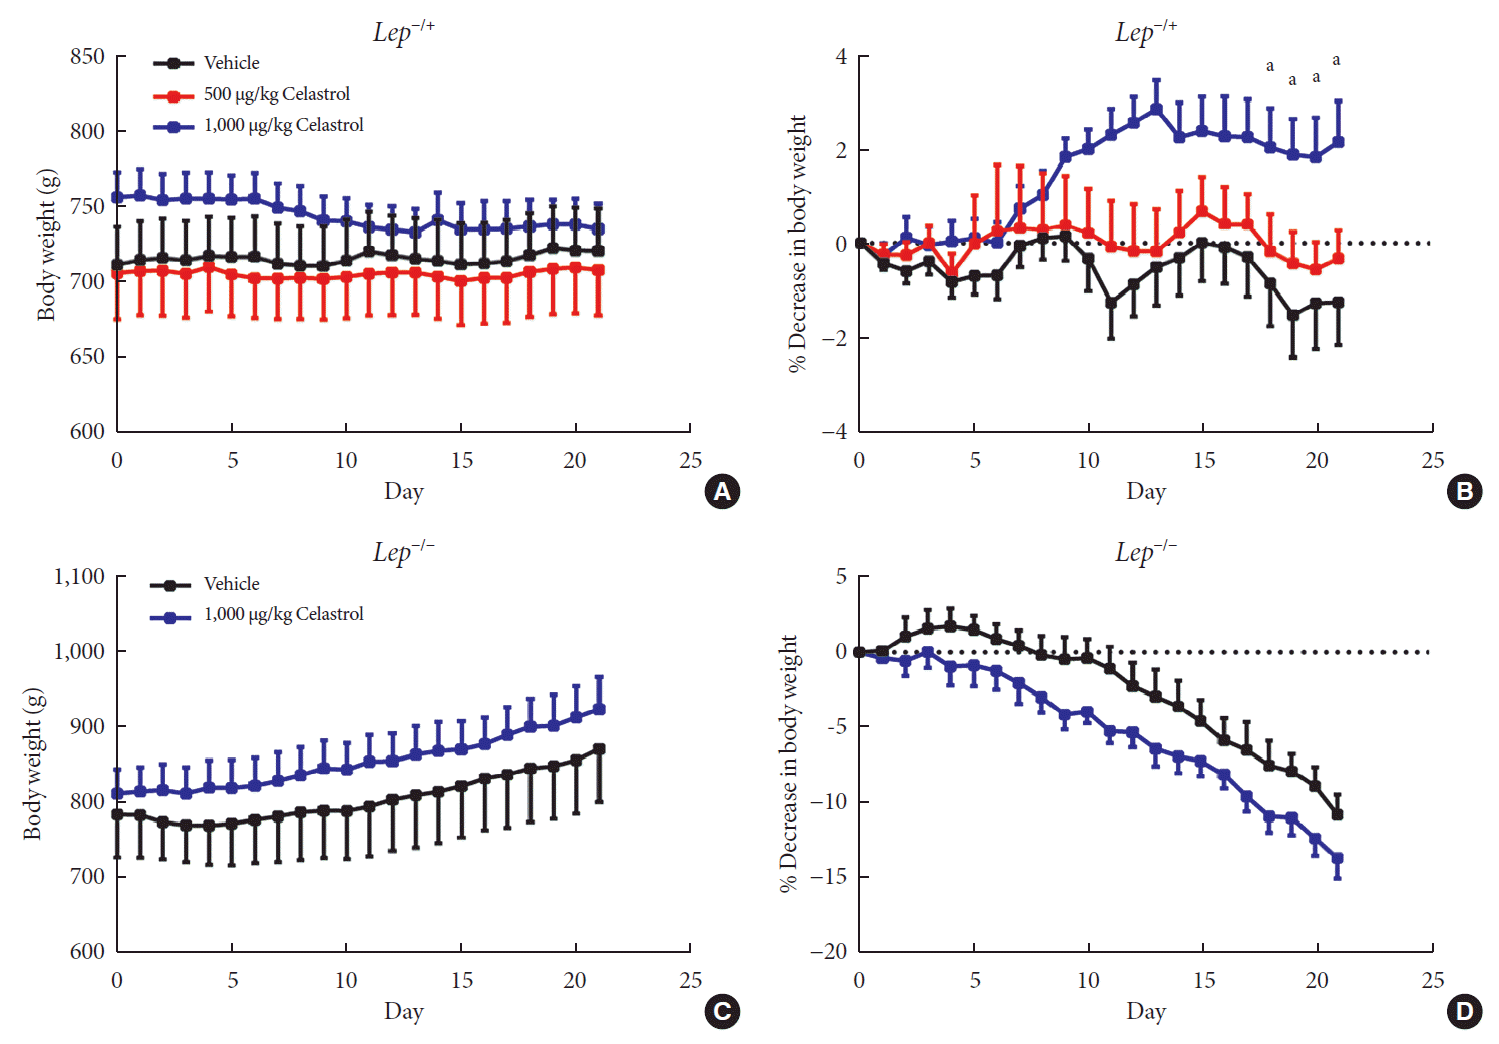
Given the activation of leptin signaling in celastrol-treated rats, heterozygous (Lep−/+) and homozygous leptin knockout (Lep−/−) rats were used to verify the role of leptin in celastrol-induced weight loss. We orally administered different doses of celastrol to the Lep−/+ rats. As shown in Fig. 4A and B, the rats administered 500 µg/kg BW celastrol maintained a stable BW, and the difference between the BWs of the 500 µg/kg BW celastrol- and vehicle-treated groups was not statistically significant. When the dosage increased to 1,000 µg/kg BW, the percent decrease in BW was markedly altered beginning the 18th day of treatment. As the number of genomic copies of leptin was decreased in the Lep−/+ rats compared to that in the WT rats, the elevation of the celastrol dose helped to restore its function and decrease BW. For Lep−/− rats, however, even 1,000 µg/kg BW celastrol did not decrease the BW (Fig. 4C and D), suggesting that the effectiveness of celastrol is partially dependent on leptin.
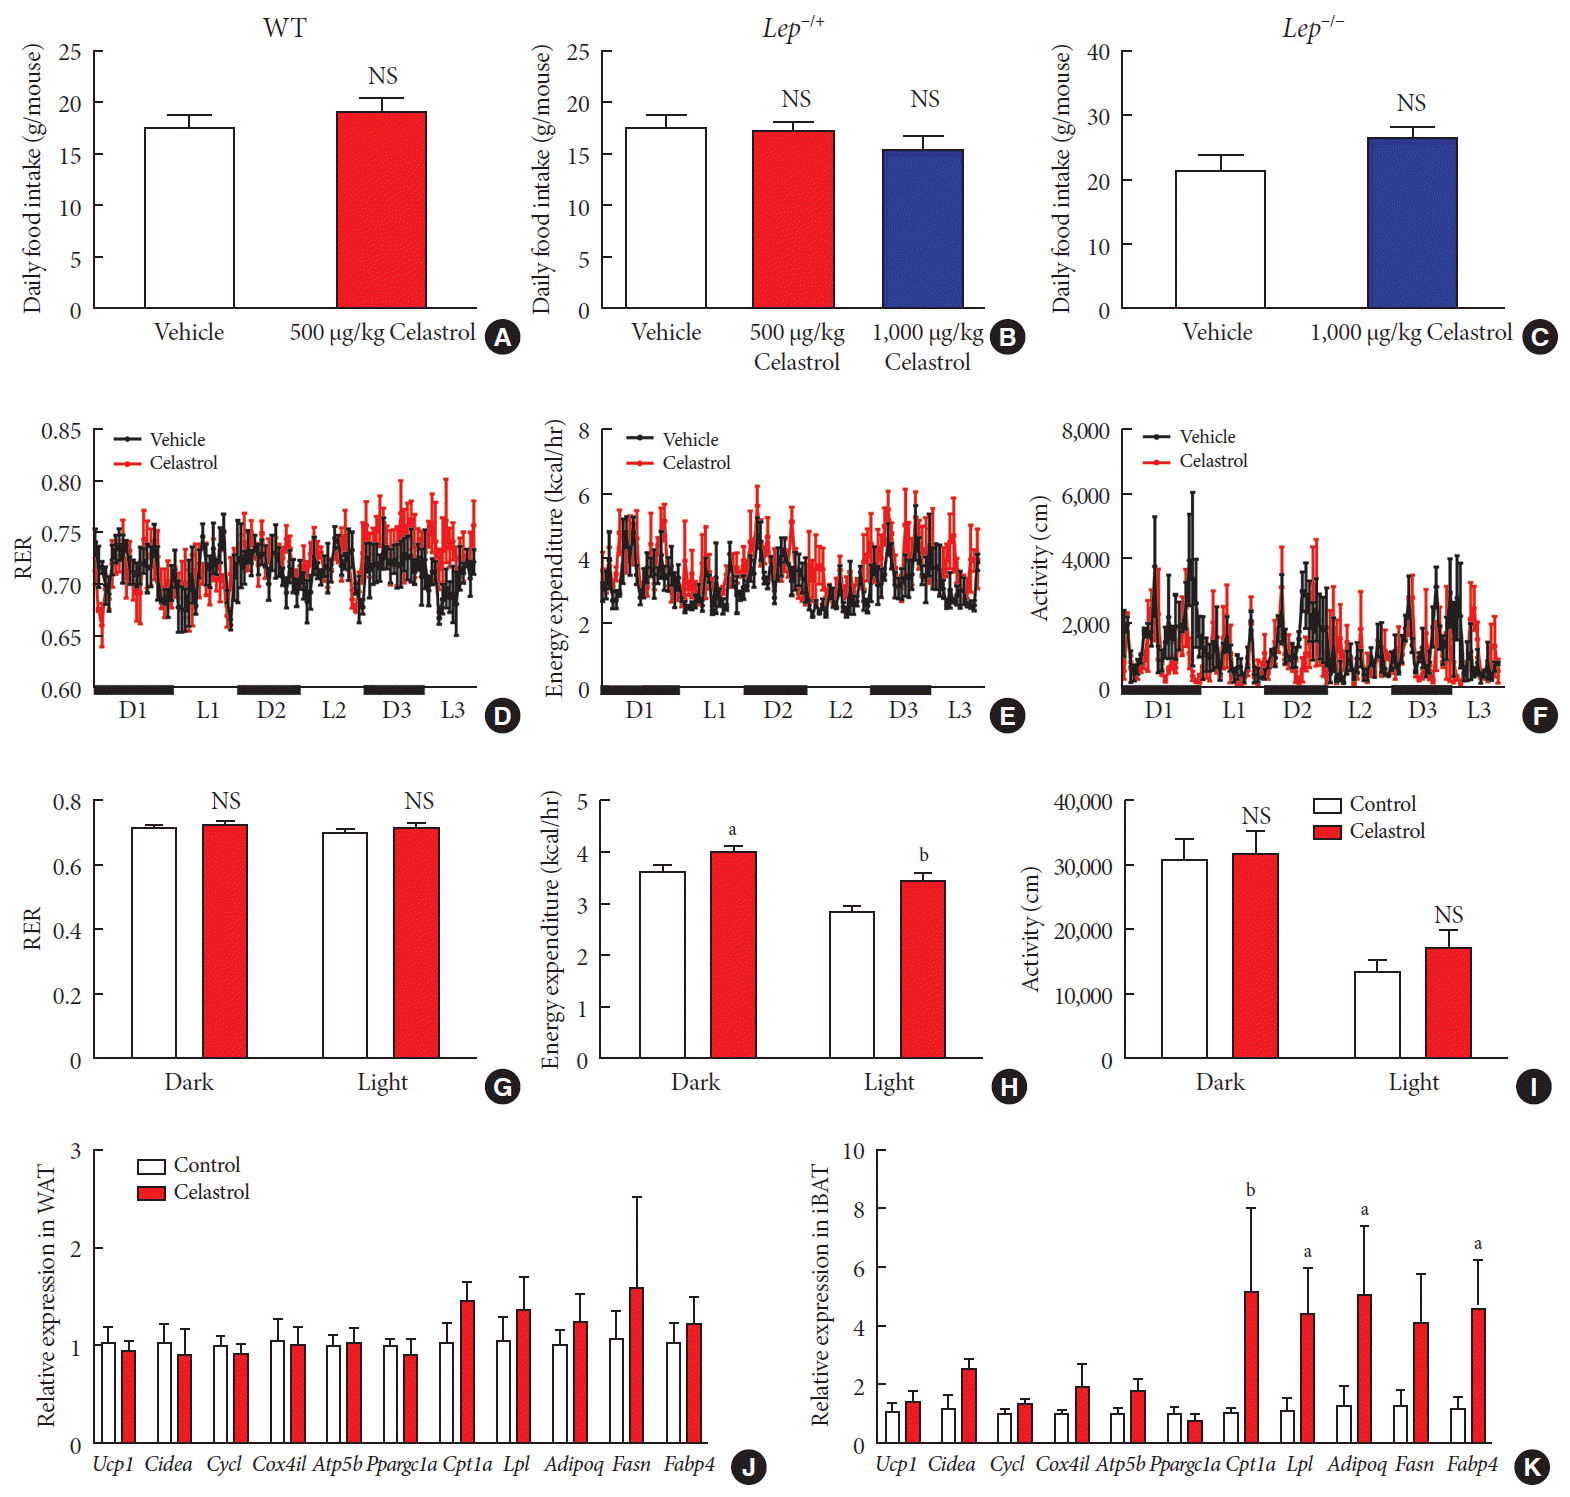
Obesity is the result of an interrupted balance between the intake and consumption of energy. To lose weight, an organism must consume more calories than it takes in; however, whether celastrol affects intake or consumption remains unresolved. We first recorded the daily food intake of the rats, which was approximately 20 g, and no difference was observed between the WT, Lep−/+ or Lep−/− rats treated with celastrol and those treated with vehicle (Fig. 5A–C and Supplementary Fig. 4). This implied that the oral administration of celastrol at the present dose had no impact on food intake, although the signaling pathway of leptin, the appetite hormone, was activated.
Therefore, we conducted a metabolic chamber experiment to examine whether EE, the respiratory exchange ratio (RER) or the level of physical activity were altered after 1 week of treatment, when the gut microbiota had improved. Regarding RER, the rats from the two groups maintained relatively stable respiratory function during the dark and light cycles (Fig. 5D and G), although the RER value was slightly but not significantly increased in the celastrol-treated rats. The RER reflected the relative use of carbohydrates versus lipids as a source of energy, and the results implied a potential switch of fuel to carbohy drates in the celastrol-treated group. The level of physical activity was the total distance that the rats moved in the chamber. The celastrol-treated rats exhibited higher activity than that of the vehicle-treated rats in the light phase, but a statistically significant difference was not observed (Fig. 5F and I). Regarding EE, the red broken lines were obviously higher than the black lines in the dynamic longitudinal chart, indicating the enhancement of thermogenesis (Fig. 5E). By calculating the average levels in the dark and light phases, we found that the rats treated with celastrol did expend more energy than those in the vehicle-treated group and that the difference was more obvious in the light cycle, which may have been due to hyperactivity, which was revealed by increased physical activity (Fig. 5H). Our data demonstrated that celastrol-induced weight loss resulted from the negative regulation of energy homeostasis and that the EE was enhanced while there was no alteration in food intake.
To examine increased EE at the level of transcription, we assessed the expression of some genes involved in fatty acid metabolism in both abdominal WAT and interscapular BAT. In WAT, markers of browning, including uncoupling protein 1 (Ucp1), cell death inducing DFFA like effector a (Cidea), and PPARG coactivator 1 alpha (Ppargc1a), were not differentially expressed (Fig. 5J), and a slight but not marked induction of carnitine palmitoyltransferase 1A (Cpt1a), adiponectin, C1Q and collagen domain containing (Adipoq), and fatty acid synthase (Fasn) was observed. In BAT, we found strong activation of the entire gene set, especially Cpt1a, lipoprotein lipase (Lpl), Adipoq, Fasn, and fatty acid binding protein 4 (Fabp4), were expressed at a high level, in rats treated with celastrol (Fig. 5K). Taken together, the results suggested that the upregulation of genes associated with fatty acid metabolism in BAT supported the enhancement of EE in DIO rats treated with celastrol.
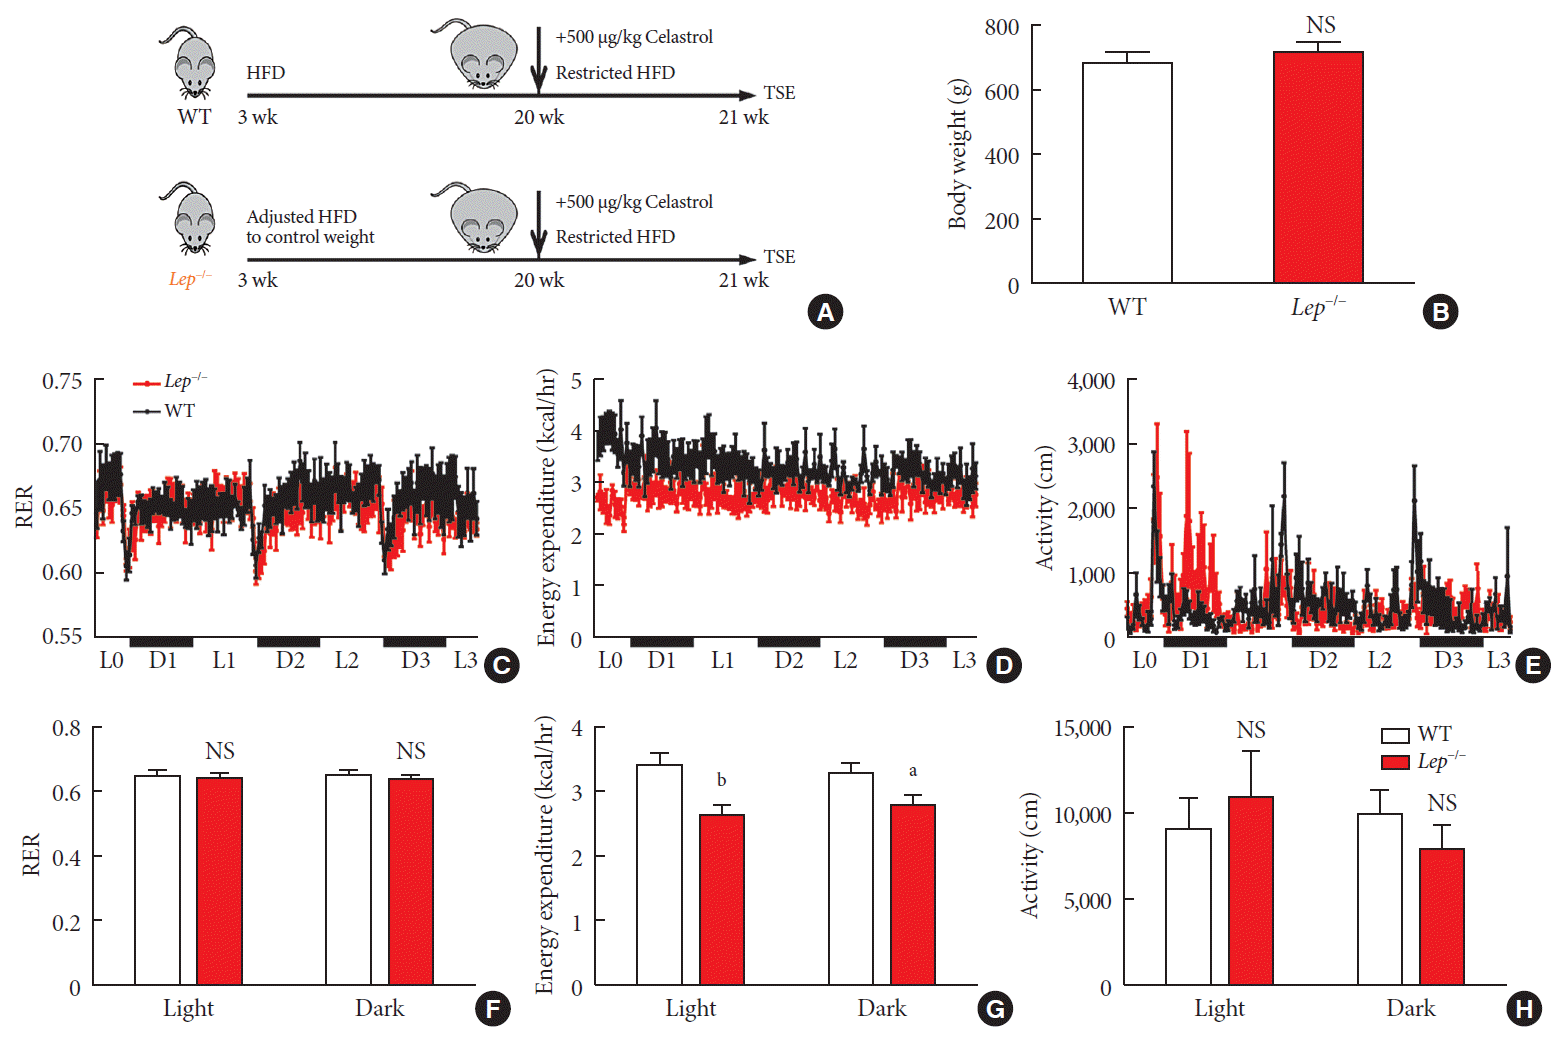
Now that we knew that celastrol reduced BW by EE expenditure and that the hypothalamic leptin signaling pathway was activated without an influence on feeding behavior, we next tested whether leptin signaling played a role in such enhancement (Fig. 6A). We fed WT and Lep−/− rats with the same volume of HFD to test metabolism based on equivalent caloric intake. However, under normal conditions, the weight of the WT and Lep−/− rats was significantly different compared to that of the Lep−/− rats, which were extremely obese, and this may have affected metabolism. To avoid the effects of weight, we restricted the food intake of Lep−/− rats after weaning and acquired a baseline BW that was the same as that of WT rats (Fig. 6B).
As shown in Fig. 6C-H, no alteration was observed in the RER of Lep−/− rats. Additionally, compared to that of the WT rats, the level of physical activity of the Lep−/− rats was increased in the light cycle but reduced in the dark cycle. However, the EE of the Lep−/− rats was significantly diminished upon treatment with the same dose of celastrol, especially in the light cycle. This finding indicated the participation of leptin in the enhancement of EE by celastrol, which helps to explain the ineffectiveness of celastrol when leptin is homozygously deleted.
For the potential clinical application of celastrol, we aimed to assess the acute toxicity of different doses of celastrol using a mouse model based on the dose of celastrol used in the rats. Mice were orally administered 0, 0.1, 0.5, 2.5, 12.5, or 62.5 mg/kg BW celastrol and then kept in cages for surveillance over a 5-day period (Supplementary Fig. 5A). Consistent with the results of the long-term chronic toxicity test [14], no death occurred even when the dose increased to 62.5 mg/kg BW, which is equivalent to approximately 30 mg/kg BW in rats, which was a high dose in usual tests (Supplementary Fig. 5B). No significant differences in organ coefficients or blood biochemistry were revealed by blinded observation (Supplementary Figs. 6 and 7). This finding suggested the relative safety of celastrol when administered through an oral route. In contrast, the intraperitoneal injection of celastrol induced an adverse reaction that severely inhibited the appetite of the rats. During the pilot test, we dissected the rat abdomen and observed precipitate, which we thought may have been due to the different absorption rates of the solute and solvents, i.e., celastrol, ethanol, and DMSO (Supplementary Fig. 5C and D).
Recently, the global prevalence of obesity has gradually become more serious, and it poses a major challenge to public health. Publications on various treatments for obesity have aroused the attention of society; however, there are still patients suffering from the effects of obesity and failed weight loss. In fact, except for patients affected by genetic factors [30], most overweight and obese patients can control their weight through regular life, diet and exercise [31]; however, food is sometimes the only comfort against the pressure of modern life. To address the desire for safe and effective weight loss drugs, the present study was performed in a rat model and found that celastrol has an anti-obesity effect, mainly improving gut microbiota homeostasis and regulating the sensitivity of the leptin signaling pathway in the hypothalamic energy-regulating center, thus increasing energy consumption and decreasing weight.
The microbiota acts as a medium for contact between the body and the outside environment, and it is well established that abnormalities in the gut microbiota are closely associated with gastrointestinal inflammation, neurobehavioral developmental disorders, cancer, and metabolic diseases [3233]. The diversity of the intestinal flora of indigenous tribes living in forests, who have lower serum lipid parameters, is reportedly higher than that of urban populations [34]. It has also been found that the diversity of the gut microbiota of obese mice is significantly lower than that of normal-weight mice in research using animal models [35]. Energy metabolism, as well as BW, changes when the microbiota is disturbed via antibiotics or even transplantation of the microbiome [1721]. All of these studies have established the relationship between the gut microbiota and BW, and Bacteroidetes and Firmicutes are the two most important phyla of bacteria in the gastrointestinal tract and play critical roles in the occurrence and prognosis of obesity [36].
In accordance with the abovementioned findings, our results show that the ratio of Bacteroidetes to Firmicutes increases to a stable state after at least 2 weeks of treatment with celastrol. Firmicutes is well known to have an important impact on lipid metabolism, making the body prefer the absorption and storage rather than the consumption of fatty acids [37]. When the abundance of Firmicutes and Bacteroidetes is reduced by antibiotics, the glucose tolerance and insulin sensitivity of obese mice are significantly improved [38]; this has been reported to be caused by increased secretion of glucagon-like peptide-1 [39], but this has not confirmed in randomized control trials [40]. It is worth noting that the relative abundances of Firmicutes and Bacteroidetes are strictly regulated by each other and can be transiently changed by the diet [19], which means that the improved diversity of the gut microbiota observed in our study may have also been the result of feeding. In fact, the abundances of Firmicutes and Bacteroidetes gradually changed while the food intake of the rats from the two groups remained constant throughout the 3-week treatment; this ruled out this possibility and indicated that celastrol was the cause of the alterations in the microbiota.
In organisms, the gut microbiota is mainly involved in the synthesis of short-chain fatty acids, of which acetate, propionate and butyrate are considered to be closely related to obesity [41]. A recent study showed that acetate can stimulate the parasympathetic nervous system, promote insulin and ghrelin secretion, enhance appetite, and thus cause obesity, which provide an example of the regulation of the gut-brain axis in energy metabolism [42]. In hypothalamic circuits, POMC- and AgRP/NPY-expressing neurons jointly regulate appetite and energy homeostasis in the body [5], and mounting evidence has suggested that insulin and leptin are major factors involved in such regulation. Nevertheless, the past treatment of obesity with leptin supplements failed due to leptin resistance, which led to the ineffectiveness of leptin and the persistence of hyperphagia [43]. Our study revealed that the leptin signaling pathway plays a pivotal role in the anti-obesity effect of celastrol and that antibiotics can significantly inhibit the phosphorylation of STAT3, indicating the involvement of the gut microbiota in the improvement of leptin sensitivity. In fact, many studies have shown a link between the gut microbiota and insulin sensitivity [44], and our findings provide an elementary assessment of the association between the gut microbiota and leptin sensitivity to supplement the insufficient prior observations [45].
Although leptin has been reported to be involved in the regulation of appetite, recent studies have also found that leptin has crucial effects on EE, which may be finely mapped to hypothalamic nitric oxide synthase-1-expressing neurons [46]. Here, we were surprised to find that celastrol had no effect on the feeding behavior of rats, which is slightly inconsistent with a recently published work by Pfluger et al. [47]. The differences may have been due to the rodent species, dosages, and administration routes used and that intraperitoneal injection was not applicable in our hands. In the present study, by using a metabolic monitoring system, celastrol was observed to enhance energy consumption, which may have been supported by the activation of the HSF1-peroxisome proliferator-activated receptor gamma coactivator 1α (PGC1α) transcriptional axis in fat and muscle [16]. Subsequently, we found that the enhancement of EE was mainly mediated by the leptin pathway under strict experimental conditions. According to previous reports, the transition of white fat into beige fat increases the content of mitochondria in cells, thus promoting oxidative phosphorylation and enhancing thermogenesis [21], and the expression of Ucp1 and Cidea in WAT was not upregulated here. We hypothesize that (1) white fat browning occurs at specific sites but not in the abdominal fat collected by us and (2) celastrol enhances energy consumption through other approaches rather than the browning of WAT
Although obesity seriously affects human health, weight loss that occurs too quickly can also cause a series of problems, such as cholecystitis. It is generally accepted that a weekly calorie deficit of 3,500 calories, or approximately 1 pound of fat, which is equivalent to a weekly loss of 0.5% of BW for a 100 kg adult, through diet and exercise is the healthiest way to lose weight. In several studies on obesity treatment, however, the BW of animal subjects was decreased at a rate of 8% or more in 1 week [48], which is equivalent to a reduction of approximately 8 kg a week in humans. Excessive weight loss such as this mainly consumes muscle, causing potential damage to metabolism, which in turn leads to rebound weight gain. In the present study, rats lost an average of 25 g in three weeks, which equaled approximately 1.3% of the initial BW per week, and we believe that this weight loss rate is relatively safe and more reasonable; thus, it possible to use celastrol for the maintenance of a healthy weight.
In summary, the present study revealed that the oral administration of celastrol enhances EE and decreases BW by improving the gut microbiota and the activation of the hypothalamic leptin signaling pathway. By evaluating acute toxicity, we found that celastrol is relatively safe at a dose of 62.5 mg/kg BW in mice, providing a reference and elucidating the potential clinical application of celastrol in the future.
ACKNOWLEDGMENTS
We are grateful for the Lep−/+ rats provided by Dr. Guoping Fan. This study was supported by the Key Program of National Natural Science Foundation (81330067); the Program of National Natural Science Foundation of China (81573182); the Qing Lan Project of Jiangsu Province, Six Talent Peaks Project of Jiangsu Province (JY-052); the Second Level of Training Object of Jiangsu Province “333” Project; and the Priority Academic Program Development of Jiangsu Higher Education Institutions (PAPD).
References
1. Yoshimoto S, Loo TM, Atarashi K, Kanda H, Sato S, Oyadomari S, Iwakura Y, Oshima K, Morita H, Hattori M, Honda K, Ishikawa Y, Hara E, Ohtani N. Obesity-induced gut microbial metabolite promotes liver cancer through senescence secretome. Nature. 2013; 499:97–101.
2. Tseng YH, Cypess AM, Kahn CR. Cellular bioenergetics as a target for obesity therapy. Nat Rev Drug Discov. 2010; 9:465–482.
3. Al-Najim W, Docherty NG, le Roux CW. food intake and eating behavior after bariatric surgery. Physiol Rev. 2018; 98:1113–1141.
4. Cone RD. Studies on the physiological functions of the melanocortin system. Endocr Rev. 2006; 27:736–749.
5. Sohn JW, Elmquist JK, Williams KW. Neuronal circuits that regulate feeding behavior and metabolism. Trends Neurosci. 2013; 36:504–512.
6. Gropp E, Shanabrough M, Borok E, Xu AW, Janoschek R, Buch T, Plum L, Balthasar N, Hampel B, Waisman A, Barsh GS, Horvath TL, Bruning JC. Agouti-related peptide-expressing neurons are mandatory for feeding. Nat Neurosci. 2005; 8:1289–1291.
7. Paz-Filho G, Mastronardi CA, Licinio J. Leptin treatment: facts and expectations. Metabolism. 2015; 64:146–156.
8. Saltiel AR. New therapeutic approaches for the treatment of obesity. Sci Transl Med. 2016; 8:323rv2.
9. Chang CJ, Lin CS, Lu CC, Martel J, Ko YF, Ojcius DM, Tseng SF, Wu TR, Chen YY, Young JD, Lai HC. Ganoderma lucidum reduces obesity in mice by modulating the composition of the gut microbiota. Nat Commun. 2015; 6:7489.
10. Wu TR, Lin CS, Chang CJ, Lin TL, Martel J, Ko YF, Ojcius DM, Lu CC, Young JD, Lai HC. Gut commensal Parabacteroides goldsteinii plays a predominant role in the anti-obesity effects of polysaccharides isolated from Hirsutella sinensis. Gut. 2019; 68:248–262.
11. Zhang Z, Zhang H, Li B, Meng X, Wang J, Zhang Y, Yao S, Ma Q, Jin L, Yang J, Wang W, Ning G. Berberine activates thermogenesis in white and brown adipose tissue. Nat Commun. 2014; 5:5493.
12. Kannaiyan R, Shanmugam MK, Sethi G. Molecular targets of celastrol derived from Thunder of God Vine: potential role in the treatment of inflammatory disorders and cancer. Cancer Lett. 2011; 303:9–20.
13. Guo L, Luo S, Du Z, Zhou M, Li P, Fu Y, Sun X, Huang Y, Zhang Z. Targeted delivery of celastrol to mesangial cells is effective against mesangioproliferative glomerulonephritis. Nat Commun. 2017; 8:878.
14. Liu J, Lee J, Salazar Hernandez MA, Mazitschek R, Ozcan U. Treatment of obesity with celastrol. Cell. 2015; 161:999–1011.
15. Greenhill C. Celastrol identified as a leptin sensitizer and potential novel treatment for obesity. Nat Rev Endocrinol. 2015; 11:444.
16. Ma X, Xu L, Alberobello AT, Gavrilova O, Bagattin A, Skarulis M, Liu J, Finkel T, Mueller E. Celastrol protects against obesity and metabolic dysfunction through activation of a HSF1-PGC1α transcriptional axis. Cell Metab. 2015; 22:695–708.
17. Ridaura VK, Faith JJ, Rey FE, Cheng J, Duncan AE, Kau AL, Griffin NW, Lombard V, Henrissat B, Bain JR, Muehlbauer MJ, Ilkayeva O, Semenkovich CF, Funai K, Hayashi DK, Lyle BJ, Martini MC, Ursell LK, Clemente JC, Van Treuren W, Walters WA, Knight R, Newgard CB, Heath AC, Gordon JI. Gut microbiota from twins discordant for obesity modulate metabolism in mice. Science. 2013; 341:1241214.
18. Turnbaugh PJ, Ley RE, Mahowald MA, Magrini V, Mardis ER, Gordon JI. An obesity-associated gut microbiome with increased capacity for energy harvest. Nature. 2006; 444:1027–1031.
19. Zhao L, Zhang F, Ding X, Wu G, Lam YY, Wang X, Fu H, Xue X, Lu C, Ma J, Yu L, Xu C, Ren Z, Xu Y, Xu S, Shen H, Zhu X, Shi Y, Shen Q, Dong W, Liu R, Ling Y, Zeng Y, Wang X, Zhang Q, Wang J, Wang L, Wu Y, Zeng B, Wei H, Zhang M, Peng Y, Zhang C. Gut bacteria selectively promoted by dietary fibers alleviate type 2 diabetes. Science. 2018; 359:1151–1156.
20. Xu S, Zhu X, Li H, Hu Y, Zhou J, He D, Feng Y, Lu L, Du G, Hu Y, Liu T, Wang Z, Ding G, Chen J, Gao S, Wu F, Xue Z, Li Y, Fan G. The 14th Ile residue is essential for leptin function in regulating energy homeostasis in rat. Sci Rep. 2016; 6:28508.
21. Suárez-Zamorano N, Fabbiano S, Chevalier C, Stojanovic O, Colin DJ, Stevanovic A, Veyrat-Durebex C, Tarallo V, Rigo D, Germain S, Ilievska M, Montet X, Seimbille Y, Hapfelmeier S, Trajkovski M. Microbiota depletion promotes browning of white adipose tissue and reduces obesity. Nat Med. 2015; 21:1497–1501.
22. Callahan BJ, Sankaran K, Fukuyama JA, McMurdie PJ, Holmes SP. Bioconductor Workflow for Microbiome Data Analysis: from raw reads to community analyses. Version 2. F1000Res. 2016; 5:1492.
23. Love MI, Anders S, Kim V, Huber W. RNA-seq workflow: gene-level exploratory analysis and differential expression. F1000Res. 2015; 4:1070.
24. Basso N, Soricelli E, Castagneto-Gissey L, Casella G, Albanese D, Fava F, Donati C, Tuohy K, Angelini G, La Neve F, Severino A, Kamvissi-Lorenz V, Birkenfeld AL, Bornstein S, Manco M, Mingrone G. Insulin resistance, microbiota, and fat distribution changes by a new model of vertical sleeve gastrectomy in obese rats. Diabetes. 2016; 65:2990–3001.
25. Turnbaugh PJ, Hamady M, Yatsunenko T, Cantarel BL, Duncan A, Ley RE, Sogin ML, Jones WJ, Roe BA, Affourtit JP, Egholm M, Henrissat B, Heath AC, Knight R, Gordon JI. A core gut microbiome in obese and lean twins. Nature. 2009; 457:480–484.
26. Cani PD, Bibiloni R, Knauf C, Waget A, Neyrinck AM, Delzenne NM, Burcelin R. Changes in gut microbiota control metabolic endotoxemia-induced inflammation in high-fat diet-induced obesity and diabetes in mice. Diabetes. 2008; 57:1470–1481.
27. Grasset E, Puel A, Charpentier J, Collet X, Christensen JE, Terce F, Burcelin R. A specific gut microbiota dysbiosis of type 2 diabetic mice induces GLP-1 resistance through an enteric NO-dependent and gut-brain axis mechanism. Cell Metab. 2017; 25:1075–1090.
28. Considine RV, Sinha MK, Heiman ML, Kriauciunas A, Stephens TW, Nyce MR, Ohannesian JP, Marco CC, McKee LJ, Bauer TL, Caro JF. Serum immunoreactive-leptin concentrations in normal-weight and obese humans. N Engl J Med. 1996; 334:292–295.
29. Ozcan U, Yilmaz E, Ozcan L, Furuhashi M, Vaillancourt E, Smith RO, Gorgun CZ, Hotamisligil GS. Chemical chaperones reduce ER stress and restore glucose homeostasis in a mouse model of type 2 diabetes. Science. 2006; 313:1137–1140.
30. Angulo MA, Butler MG, Cataletto ME. Prader-Willi syndrome: a review of clinical, genetic, and endocrine findings. J Endocrinol Invest. 2015; 38:1249–1263.
32. Tremaroli V, Backhed F. Functional interactions between the gut microbiota and host metabolism. Nature. 2012; 489:242–249.
33. Zhao L. The gut microbiota and obesity: from correlation to causality. Nat Rev Microbiol. 2013; 11:639–647.
34. Martinez I, Stegen JC, Maldonado-Gomez MX, Eren AM, Siba PM, Greenhill AR, Walter J. The gut microbiota of rural papua new guineans: composition, diversity patterns, and ecological processes. Cell Rep. 2015; 11:527–538.
35. Murphy EF, Cotter PD, Healy S, Marques TM, O'Sullivan O, Fouhy F, Clarke SF, O'Toole PW, Quigley EM, Stanton C, Ross PR, O'Doherty RM, Shanahan F. Composition and energy harvesting capacity of the gut microbiota: relationship to diet, obesity and time in mouse models. Gut. 2010; 59:1635–1642.
36. Ley RE, Turnbaugh PJ, Klein S, Gordon JI. Microbial ecology: human gut microbes associated with obesity. Nature. 2006; 444:1022–1023.
37. Semova I, Carten JD, Stombaugh J, Mackey LC, Knight R, Farber SA, Rawls JF. Microbiota regulate intestinal absorption and metabolism of fatty acids in the zebrafish. Cell Host Microbe. 2012; 12:277–288.
38. Murphy EF, Cotter PD, Hogan A, O'Sullivan O, Joyce A, Fouhy F, Clarke SF, Marques TM, O'Toole PW, Stanton C, Quigley EM, Daly C, Ross PR, O'Doherty RM, Shanahan F. Divergent metabolic outcomes arising from targeted manipulation of the gut microbiota in diet-induced obesity. Gut. 2013; 62:220–226.
39. Hwang I, Park YJ, Kim YR, Kim YN, Ka S, Lee HY, Seong JK, Seok YJ, Kim JB. Alteration of gut microbiota by vancomycin and bacitracin improves insulin resistance via glucagon-like peptide 1 in diet-induced obesity. FASEB J. 2015; 29:2397–2411.
40. Reijnders D, Goossens GH, Hermes GD, Neis EP, van der Beek CM, Most J, Holst JJ, Lenaerts K, Kootte RS, Nieuwdorp M, Groen AK, Olde Damink SW, Boekschoten MV, Smidt H, Zoetendal EG, Dejong CH, Blaak EE. Effects of gut microbiota manipulation by antibiotics on host metabolism in obese humans: a randomized double-blind placebo-controlled trial. Cell Metab. 2016; 24:63–74.
41. Hartstra AV, Bouter KE, Backhed F, Nieuwdorp M. Insights into the role of the microbiome in obesity and type 2 diabetes. Diabetes Care. 2015; 38:159–165.
42. Perry RJ, Peng L, Barry NA, Cline GW, Zhang D, Cardone RL, Petersen KF, Kibbey RG, Goodman AL, Shulman GI. Acetate mediates a microbiome-brain-β-cell axis to promote metabolic syndrome. Nature. 2016; 534:213–217.
43. Frederich RC, Hamann A, Anderson S, Lollmann B, Lowell BB, Flier JS. Leptin levels reflect body lipid content in mice: evidence for diet-induced resistance to leptin action. Nat Med. 1995; 1:1311–1314.
44. Kootte RS, Levin E, Salojarvi J, Smits LP, Hartstra AV, Udayappan SD, Hermes G, Bouter KE, Koopen AM, Holst JJ, Knop FK, Blaak EE, Zhao J, Smidt H, Harms AC, Hankemeijer T, Bergman JJGHM, Romijn HA, Schaap FG, Olde Damink SWM, Ackermans MT, Dallinga-Thie GM, Zoetendal E, de Vos WM, Serlie MJ, Stroes ESG, Groen AK, Nieuwdorp M. Improvement of insulin sensitivity after lean donor feces in metabolic syndrome is driven by baseline intestinal microbiota composition. Cell Metab. 2017; 26:611–619.
45. Everard A, Lazarevic V, Derrien M, Girard M, Muccioli GG, Neyrinck AM, Possemiers S, Van Holle A, Francois P, de Vos WM, Delzenne NM, Schrenzel J, Cani PD. Responses of gut microbiota and glucose and lipid metabolism to prebiotics in genetic obese and diet-induced leptin-resistant mice. Diabetes. 2011; 60:2775–2786.
46. Leshan RL, Greenwald-Yarnell M, Patterson CM, Gonzalez IE, Myers MG Jr. Leptin action through hypothalamic nitric oxide synthase-1-expressing neurons controls energy balance. Nat Med. 2012; 18:820–823.
47. Pfuhlmann K, Schriever SC, Baumann P, Kabra DG, Harrison L, Mazibuko-Mbeje SE, Contreras RE, Kyriakou E, Simonds SE, Tiganis T, Cowley MA, Woods SC, Jastroch M, Clemmensen C, De Angelis M, Schramm KW, Sattler M, Messias AC, Tschop MH, Pfluger PT. Celastrol-induced weight loss is driven by hypophagia and independent from UCP1. Diabetes. 2018; 67:2456–2465.
48. Finan B, Yang B, Ottaway N, Smiley DL, Ma T, Clemmensen C, Chabenne J, Zhang L, Habegger KM, Fischer K, Campbell JE, Sandoval D, Seeley RJ, Bleicher K, Uhles S, Riboulet W, Funk J, Hertel C, Belli S, Sebokova E, Conde-Knape K, Konkar A, Drucker DJ, Gelfanov V, Pfluger PT, Muller TD, Perez-Tilve D, DiMarchi RD, Tschop MH. A rationally designed monomeric peptide triagonist corrects obesity and diabetes in rodents. Nat Med. 2015; 21:27–36.
SUPPLEMENTARY MATERIALS
Supplementary materials related to this article can be found online at https://doi.org/10.4093/dmj.2019.0124.