

 PDF
PDF Citation
 Print
Print


INTRODUCTION
According to the World Health Organization (WHO), health equity constitutes the absence of preventable, unfair, or soluble differences in aspects of health among groups based on social, economic, demographic, or geographic factors [1]. Although health inequity can be caused by differences in a variety of factors including gender, ethnicity, income, education, and occupation [2], regional or geographical differences are well-known factors that influence health disparities [34].
In 2011, the Korean government established the National Health Plan 2020 (NHP 2020), which set 2 major goals: increasing healthy life expectancy and achieving health equity [5]. However, the Korean Society for Equity in Health recently reported that healthy life expectancy varied among regional types in Korean [6]. In addition, the prevalence of cardiometabolic risk factors, such as obesity, metabolic syndrome, and diabetes, differed between urban and rural areas [78910].
Urbanization has also affected health-related lifestyle factors in Korea, in that urban residents tended to have a westernized lifestyle rather than the traditional Korean lifestyle [11121314]. Previous studies for Koreans reported that age-specific health behaviors, such as exercise, daily activity, and weight reduction, differed among residential areas [13]; moreover, older people in rural areas showed unbalanced food and nutrient intakes, compared to older people in urban areas [14].
Regional disparities in cardiometabolic health can be attributed to different diet and lifestyle factors. A healthy diet, defined by the consumption of appropriate levels of fat, sodium, fruits, and vegetables, as well as the use of nutrition labels, is a major index of the NHP 2020; in addition, the Korean government has continuously monitored regional disparities in healthy diets [5]. Regional disparities in cardiometabolic health risks and healthy diets deserve investigation as the basic information for establishing public health policy in Korea. Therefore, this study investigated the associations of cardiometabolic risk factors and dietary factors with regional types (metropolitan, urban, and rural), and examined associations between cardiometabolic risk factors and unhealthy dietary factors by regional type in Korea using a large-scale national survey.
Go to : 
SUBJECTS AND METHODS
Study design and participants
This study used data from the 2007–2017 Korea National Health and Nutrition Examination Survey (KNHANES). KNHANES is an ongoing nationwide cross-sectional survey conducted by the Korea Centers for Disease Control and Prevention (KCDC) that examines a nationally representative sample of Koreans. The survey includes a health interview, health examination, and dietary survey; detailed information regarding the survey procedures has been previously described [15]. KNHANES was approved by the KCDC Institutional Review Board (IRB) until 2014, and has been conducted without deliberation according to the bioethics law since 2015 (IRB NO.: 2007-02CON-04-P, 2008-04EXP-01-C, 2008-04EXP-01-C, 2010-02CON-21-C, 2010-02CON-21-C, 2012-01EXP-01-2C, 2013-07CON-03-4C, 2013-12EXP-03-5C). Written informed consent was obtained from all participants.
Among the 60,801 adults aged 19 years or older who participated in a 24-h dietary recall survey, those who were missing biochemical or anthropometric measurements (n = 9,873), lacked information regarding the use of nutrition labels (n = 9,864), were pregnant or lactating (n = 646), and reported implausible energy intake (< 500 or > 5,000 kcal/day) (n = 637) were excluded. In total, 39,781 participants were included in the final analysis.
Classification of regional types
Regional types were categorized into metropolitan, urban, and rural areas. In accordance with the administrative divisions of Korea, Seoul (the capital city) and 6 metropolitan cities were classified as metropolitan areas, while “dong” areas were classified as urban areas, and “eup” or “myeon” areas were classified as rural areas, including those located in metropolitan cities.
Assessment of healthy and unhealthy diets
Adherence to a healthy diet was defined as fulfillment of 2 or more of the following criteria, in accordance with the NHP 2020: 1) appropriate fat intake (15%–30% of energy), 2) sodium intake ≤ 2,000 mg/day, 3) fruit and vegetable intake ≥ 500 g/day, and 4) use of nutrition labels in food selection [5]. Recently, sugar intake (free sugar from processed foods < 10% of energy) has been added to a healthy diet of the NHP 2020 [16], however it was not included in this study because data of sugar intake was only available in 2016–2017 KNHANES. Daily nutrient and food group intakes were estimated using 1-day 24-h dietary recall method. Information regarding the use of nutrition labels in food selection was obtained from the dietary behavior questionnaire. This study examined associations between regional types and unhealthy dietary factors, which were regarded as opposites of healthy dietary factors. Because fat intake has a reciprocal relationship with carbohydrate intake, which is the major energy source for Koreans, excessive carbohydrate intake (> 65% of energy) was also evaluated [17]. Fruit and vegetable intakes were estimated separately; vegetable was divided into salted (kimchi and pickled vegetables) and unsalted (all vegetables except kimchi and pickled vegetables) vegetable intakes. The median fruit and vegetable intakes of the participants were used as reference values for fruit and vegetable intakes, respectively.
Definitions of cardiometabolic risk factors
In this study, cardiometabolic risk factors included obesity, metabolic syndrome, hypertension, and diabetes. Study participants were regarded as obese if their body mass index (BMI) ≥ 25 kg/m2, according to the WHO Asia-Pacific guidelines [18]. Based on the guidelines of the American Heart Association/National Heart, Lung, and Blood Institute Scientific Statement [19], excluding waist circumference [20], metabolic syndrome was defined as fulfillment of 3 or more of the following components: 1) abdominal obesity (≥ 90 cm for men and ≥ 85 cm for women), 2) elevated blood pressure (systolic blood pressure ≥ 130 mmHg, diastolic blood pressure ≥ 85 mmHg, or taking antihypertensive medications), 3) reduced high-density lipoprotein-cholesterol (< 40 mg/dL for men and < 50 mg/dL for women), 4) elevated triglycerides (≥ 150 mg/dL), and 5) elevated fasting blood glucose (≥ 100 mg/dL or the use of oral antidiabetic medications or insulin). Hypertension was diagnosed as a systolic blood pressure ≥ 140 mmHg or diastolic blood pressure ≥ 90 mmHg, or the use of antihypertensive medications; diabetes was diagnosed as fasting blood glucose ≥ 126 mg/dL, the use of oral antidiabetic medications or insulin, or a physician's diagnosis [21].
Other variables
Sociodemographic characteristics were obtained from the health interview; these included education, household income, marital status, and lifestyle factors such as physical activity, current smoking status, and alcohol consumption. Education level was categorized into elementary school or less, middle school, high school, and college or more. Household income level was divided into the lowest, lower-middle, upper-middle, and highest quartiles of monthly household income. Marital status was classified as married and unmarried. Physical activity was defined as “yes” if the study participants performed vigorous activity for at least 75 minutes per week, moderate activity for at least 150 minutes, or an equivalent combination of moderate and vigorous activities. Current smokers were defined as those who smoked ≥ 100 cigarettes over a lifetime and continued to smoke; alcohol consumers were regarded as those who drank alcoholic beverages more than once per month during the past year.
Statistical analysis
All statistical analyses were conducted using SAS ver. 9.4 (SAS Institute, Cary, NC, USA). The complex sampling design parameters of KNHANES, including strata, cluster, and weight, were applied to the PROC SURVEY procedure. Differences in study participants' general characteristics and their adherence to a healthy diet according to regional types were examined using the χ2 test. Odds ratios (ORs) and 95% confidence intervals (CIs) for cardiometabolic risk factors and unhealthy dietary factors according to regional types were calculated using a multiple logistic regression after adjustments for age, sex, BMI, education, household income, marital status, survey period, alcohol consumption, current smoking status, physical activity, and total energy intake. Considering the different age distribution by regional type, age-stratified analysis was conducted. In addition, associations between unhealthy dietary factors and cardiometabolic risk factors were examined for total participants and different regional types using a multiple logistic regression. For this analysis, the participants who had prior diagnoses and were receiving medications for hypertension, diabetes, or dyslipidemia were additionally excluded (n = 10,189), because they may have altered their dietary habits. All P-values were two-sided and P-values < 0.05 were considered statistically significant.
Go to :
RESULTS
General characteristics of participants
Among the study participants, 48.7%, 36.0%, and 15.2% lived in metropolitan, urban, and rural areas, respectively. Table 1 shows the sociodemographic characteristics and lifestyles of the study participants according to regional types. The distributions of sex, age group, education, household income, and marital status differed significantly among regional types (all P < 0.0001). The proportion of participants aged 65 years or older was highest in rural areas (14.8%) and lowest in urban areas (7.1%). Participants living in rural areas tended to have lower education and household income levels. The participants’ lifestyles, including physical activity, alcohol consumption, and current smoking status, also differed among regional types (all P < 0.0001). The proportions of participants who did not perform physical activity (57.9%) and were current smokers (31.6%) were highest in rural areas, while the proportion of alcohol consumers was lowest in rural areas (57.1%).
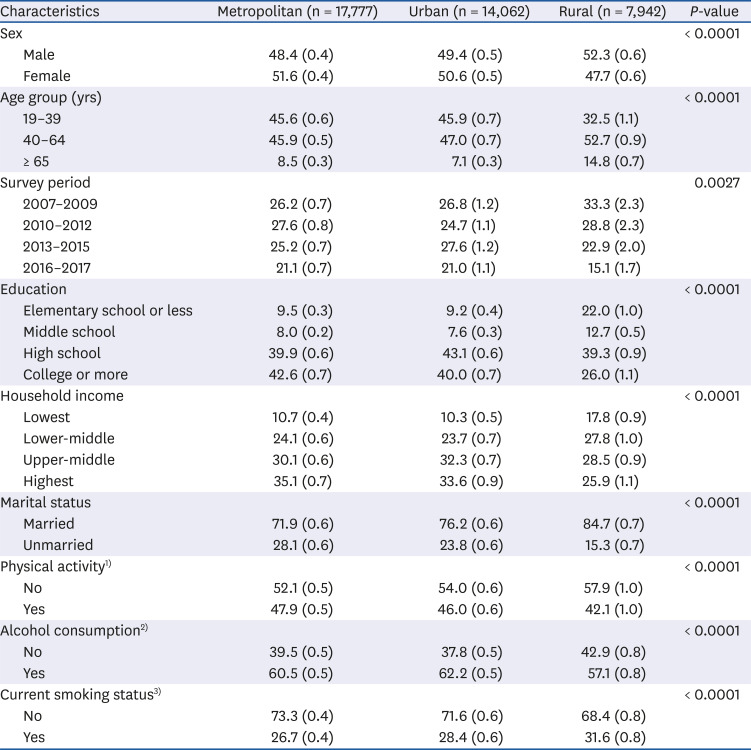
Table 1
General characteristics of study participants according to regional types in Korea
All values are presented as percentage (SE). The complex sampling design parameters of Korea National Health and Nutrition Examination Survey, including strata, cluster, and weight, were used in the PROC SURVEY procedure.
1)Physical activity: “yes” performed vigorous activity for at least 75 minutes, moderate activity for at least 150 minutes, or an equivalent combination of moderate and vigorous activities per week.
2)Alcohol consumption: “yes” consumed alcoholic beverages more than once per month during the past year.
3)Current smoking status: “yes” smoked ≥ 100 cigarettes over a lifetime and a current smoker.
![]()
Distribution of cardiometabolic risk factors and adherence to a healthy diet
The prevalence of obesity, metabolic syndrome, hypertension, and diabetes in total participants were 31.8%, 21.9%, 20.9%, and 7.4%, respectively. Rural residents had significantly higher prevalence of these risk factors than metropolitan and urban residents (all P < 0.0001) (Fig. 1).
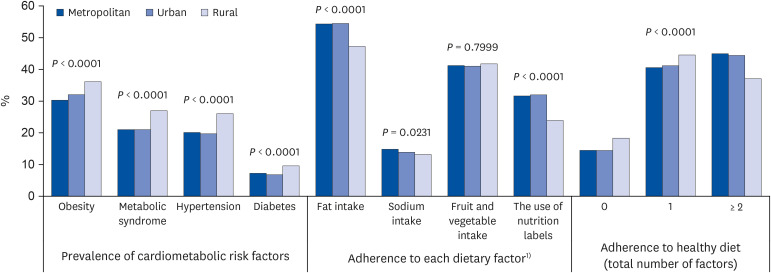 | Fig. 1Distribution of prevalence of cardiometabolic risk factors and adherence to a healthy diet among regional types in Korea.
1)Adherence to a healthy diet was defined as the fulfillment of 2 or more of the following criteria: 1) appropriate fat intake (15%–30% of energy), 2) sodium intake ≤ 2,000 mg/day, 3) fruit and vegetable intake ≥ 500 g/day, and 4) the use of nutrition labels in food selection.
|
Adherence to a healthy diet was highest in metropolitan areas (45.0%) and lowest in rural areas (37.1%); the distribution of adherence to a healthy diet differed significantly among regional types (P < 0.0001) (Fig. 1). Regarding individual dietary factors, the proportions of adults having appropriate amounts of fat and using nutrition labels in food selection were lowest in rural areas, compared to metropolitan and urban areas (all P < 0.0001). Rural areas also had the lowest proportion of adults with sodium intake ≤ 2,000 mg/day (13.2%), although this proportion was similar to the proportions of adults in urban (13.9%) and metropolitan (14.8%) areas (P = 0.0231). No significant differences were found in the adherences to fruit and vegetable intakes.
Cardiometabolic risk factors and regional types
Table 2 presents the multivariable-adjusted ORs for cardiometabolic risk factors among regional types. After adjustment for confounding variables, adults living in urban and rural areas had higher ORs for obesity (OR for urban, 1.07; 95% CI, 1.01–1.14; OR for rural, 1.14; 95% CI, 1.05–1.24) than adults living in metropolitan areas in total participants. When the data were stratified by age group, these higher ORs for obesity in urban and rural areas were observed in middle-aged adults (40–64 years) only. On the other hand, in middle-aged adults, urban residents had a lower OR for diabetes (OR, 0.85; 95% CI, 0.74–0.97) and rural residents had a lower OR for hypertension (OR, 0.86; 95% CI, 0.76–0.96), compared to metropolitan residents. In older adults aged ≥ 65 years, urban residents had a higher OR for hypertension (OR, 1.19; 95% CI, 1.02–1.39), but rural resident had a lower OR for metabolic syndrome (OR, 0.78; 95% CI, 0.67–0.91), compared to metropolitan residents. There was no significant association between cardiometabolic risk factors and regional types in younger adults aged 19–39 years.
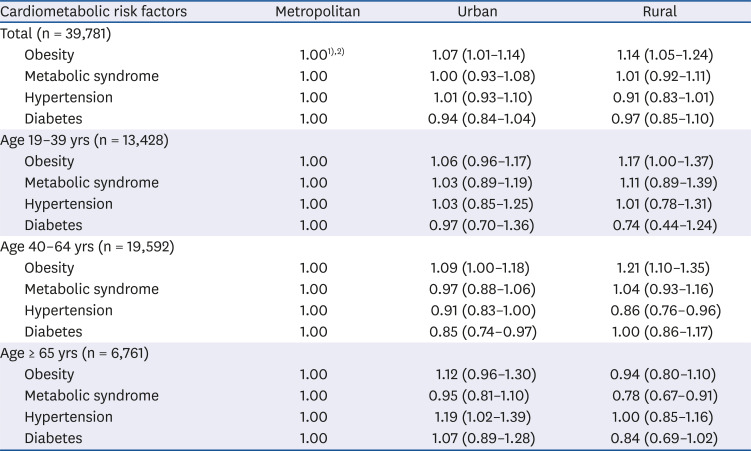
Table 2
Multivariable-adjusted odds ratios for cardiometabolic risk factors according to regional types in Korea
1)The complex sampling design parameters of Korea National Health and Nutrition Examination Survey, including strata, cluster, and weight, were used in the PROC SURVEY procedure.
2)Adjusted for age, sex, body mass index (except for obesity and metabolic syndrome), education, household income, marital status, survey period, alcohol consumption, current smoking status, physical activity, and total energy intake.
![]()
Unhealthy dietary factors and regional types
Table 3 presents the associations between unhealthy dietary factors and regional types. Compared to metropolitan residents, rural residents had higher ORs for inadequate fat intake (OR, 1.28; 95% CI, 1.17–1.39) and excessive carbohydrate intake (OR, 1.17; 95% CI, 1.07–1.28) in total participants. Total fruit and vegetable intake was not significantly associated with regional type, but significant associations were observed when fruit and vegetable intakes were separated. Participants living in rural areas had a higher OR for low fruit intake (OR, 1.14; 95% CI, 1.04–1.25) than participants living in metropolitan areas. The ORs for low vegetable intake were lower among urban (OR, 0.93; 95% CI, 0.87–0.99) and rural (OR, 0.90; 95% CI, 0.83–0.98) residents, while the ORs for high salted vegetable intake were higher among urban (OR, 1.08; 95% CI, 1.01–1.16) and rural (OR, 1.18; 95% CI, 1.07–1.29) residents, compared to metropolitan residents. The age-stratified analysis showed similar tendency of associations, although statistical significance was different among age groups. However, unlike other age groups, older adults living in rural areas had a higher OR for low unsalted vegetable intake (OR, 1.20; 95% CI, 1.02–1.40) than older adults in metropolitan areas. There were no significant associations between absence of nutrition label use and regional type.
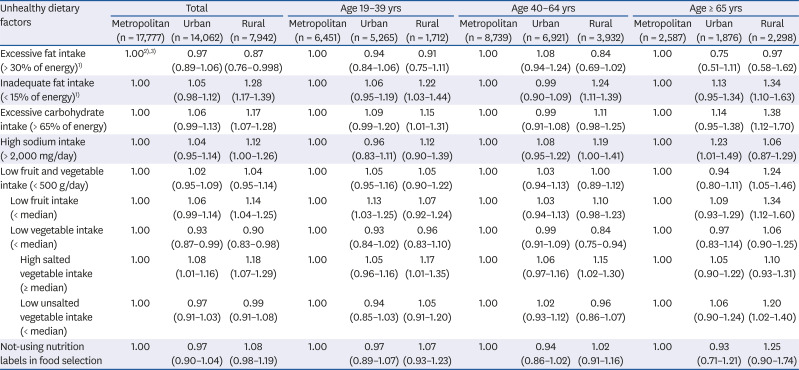
Table 3
Multivariable-adjusted odds ratios for unhealthy dietary factors according to regional types in Korea
1)The reference group was 15%–30% of energy.
2)The complex sampling design parameters of Korea National Health and Nutrition Examination Survey, including strata, cluster, and weight, were used in the PROC SURVEY procedure.
3)Adjusted for age, sex, body mass index, education, household income, marital status, survey period, alcohol consumption, current smoking status, physical activity, and total energy intake.
![]()
Association between cardiometabolic risk factors and unhealthy dietary factors
After adjustment for regional type and other confounders, low fruit intake was positively associated with obesity, metabolic syndrome, and hypertension in total participants; these significant associations were observed in all regional types except metabolic syndrome for metropolitan residents and obesity and hypertension for urban residents (Table 4). Excessive carbohydrate intake, low vegetable intake, and not-using nutrition labels were negatively associated with obesity, but these associations were found only in metropolitan residents. The participants with low unsalted vegetable intake had a higher OR for metabolic syndrome than those with high unsalted vegetable intake (OR, 1.11; 95% CI, 1.02–1.21). Diabetes was not significantly associated with unhealthy dietary factors.
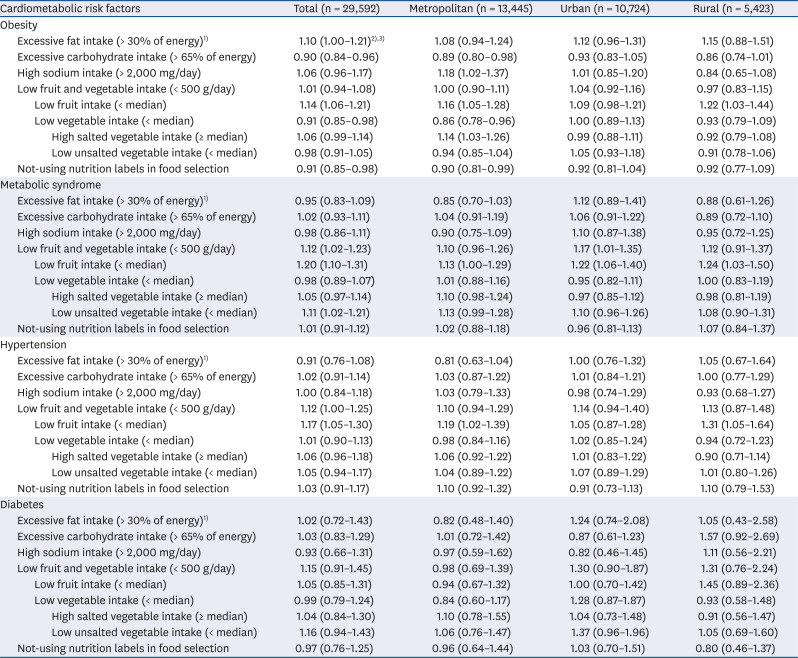
Table 4
Multivariable-adjusted odds ratios for cardiometabolic risk factors according to unhealthy dietary factors by regional types in Korea
1)The reference group was 15%–30% of energy.
2)The complex sampling design parameters of Korea National Health and Nutrition Examination Survey, including strata, cluster, and weight, were used in the PROC SURVEY procedure.
3)Adjusted for age, sex, regional type (for total participants only), body mass index (except for obesity and metabolic syndrome), education, household income, marital status, survey period, alcohol consumption, current smoking status, physical activity, and total energy intake.
![]()
Go to :
DISCUSSION
In this large-scale, cross-sectional study, cardiometabolic risk factors differed among regional types and age groups in Korea. Compared to metropolitan areas, middle-aged adults (40–64 years) in urban and rural areas had higher ORs for obesity, whereas middle-aged adults in urban and rural areas had lower ORs for diabetes and hypertension, respectively. In older adults (≥ 65 years), urban residents had a higher OR for hypertension and rural residents had a lower OR for metabolic syndrome, compared to metropolitan residents. Regarding dietary factors, rural residents tended to consume more carbohydrate and salted vegetables, but less fruits than metropolitan residents.
Approximately 40% of the study participants satisfied the minimum 500 g/day intake for fruit and vegetables recommended in the NHP 2020 [5]; this adherence to fruit and vegetable intake did not differ among regional types. However, when fruits and vegetables were evaluated separately, significant associations were found with regional types. A higher OR for low fruit intake was found in rural areas, compared to metropolitan areas. These results are similar to the findings of previous studies; specifically, the prevalence of low fruit intake was significantly higher in rural areas than in urban areas, whereas the prevalence of low vegetable intake did not differ between rural and urban areas among Chinese adults [22]. A cross-sectional study of Korean adults reported that disparities in fruit intake were greater than disparities in vegetable intake, when participants were stratified by education level [23].
Overall fruit and vegetable intake is typically regarded as an indicator of a healthy diet and is well-known to reduce non-communicable diseases, such as cardiovascular diseases and cancer [2425]. Moreover, some studies of the Korean population have shown that fruit intake has clearer inverse associations with cardiometabolic risk, compared to vegetable intake [2627]. In this study, low fruit intake was positively associated with obesity, metabolic syndrome, and hypertension, while low vegetable intake was negatively associated with obesity. These findings indicate that fruit and vegetable intakes might have different implications in the context of regional and socioeconomic disparities in Korea due to sub-types of vegetable intake among Koreans.
This study found that the higher vegetable intake in rural residents, compared to metropolitan residents, was due to high salted vegetable intake, rather than unsalted vegetable intake. Most salted vegetable intake is provided by kimchi, which is a major traditional food in the Korean diet [28]. Although high sodium intake was not associated with regional type after adjustment for confounding variables in this study except older adults in urban areas, the adherence to sodium intake was lowest (13%–15%) among other health dietary factors, as kimchi and other salted vegetables were the major foods that contributed to the sodium intake of Koreans [29]. Raw vegetable intake might have more beneficial health effects [2530], since low intake of unsalted vegetable was positively associated with metabolic syndrome in total participants in this study. Salted vegetable intake is linked with older age and lower socioeconomic status [2328], which is consistent with the characteristics of adults in rural areas in this study. Thus, nutritional policies for rural areas are needed to improve the availability and affordability of fresh vegetables and fruit, as well as to reduce the sodium content in salted vegetables.
Overall, adherence to appropriate fat intake was higher than adherence to other dietary factors, but rural areas showed the lowest adherence to fat intake, which could be explained by inadequate fat and excessive carbohydrate intakes. These findings were consistent with the results of previous studies [91331]. With rapid economic growth and urbanization, fat intake has gradually increased [32]. However, rural residents tend to maintain traditional dietary pattern, characterized by high consumption of white rice and kimchi [33]; moreover, Korean adults aged 65 years or older have been reported to consume more than 65% of their energy as carbohydrates [34]. In this study, carbohydrate intake more than 65% of energy was negatively associated with obesity in total participants, but it was not associated with obesity in rural residents. There have been inconsistent associations between carbohydrate intake and obesity for Korean adults [3536]. Total carbohydrate intake was inversely associated with obesity in men [3536]; in contrast, the dietary glycemic index and glycemic load, which are carbohydrate quality indices, were positively associated with obesity in women [36]. These findings indicate that more comprehensive analyses, including both quality and quantity, are necessary to elucidate the relationship between dietary carbohydrate and obesity in Korean adults.
In terms of fruit intake, a recent study of Koreans reported that whole fruit intake was inversely associated with the risk of obesity and high blood pressure [37]. This study also found that low fruit intake was positively associated with obesity and hypertension in the participants except urban residents. Therefore, healthy balanced diets with appropriate carbohydrate intake and higher intakes of both whole fruit and unsalted vegetables are important for reduction of regional disparities in cardiometabolic risk, especially for adults living in rural areas.
These findings suggest that middle-aged and older adults in metropolitan areas might have higher risk of hypertension and metabolic syndrome than those in rural areas after adjustment for sociodemographic and lifestyle characteristics, although metropolitan residents had better adherence to a healthy diet. It is difficult to explain a causal relationship between cardiometabolic risk and dietary factors resulted from regional type in the present study. However, this study indicates that nutritional and lifestyle interventions are required for cardiometabolic risk in middle-aged and older adults living in metropolitan areas.
In Korea, more than 80% of the population lives in urban areas [38]; in the current study, 48.7% and 36.0% of the participants lived in metropolitan and urban areas, respectively. The differences in unhealthy dietary factors between metropolitan and urban areas were not as clear as the differences between metropolitan and rural areas.
This study has several limitations. First, its cross-sectional design hindered derivation of a causal relationship between cardiometabolic risk factors and dietary factor by regional type in Korea. However, the study findings provided basic information that can aid understanding current regional disparities in cardiometabolic risk and dietary factors among Koreans by the regional type. Second, the dietary intake from 1-day dietary recall survey might not have represented the usual intake of the study participants. Third, regional disparities in cardiometabolic risk and dietary factors observed in this study might not be independent from sociodemographic characteristics such as age, sex, and education level in each regional type, although we adjusted major sociodemographic variables in a multiple logistic regression. Lastly, type I error might be inflated due to a subgroup analysis by age group. Thus, these study findings should be interpreted with caution. Despite these limitations, to the best of our knowledge, this is the first study to investigate associations between cardiometabolic risk factors and dietary factors among regional types in Korea using national data from the past 11 years.
In conclusion, these findings suggest that cardiometabolic risk and unhealthy dietary factors differ among regional types and age groups within Korea. In particular, Korean adults living in rural areas have unhealthy dietary patterns, such as higher carbohydrate and salted vegetable intakes, as well as lower fruit intake, compared to Korean adults living in metropolitan areas. Moreover, these dietary differences might be linked to the higher risk of obesity among middle-aged adults in rural areas. Nutritional policy and interventions should include considerations of regional types for prevention and management of cardiometabolic risk factors.
Go to :
 XML Download