

 PDF
PDF Citation
 Print
Print


INTRODUCTION
It is well known that, increased sodium intake elevates blood pressure, whereas decreased sodium intake attenuates blood pressure [12]. A previous meta-analysis revealed that a decrease in blood pressure by 5 mmHg was associated with a 9% and 14% decreased risk of mortality due to coronary heart disease and stroke, respectively [3]. Similarly, a 20-year follow-up of 2 sodium reduction trials identified a linear relationship between sodium intake and mortality [4]. Therefore, it has been suggested that increased sodium intake results in an increased risk of hypertension and thus cardiovascular disease (CVD)-associated morbidity and mortality [5].
The 2015 Dietary Reference Intakes for Koreans (KDRIs) recommends a sodium intake 1,500 mg/day for most adults and even less for adults ≥ 65 years of age [6]. However, as the mean sodium intake of the Korean population was > 4,000 mg/day at the time at which the KDRI was developed, the committee set a “Goal intake” of 2,000 mg/day according to the World Health Organization (WHO) guidelines (≤ 2,000 mg/day [7]), to make the reference intake more applicable to the public. Among 187 countries worldwide, Korea was in the top ten countries for sodium intake (mean, 4.92 g/day) in 1990 [8]. As a population, this intake peaked in 2005 (5,691.8 mg/day) and then decreased to 3,740.4 mg/day in 2017 [9]. This decrease in sodium intake is considered to be predominantly due to the reduction of sodium content in traditional foods with high sodium content, including kimchi, soy sauce, soy bean paste, and instant noodles (ramyun) [10]. However, the mean sodium intake of Koreans remains far above the WHO guidelines of 2,000 mg/day.
Despite traditional belief that lower sodium intake is better, recent reports point to evidence of a U- or J-shaped association between sodium intake and CVD risk in adults, rather than a continuously positive association [1112]. Although the association between dietary sodium intake and blood pressure has been corroborated, the association between sodium intake and morbidity and mortality has not yet been examined in the Korean population, whose sodium intakes are markedly higher than those of other populations. The burden of disease from high sodium intake in Koreans has been reported in a previous study, which analyzed urinary sodium and sodium intake data from 2 studies conducted in 1986 and 2005, respectively [13]. However, the previous study used minimum data two decades apart, which does not accurately reflect the national decrease in sodium intake over time and the resulting decrease in disease burden from high sodium intake in Korea. In addition, it is important to determine the risk of mortality from high sodium intake at an individual level.
Therefore, we comprehensively examined the trends in sodium intake (assessed by both 24-h diet recall and urinary sodium excretion) and determined the number of cases of all-cause- and CVD-related deaths attributable to high sodium intake in Koreans during the last 19 years using the Korea National Health and Nutrition Examination Survey (KNHANES) and the Korean Statistical Information Service (KOSIS) data. Furthermore, by directly linking sodium intake data with mortality data, we also assessed the risk of mortality according to sodium intake quartiles.
SUBJECTS AND METHODS
Comparative risk assessment (CRA) framework
We conducted CRA analysis to quantify deaths attributable to high sodium intake between 1998 and 2016. Details of the CRA method have been described previously [14]. Briefly, we applied the following inputs to the CRA framework: 1) the present exposure distribution, 2) the relative risks of risk factors in relation to CVD, 3) the number of deaths attributed to CVD, and 4) the counterfactual exposure distribution.
Study population and dietary sodium intake
To determine the current exposure level in terms of sodium intake, we used data from the KNHANES that is being conducted by the Korea Centers for Disease Control and Prevention since 1998. KNHANES is a large-scale, cross-sectional survey of the Korean civilian population, which comprises detailed health examinations, health interviews, and nutrition surveys [15]. For the current analysis, 7 KNHANES datasets (1998−2016) were used. The participants completed an interviewer-assisted 24-h recall. Daily sodium intake was measured from the reported foods using the Food Composition Table developed by the National Rural Resources Development Institute (ninth revision). Unadjusted and adjusted sodium intake was used for the analysis, with the latter adjusted for total energy intake using the residual method. We included participants aged ≥ 25 years who provided information on dietary sodium intake (n = 71,091) and/or a fasting urine sample (n = 33,271). Participants were excluded from the study if they were determined as outliers for sodium intake, defined as ≥ 3 standard deviations away from the mean. We also excluded participants who have implausible data on daily energy intake (< 500 kcal or > 5,000 kcal) or rice consumption frequency (less than once per day), given that participants who consumed rice less than once a day on a regular basis is not common as rice is a staple food in Korea. Rice consumption frequency was calculated as the sum of the intake frequency of the all forms of rice (such as steamed rice, steamed rice with barley, bibimbab, gimbab, and curry rice) using the Food Frequency Questionnaire with 9–10 frequency scales (ranging from “almost never” to “3 times or more a day”). Following exclusion, data from 68,578 individuals for sodium intake and 33,113 for urinary sodium excretion were available for subsequent analyses (Fig. 1). For CRA analysis, these participants were categorized into 10 sex- and age-specific groups for men and women: 25–34, 35–44, 45–54, 55–64, and ≥ 65 years. The survey and data were reviewed by the Institutional Review Board of the Korea Centers for Disease Control and Prevention and were approved by the Ethics Committee of the Korea Centers for Disease Control and Prevention (2007-02CON-04-P, 2008-04EXP-01-C, 2009-01COM-03-2C, 2010-02CON-21-C, 2011-02CON-06-C, 2012-01EXP-01-2C, 2013-07CON-03-4C, and 2013-12EXP-03-5C).
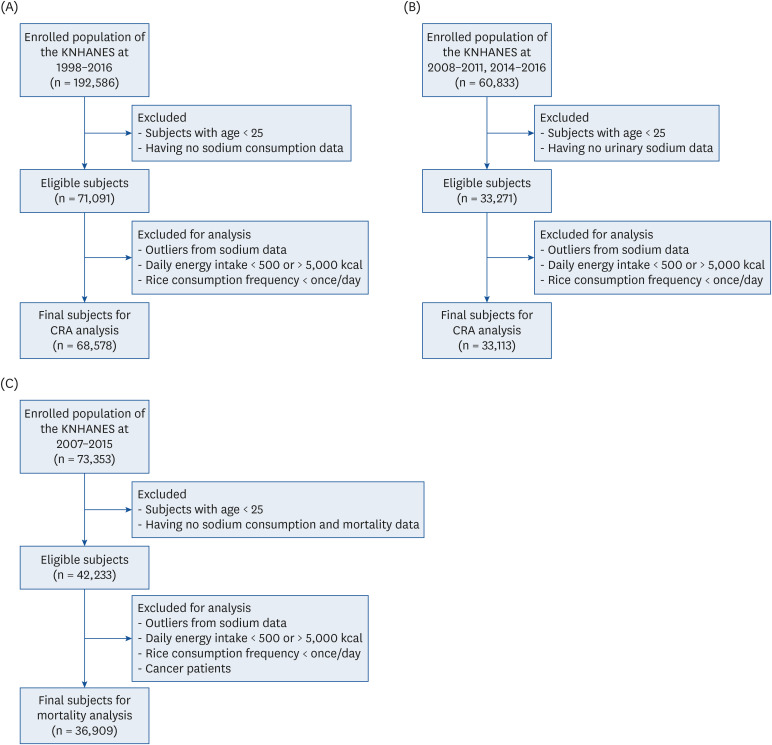
Fig. 1
Flow chart of study subject selection for the CRA analysis and mortality association analysis. The number of study participants were represented as a range because there were differences in survey questionnaire and number of participants every year. (A) Flow chart for CRA analysis about dietary sodium intake. (B) Flow chart for CRA analysis about urinary sodium excretion. Urinary sodium excretion was only available in 2008–2011 and 2014–2016. (C) Flow chart for mortality association analysis about dietary sodium intake. Mortality data were available in 2007–2015.
KNHANES, Korea National Health and Nutrition Examination Survey; CRA, comparative risk assessment.
![]()
Exposure distribution for estimated 24-h sodium excretion
We estimated 24-h urinary sodium excretion according to the sodium and creatinine concentrations in spot urine samples collected during the KNHANES. According to the KNHANES protocol, urine samples were collected after an 8-h fast, stored in cold storage at 2°C–8°C, and then transported to a clinical laboratory (Seegene Medical Foundation, Seoul, Korea). Within 24 h, urine laboratory values for sodium and creatinine were calibrated using the Hitachi Automatic Analyzer 7600 (Hitachi High-Technologies, Tokyo, Japan). The 24-h urinary sodium excretion was estimated using the Tanaka formula [16]: estimated 24-h urinary sodium (mmol/day) = 21.9 × [spot urine sodium (mmol/L)/[10 × spot urine creatinine (mg/dL)] × estimated 24-h urinary creatinine (mg)]0.392, where estimated 24-h urinary creatinine was calculated as follows: −2.04 × age (year) + 14.89 × body weight (kg) + 16.14 × height (cm) – 2,244.45.
Relative risk, cause-specific mortality, and optimal sodium intake
The CVDs of interest were hemorrhagic stroke (HSTK), ischemic stroke (ISTK), and ischemic heart disease (IHD). The relative risks associated with sodium intake for each CVD including mediated effects of systolic blood pressure were accessed from a previous disease burden study using the CRA method, which were referenced from systematic reviews and meta-analyses [17]. We obtained data regarding the number of deaths by a specific disease cause from KOSIS. A daily sodium intake of 2,000 mg was defined as an optimal sodium intake that represents the minimum risk of CVD mortality [13].
Statistical analysis
We calculated population attributable fractions (PAFs) as the proportion of avoidable deaths contributed to by an optimal level of sodium intake. The PAFs were derived using the following equation:
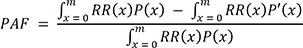
where x is the sodium intake or estimated sodium excretion level; m is the maximum exposure level; P(x) and P′(x) are current and counterfactual distributions of the sodium level, respectively; and RR(x) is the relative risk for CVD associated with sodium intake or estimated sodium excretion level. Finally, the PAFs were multiplied by the number of disease-specific deaths, and its figures were then combined to estimate the total disease burden, represented as CVD-associated mortality attributable to high sodium intake. Additionally, Cuzick's nonparametric trend test was used to assess the trend of temporal changes in sodium intake and the high sodium-attributable fraction of CVD across years [18]. All analyses were performed separately by sex- and age-specific group each year, and the values obtained from analyses by sex or age category were then combined. STATA statistical software, version 13 (StataCorp, College Station, Texas, USA) was used for all statistical analyses.
Mortality association
Data source and study participants
The KNHANES dietary and urinary sodium data were linked to mortality files for examining the association between dietary sodium and all-cause and CVD-associated mortality. The baseline intake data collected between 2007 and 2015 were followed through to December 31, 2016 for mortality by matching death certificates and medical records based on the resident registration number. In the end, data from 73,353 subjects were matched with death records. For the association analysis, we applied the same abovementioned exclusion criteria. Additionally, in line with previous studies [192021], subjects with cancer at baseline were excluded for analyses of all-cause mortality and CVD-associated mortality to prevent reverse causality as cancer patients may drastically change their eating habits after disease diagnosis. Participants with CVD at baseline were also excluded when assessing CVD-associated mortality. Following these exclusions, 36,909 and 35,120 subjects remained for the evaluation of the effect of sodium on all-cause mortality and CVD-associated mortality, respectively (Fig. 1). All participants provided written informed consent to the KNHANES protocol and to link ones' health and nutrition data with KOSIS data.
Dietary sodium intake
As described above, data on sodium intake were collected using a 24-h recall method. The participants were divided into sodium intake quartiles for this analysis.
Mortality
Causes of death in the KOSIS database were coded according to the International Classification of Disease, 10th revision. Unnatural deaths (suicide, accidental deaths, homicide, etc.; V01-Y89) were excluded from all-cause mortality (A00-R99). Deaths specific to CVD were selected by combining the number of deaths coded as I00-I99.
Covariates
Residence was defined as either urban or rural. Education level was classified into 4 groups: elementary school graduate or below, middle school graduate, high school graduate, and university or higher education. Household income was divided by quartiles; lowest, lower middle, upper middle, and highest. Smoking was defined by calculating the pack-year in the past year. Nonsmokers were assigned zero pack-years. Drinking status was defined based on self-reporting to the question: “How often did you drink alcohol in the past 12 months?” The participant was considered a current drinker if he/she had answered “once a month or more.” Those who answered “less than once a month” or “never” were categorized as nondrinkers. Physical activity was expressed in weekly metabolic equivalent of task (MET). Participants reported time spent on activities by the level of intensity, as either light, moderate, or heavy activity. The reported time for each activity was multiplied by the MET values determined for each level of intensity: 2.4 for very light, 5.0 for light moderate, and 7.5 for heavy activities [2223]. The total MET-min per week was computed as the sum of the METs for the 3 intensity levels. Body mass index (BMI) was calculated as the weight divided by the height squared (kg/m2), and then categorized into 3 groups according to the Asian-Pacific criteria for obesity [2425]: lean (< 18.5 kg/m2), normal and overweight (18.5–24.9 kg/m2), and obese (≥ 25 kg/m2). Diabetes was defined as fasting plasma glucose ≥ 126 mg/dL, use of insulin or oral hypoglycemic drugs, or self-reported history of diagnosis [26]. Hypertension was defined as systolic/diastolic blood pressure of ≥ 140/90 mmHg, use of antihypertensive drugs, or self-reported history of diagnosis [27].
Statistical analysis
Cox proportional hazard regression model was used to estimate hazard ratios (HRs) and 95% confidence intervals (CIs) for mortality risk in relation to sodium intake in the diet. The person-year follow-up time was calculated from study entry to the date of death or date of mortality follow-up (December 2016), whichever came first, for each participant. If no record of mortality was available by the end of 2016, the date last considered to be alive was used to calculate the person-year follow-up. Age was used as the underlying time-scale. Stratification analysis was also performed to determine any difference according to sex using the Cox model. All Cox models were controlled for age, sex, residence, education, income, tobacco use, drinking, physical activity, BMI, daily total energy intake, diabetes, and hypertension. STATA statistical software, version 13 (StataCorp) was used for all statistical analyses.
RESULTS
Sodium intake and PAFs trends in Korea
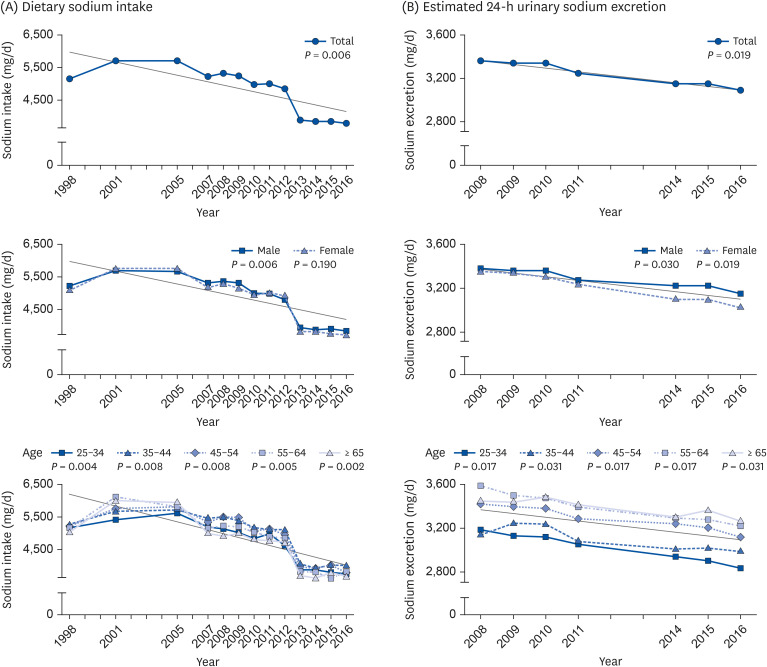
The trend of dietary sodium intake decreased between 1998 and 2016, which peaked in 2001 (mean intake, 5,550 mg/day) and decreased in 2016 (mean intake, 3,647 mg/day; P = 0.006; Fig. 2). During these years, males had consistently higher sodium intake than females (P < 0.001 for all years). Dietary sodium intake also differed between age groups (P < 0.001), with adults ≥ 55 years tending to have higher sodium intakes between 1998 and 2005, but lower sodium intakes from 2007 onward. The estimated 24-h urinary sodium excretion also decreased between 2008 and 2016 (mean intake, 3,359 mg/day in 2008 and 3,082 mg/day in 2016; P = 0.019), which was significant for both males and females (P = 0.030 and 0.019, respectively). In contrast to sodium intake, the estimated 24-h urinary sodium excretion was lower in younger adults (age, 25–44 years) throughout the study period.
Regardless of sex and age, the PAFs of sodium intake decreased, reaching a mean of 17.4% and 12.5% for HSTK and IHD, respectively, in 2016 (P = 0.003 for both; Fig. 3). The PAFs by estimated 24-h urinary sodium excretion also decreased for both outcomes (P = 0.017) reaching 5.2% and 3.7% for HSTK and IHD, respectively, in 2016 (Fig. 4). The total number of cases of CVD-associated mortality attributable to sodium intake increased from 6,806 in 1998 to 12,165 in 2005, but then steadily decreased to 5,435 in 2016 (Table 1 and Fig. 5). No difference was found between males and females. The number of cases of CVD-associated mortality attributable to dietary sodium intake followed a pattern of increase with age and decrease with time (Table 1). Similar trends were found when using 24-h urinary sodium excretion. Deaths associated with HSTK, ISTK, and IHD due to high sodium intake decreased in proportion to the decrease in the total number of cases of CVD-associated deaths due to high sodium intake between 2005 and 2016 or due to high sodium excretion between 2008 and 2016 (Fig. 5).
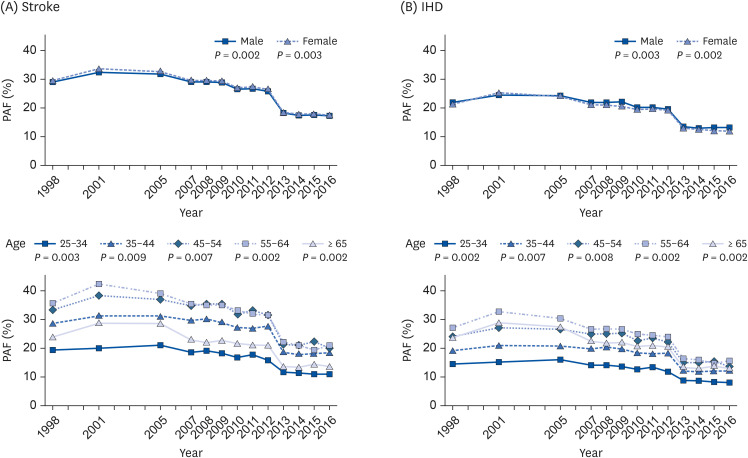
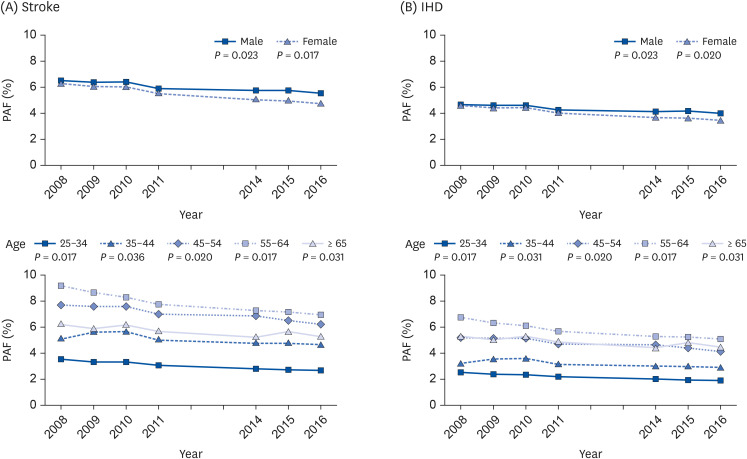
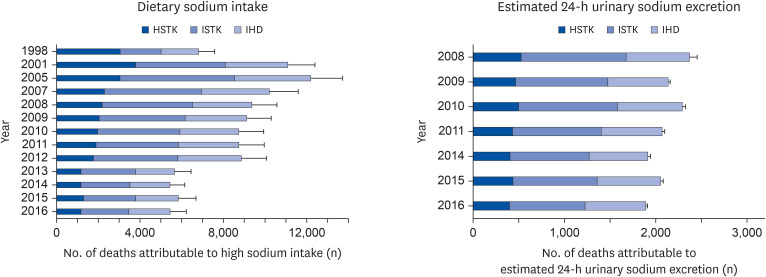
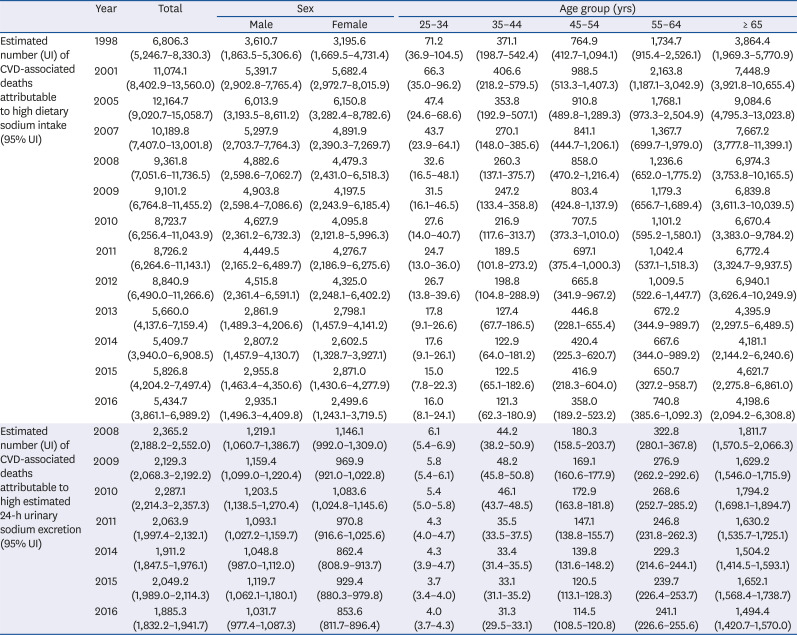
Fig. 3
PAFs of (A) stroke and (B) IHD by high sodium intake between 1998 and 2016 according to sex and age.
PAF, population attributable fraction; IHD, ischemic heart disease; P, P for trend.
![]()
Fig. 4
PAFs of (A) stroke and (B) IHD by high levels of estimated 24-h urinary sodium excretion between 2008 and 2016 according to sex and age.
PAF, population attributable fraction; IHD, ischemic heart disease; P, P for trend.
![]()
Fig. 5
Estimated number of deaths due to high sodium intake or excretion by disease and year.
HSTK, hemorrhagic stroke; IHD, ischemic heart disease; ISTK, ischemic stroke.
![]()
Table 1
CVD-associated deaths attributable to high sodium intake and high estimated sodium excretion by sex, age, and year
The values were expressed as population attributable deaths for each risk factor. CVD-associated deaths were defined as deaths associated with hemorrhagic stroke, ischemic stroke, or ischemic heart disease.
UI, Uncertainty Intervals; CVD, cardiovascular disease.
![]()
General characteristics of study population according to dietary sodium intake
Table 2 shows the characteristics of the study population according to dietary sodium intake quartiles (Q1–Q4). Among the participants, 40% were males, the mean age was 52.1 ± 0.1 years, and the mean sodium intake at baseline (2007–2015) was 4,628 ± 12 mg/day. Subjects with higher sodium intake were more likely to be male, younger, have higher levels of education and household income; were physically active and smokers; and consumed alcohol (all P < 0.001). Subjects in Q4 had a lower systolic blood pressure than those in Q1 (P = 0.002).
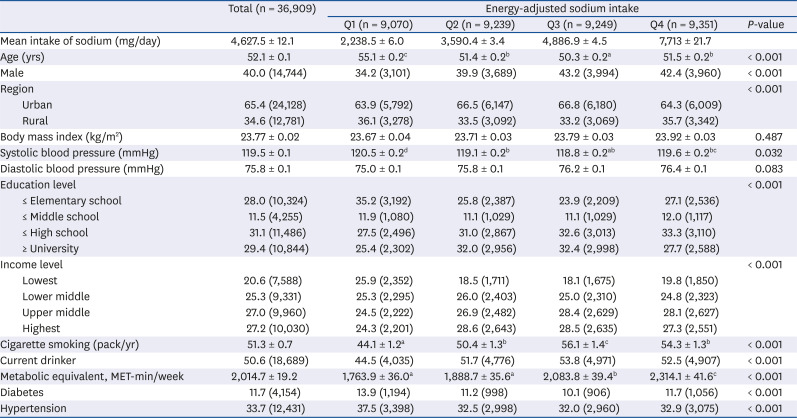
Table 2
Baseline characteristics of the study population for association between sodium level and mortality
Data are represented as mean ± standard error for continuous variables or as percentages for categorical variables. Differences among sodium intake quartiles were determined using analysis of variance and χ2 tests. Different alphabets indicate they are significantly different from each other.
![]()
The association of sodium intake with mortality
Regarding the association between dietary sodium intake and mortality in KNHANES, the mean duration of follow-up for mortality was 5.4 years. A total of 1,339 deaths from all diseases and 237 deaths from CVD were obtained. When the participants were allocated by energy-adjusted sodium intake quartiles, Q1 consumed up to 3,015 mg/day (mean, 2,239 mg/day; Fig. 6), which exceeded the recommended intakes (range, 2,000–2,300 mg/day) by the WHO [7], International Organization for Migration [28], and the Ministry of Health and Welfare of the Republic of Korea [6]. The mean sodium intake for Q2 was 3,590 mg/day (range, 3,015–4,182 mg/day), for Q3 was 4,887 mg/day (range, 4,182–5,709 mg/day), and for Q4 was 7,713 mg/day (≥ 5,709 mg/day). The HR for all-cause mortality was lower in participants in Q2 than in the entire population (Fig. 6). When stratified by sex, men in Q2 had a 21% lower risk of all-cause mortality than those in Q1 (P < 0.05). When sodium intake was not adjusted for energy intake, men in Q3 had a 19% lower risk for all-cause mortality than those in Q1 (Supplementary Table 1). No association was found in women for all-cause mortality regardless of adjustment for energy intake. Although there was no significant association between sodium intakes and risk of CVD-associated mortality in the total population, a J-shaped association was observed (Fig. 7 and Supplementary Table 1). When stratified by sex, no association was observed in men, but the HR in women increased with higher energy-adjusted sodium intake (HR, 1.67; 95% CI, 1.02–2.74, P < 0.05). No association was found between CVD-associated mortality and dietary sodium intake in a subanalysis of adults aged ≥ 40 years (Supplementary Table 2). No association was detected between mortality and estimated 24-h urinary sodium excretion quartiles (data not shown).
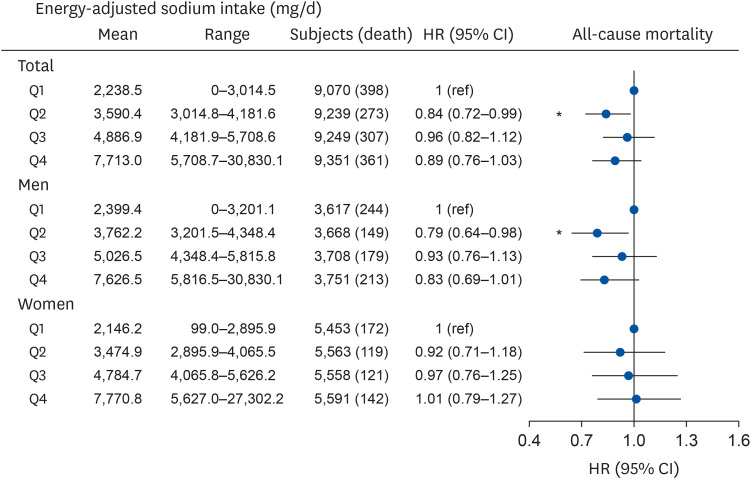
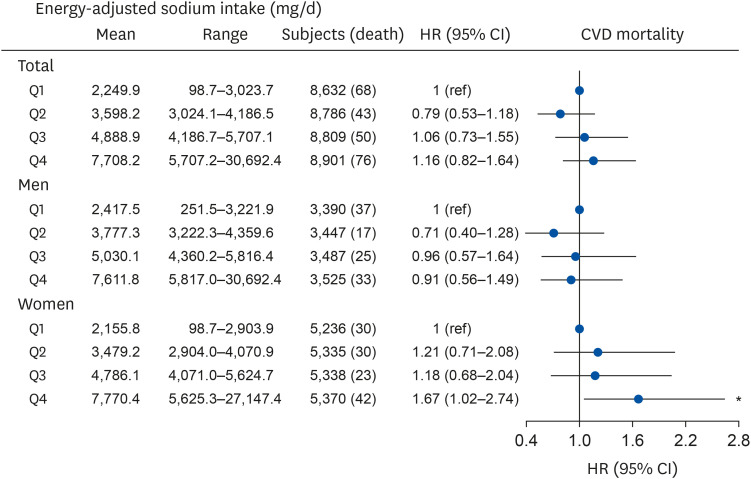
Fig. 6
HRs for all-cause mortality according to the quartile of energy-adjusted sodium intake. HRs were obtained by Cox regression analysis controlled for age, sex, region, education, income, tobacco use, alcohol use, physical activity, body mass index, total energy intake, presence of diabetes or hypertension at baseline.
CI, confidence interval; HR, hazard ratio; Q, quartiles.
*P < 0.05.
![]()
Fig. 7
HRs for CVD-associated mortality according to the quartile of energy-adjusted sodium intake. HRs were obtained with Cox regression analysis controlled for age, sex, region, education, income, tobacco use, alcohol use, physical activity, body mass index, total energy intake, presence of diabetes or hypertension at baseline.
CI, confidence interval; CVD, cardiovascular disease; HR, hazard ratio; Q, quartiles.
*P < 0.05.
![]()
DISCUSSION
Using national data, we observed a decrease in sodium intake and a corresponding decrease in PAF for stroke and IHD attributable to high sodium intake during the last two decades in Koreans aged ≥ 25 years. The risk of all-cause mortality was lowest in those with 3,000–4,200 mg/day of energy-adjusted sodium intake. In addition, the risk of CVD-associated mortality was higher only in females with energy-standardized sodium intakes of 5,625–27,147 mg/day in the Korean population.
The continuous declines in dietary sodium intake and CVD burden attributable to high sodium intake indicate that the efforts of the Ministry of Food and Drug Safety (MFDS) of Korea to reduce sodium intake have been effective. As sodium intake has decreased in recent decades, the Korean population has reached the 2017 target sodium intake (< 3,900 mg/day) 4 years in advance. Our report on sodium intakes in 2016 indicate that Koreans may reach the 2020 goal (< 3,500 mg/day) in time [29]. According to KNHANES, a decrease in blood pressure appears to be highly associated with the decrease in dietary sodium intake during the last decade at the population level [30]. These results are most likely attributable to nationwide programs conducted for lowering dietary sodium in the Korean population. The MFDS has provided technical support to food manufacturers, restaurants, and foodservices to decrease sodium content in foods, in addition to promoting several nutrition education programs for the community and individuals [29]. The socioeconomic benefit of decreasing daily sodium intake from 4,900 mg (the mean intake of Koreans in 2009) to 3,000 mg has been estimated to be 12.6 trillion Korean Won (≤ 1.1 billion US dollars) due to reduced morbidity, mortality, and related expenses [31]. Collectively, the decreased sodium intake and corresponding decrease in PAFs attributable to high sodium intake, as shown in the present study, indicate the success of national efforts to decrease sodium intake.
In the present study, we subsequently assessed whether a high sodium intake was associated with the all-cause and CVD-associated mortality in the general Korean population. It is generally known that dietary sodium is associated with morbidity and mortality of chronic diseases, predominantly mediated by its effect on blood pressure [32]. Whether high blood pressure can be directly translated to higher risk of CVD-associated mortality is controversial. An inverse association between sodium intake and (all-cause and CVD-associated) mortality has been subsequently reported from data of NHANES I, II, and III [333435]. These results indicate a possible negative effect of low sodium intake (< 2,300 mg/day). In more recent prospective cohort studies, a J-shaped curve was identified between urinary sodium excretion and cardiovascular events from the Ongoing Telmisartan alone and in combination with Ramipril Global Endpoint Trial (ONTARGET) and Telmisartan Randomised Assessment Study in ACE Intolerant Subjects With Cardiovascular Disease (TRANSCEND) trials [21]. The Prospective Urban Rural Epidemiology (PURE) study, of which 42% of the study population was Chinese, also found that an estimated sodium excretion between 3,000 and 6,000 mg/day led to the lowest risk of death and cardiovascular events [36]. When pooling 4 studies (ONTARGET, TRANSCEND, PURE, and EPIDREAM), a positive linear association was found between sodium intake and blood pressure; however, this did not lead to a linear association with CVD [11]. Rather, a U-shaped curve between sodium excretion and CVD persisted in hypertensive participants, whereas a negative association was found in subjects without CVD [11]. The nadir of the U-shaped curve was between 4,000 and 5,000 mg/day of urinary sodium excretion. Our observation in Koreans is consistent with these previous results, in which energy-adjusted sodium intakes between 3,014 and 4,182 mg/day led to lower HR values for all-cause mortality than sodium intake of < 3,014 mg/day. The mean sodium intake of Koreans in 2016 (3,647 mg/day) is within this range, raising the question as to whether further reductions in sodium intake are required at the population level. In addition, previous studies observe an increased risk in mortality with high sodium intake or excretion, but only when sodium excretion was > 6,500 mg/day. We identified a higher risk of CVD-associated mortality when energy-adjusted sodium intake was > 5,625 mg/day in women. In contrast to our results and those of others, the American Heart Association recommends a sodium intake of ≤ 2,300 mg/day, with an ideal intake of ≤ 1,500 mg/day [37]. Few countries meet this recommendation or those suggested in the WHO guidelines (≤ 2,000 mg/day), and countries with sodium intakes close to the WHO guidelines (≤ 2,000 mg/day) have predominantly been developing countries with concerns for malnutrition [8]. Therefore, the balance of intake of sodium and other nutrients must also be considered when establishing nutrition guidelines. In addition, very low sodium intake can alter homeostasis and induce renin activity, which is known to be a risk factor for CVD [38]. Although reducing sodium intake can lower blood pressure in the short term, as observed in randomized clinical trials, these results are considered to be difficult to apply to the free-living population as individuals have a physiological set point and sodium appetite. Recent scientific evidence must be incorporated when establishing the recommendations for sodium intake for Koreans.
Of interest is the finding that, despite the lower sodium intake in adults aged ≥ 65 years, the estimated 24-h urinary sodium excretion was highest in this population, suggesting a possible physiological effect of aging on sodium balance. The equation developed by Tanaka et al. [16], which was used to estimate 24-h urinary sodium excretion in our subjects, was developed from the analysis of samples of Japanese adults aged between 20 and 59 years. Therefore, the equation may not capture the physiology of adults aged ≥ 60 years. Other equations developed in Whites have been reported to have weaker correlations with Asians [17]. With lower sodium intake and higher urinary sodium excretion, sodium retention may be lower in this age group. Although the PAF of sodium tends to increase with age, the attribution of sodium to CVD-associated mortality in adults ≥ 65 years old appears to be similar to, or lower than, the mean of the total population. In addition, although sodium sensitivity is known to increase with age [39], this did not translate to increased mortality risk in our population, possibly due to the increased excretion of urinary sodium. The lack of relative consistency between dietary sodium intake and estimated 24-h urinary sodium excretion among age groups also indicates that caution is required when using the latter as a surrogate for sodium intake in Korean adult populations with a wide range of ages. As the influence of sodium may differ between older and younger adults, recommendations for sodium intake should be determined according to age.
There are a number of limitations to the present study. Precise recall of sodium intake is difficult, as sodium content among similar dishes differs according to the method of preparation. Although we utilized urinary sodium excretion to indirectly calculate sodium intake, the urine samples available from KNHANES were fasting spot urine collections, which have a higher degree of measurement error than 24-h urine collections. In addition, the calculation used to estimate 24-h urinary sodium was not verified for adults aged ≥ 60 years. We were not able to exclude those with other underlying diseases or familial history that would motivate the individual to decrease sodium due to increased risk of mortality. On the other hand, the large sample size, prospective nature, and the inclusion of only individuals without cancer or prior CVD events are strengths of the present study, as long-term randomized controlled trials require extensive resources. The present study is the first to combine national dietary and mortality data to understand the association between sodium intake and risk of mortality in the Korean population. Our results are distinct in that it was possible to monitor a trend in disease burden due to high sodium intake during nutrition transition in a Korean population.
In conclusion, sodium intake, PAFs of CVD, and the number of deaths attributable to inappropriate dietary sodium intake have decreased over the last few decades in the Korean population. The association between sodium intake and mortality risk is contrary to the current recommendations, where those with intakes of < 2,500 mg/day have higher risk of mortality. These results indicate that the optimal sodium intake for Koreans may differ by age and may be higher than the current recommendations.
 XML Download