Journal List > Korean J Community Nutr > v.25(1) > 1143482

Lee, Choi, Hyun, Lyu, Park, Ro, and Heo: Analysis of Dietary Calcium and Phosphorus Intakes and Contribution Rates of Major Dish Groups according to Gender, Age, and Region in Korea

Abstract

Objectives

Calcium (Ca) is an insufficiently consumed nutrient, whereas phosphorus (P) intake has exceeded the recommended intake level in Korea over the past decade. The purpose of this study was to analyze dietary Ca and P intakes and their contribution rate according to dish groups.

Methods

A 24-hour dietary recall survey of 640 healthy adults (aged 19–69 years) was undertaken twice in four Korean provinces. Dietary Ca and P intakes and their rates of contribution from 31 major dish groups were analyzed and compared by gender, age group, and region.

Results

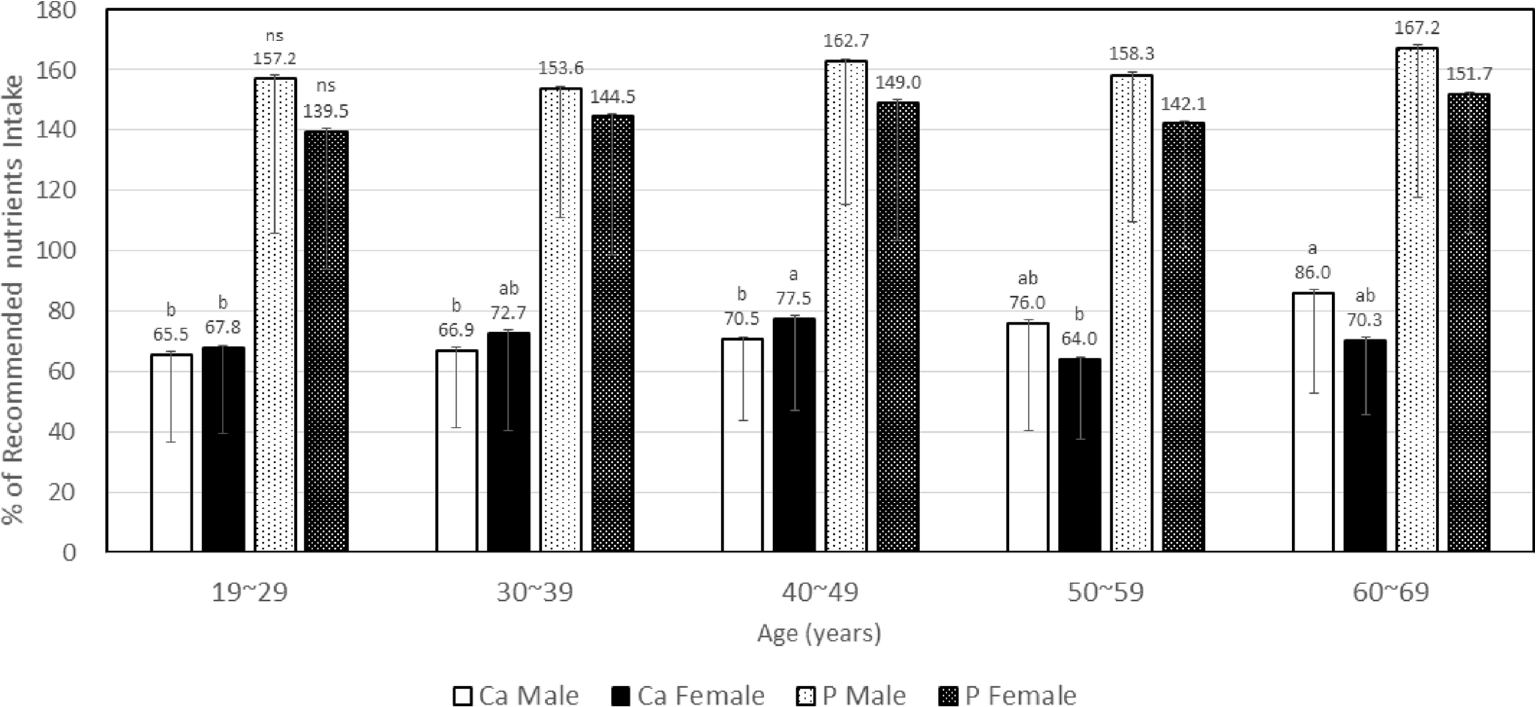
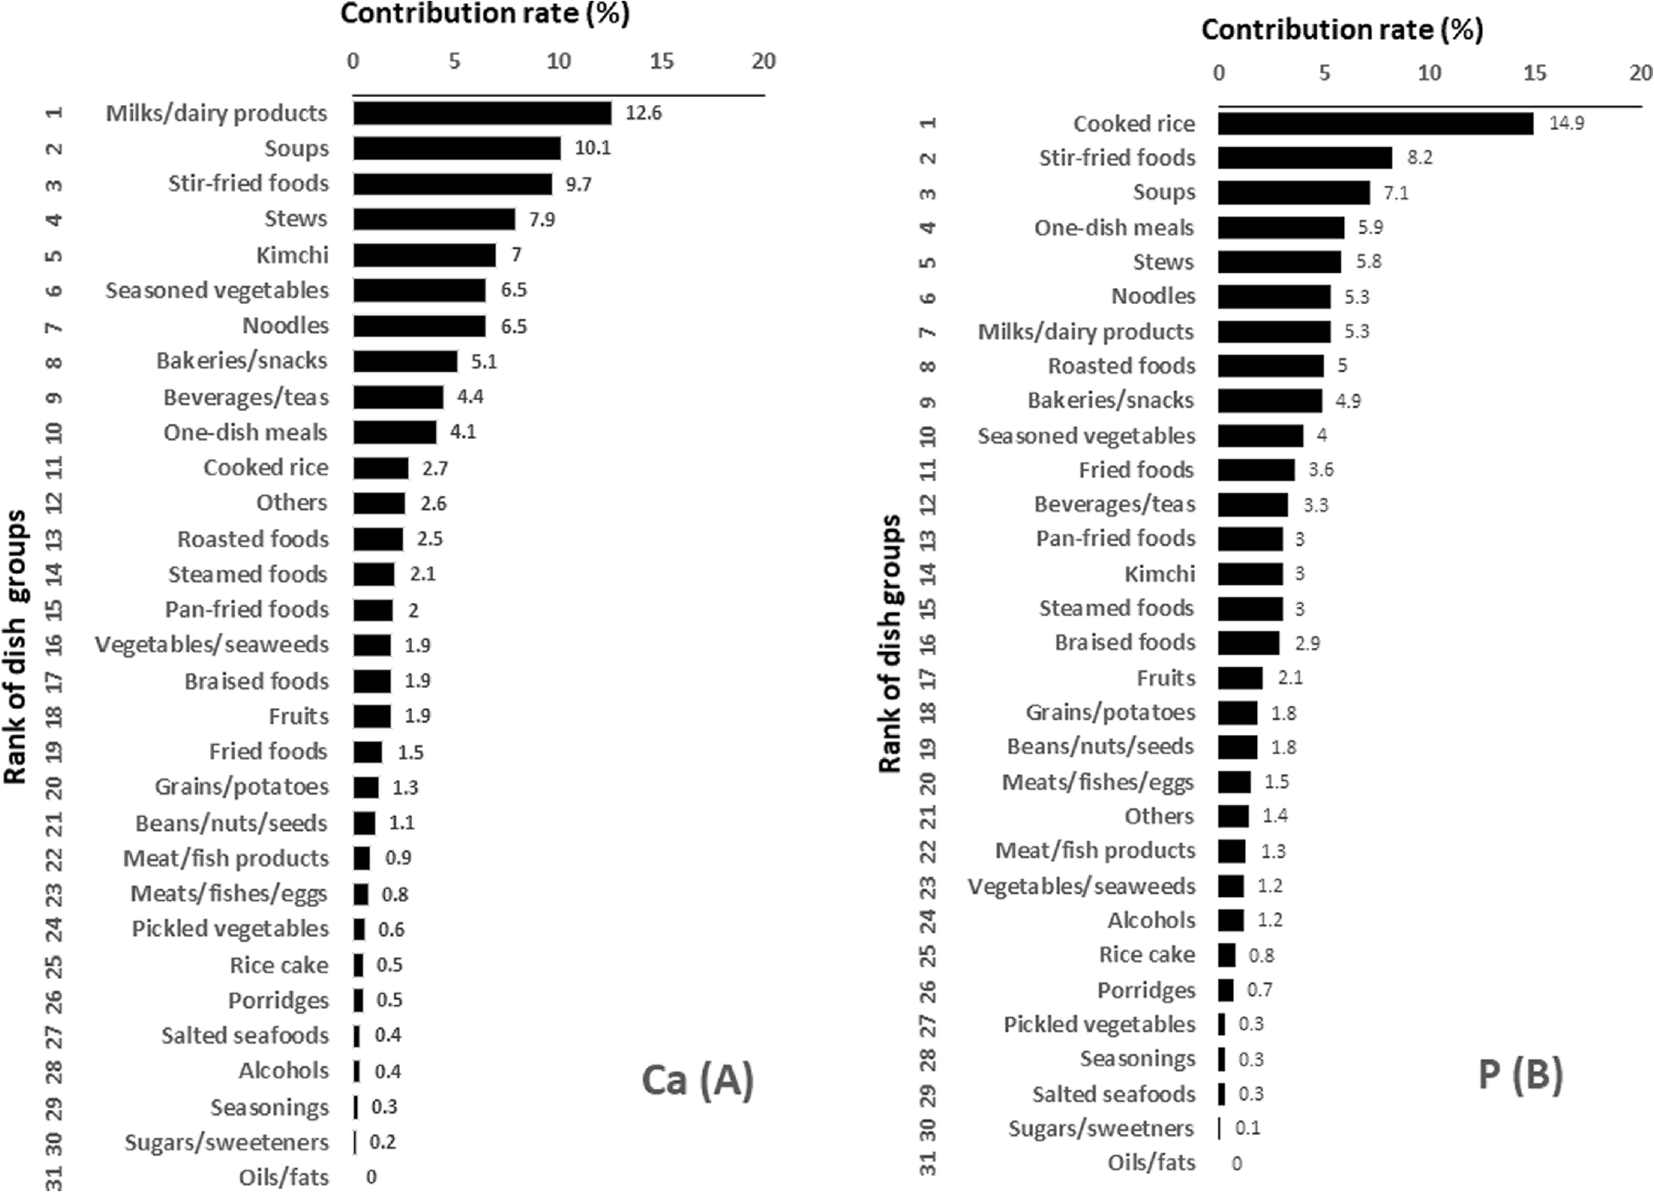
The average Ca and P intakes of the subjects were 542.1 ± 222.2 mg/d and 1,068.3 ± 329.0 mg/d, respectively. The intakes of Ca and P as percentages of recommended nutrients intake (RNI%) were 71.7 ± 29.8% and 152.6 ± 47%, respectively, and the percentages under the estimated average requirement were 60.3% for Ca and 3.8% for P. The RNI% of Ca was not significantly different between males and females, but was significantly higher in subjects in the sixties age group than in other age groups and was significantly lower in the Korean capital than in other regions. The RNI% of P did not significantly differ by gender or age groups, but it was significantly higher in the capital than in Gyeong-sang. The five major dish groups contributing to Ca intake (contribution rate) were milks/dairy products 69.2 ± 109.2 mg/d (12.6%), soups 55.6 ± 69.6 mg/d (10.1%), stir-fried foods 53.1 ± 70.7 mg/d (9.7%), stews 43.4 ± 85.4 mg/d (7.9%), and kimchi 38.4 ± 31.8 mg/d (7.0%). The five major dish group contributing to P intake (contribution rate) were cooked rice 160.7 ± 107.1 mg/d (14.9%), stir-fried foods 88.5 ± 89.4 mg/d (8.2%), soups 76.7 ± 85.8 mg/d (7.1%), one-dish meals 63.3 ± 94.4 mg/ d (5.9%), and stews 62.6 ± 89.3 mg/d (5.8%). The dish groups contributing to Ca and P intakes differed somewhat by gender, age group, and region.

Conclusions

Programs to improve the nutritional status of Ca and P intakes should consider the differences in Ca and P contribution rates by dish groups as well as by gender, age group, and region.

References

1. Cashman KD. Calcium intake, calcium bioavailability and bone health. Br J Nutr. 2002; 87(S2):S169–S177.
crossref
2. Flynn A. The role of dietary calcium in bone health. Proc Nutr Soc. 2003; 62(4):851–858.
crossref
3. Matkovic V, Goel PK, Badenhop-Stevens NE, Landoll JD, Li B, Ilich JZ, et al. Calcium supplementation and bone mineral density in females from childhood to young adulthood: a randomized controlled trial. Am J Clin Nutr. 2005; 81(1):175–188.
crossref
4. Movassagh EZ, Vatanparast H. Current evidence on the association of dietary patterns and bone health: A scoping review. Adv Nutr. 2017; 8(1):1–16.
crossref
5. Weaver CM. Nutrition and bone health. Oral Dis. 2017; 23(4):412–415.
crossref
6. Lee YK, Hyun TS, Oh SY, Park HR, Ro HK, Heo YR, et al. Serum calcium is associated with dyslipidemia in a free-living Korean population: a cross sectional study. Trace Elem Electrolytes. 2017; 34(4):159–165.
7. Pannu PK, Calton EK, Soares MJ. Calcium and vitamin D in obesity and related chronic disease. Adv Food Nutr Res. 2016; 77:57–100.
crossref
8. Peterlik M, Cross HS. Vitamin D and calcium insufficiency-related chronic diseases: molecular and cellular pathophysiology. Eur J Clin Nutr. 2009; 63(12):1377–1386.
crossref
9. Chrysant SG, Chrysant GS. Controversy regarding the association of high calcium intake and increased risk for cardiovascular disease. J Clin Hypertens (Greenwich). 2014; 16(8):545–550.
crossref
10. Ministry of Health and Welfare, Korea Center for Disease Control and Prevention. Korea Health Statistics 2017: Korea National Health and Nutrition Examination Survey (KNHANES VII-2). Sejong: Ministry of Health and Welfare;2018.
11. Ministry of Health and Welfare, The Korean Nutrition Society. Dietary reference intake for Koreans 2015. Sejong: Ministry of Health and Welfare;2015. p. 570–637.
12. Calvo MS, Tucker KL. Is phosphorus intake that exceeds dietary requirements a risk factor in bone health? Ann NY Acad Sci. 2013; 1301(1):29–35.
crossref
13. Calvo MS, Uribarri J. Public health impact of dietary phosphorus excess on bone and cardiovascular health in the general population. Am J Clin Nutr. 2013; 98(1):6–15.
crossref
14. Ito S, Ishida H, Uenishi K, Murakami K, Sasaki S. The relationship between habitual dietary phosphorus and calcium intake, and bone mineral density in young Japanese women: a cross-sectional study. Asia Pac J Clin Nutr. 2011; 20(3):411–417.
15. Gutiérrez OM, Luzuriaga-McPherson A, Lin Y, Gilbert LC, Ha SW, Beck GR Jr. Impact of phosphorus-based food additives on bone and mineral metabolism. J Clin Endocrinol Metab. 2015; 100(11):4264–4271.
crossref
16. Lee AW, Cho SS. Association between phosphorus intake and bone health in the NHANES population. Nutr J. 2015; 14(2):28.
crossref
17. Choi YS. Development of research methods for determination of the dietary reference intakes for calcium. Cheongju: Korea Center for Disease Control and Prevention;2012.
18. Jeong HK, Kim JY, Lee HS, Kim JY. The effect of dietary calcium and phosphate levels on calcium and bone metabolism in rats. Korean J Nutr. 1997; 30(7):813–824.
19. Vorland CJ, Stremke ER, Moorthi RN, Hill Gallant KM. Effects of excessive dietary phosphorus intake on bone health. Curr Osteoporos Rep. 2017; 15(5):473–482.
crossref
20. Lee YK. Development of sodium adaptation index based on dietary habits of Korean. Cheongju: National Institute of Food and Drug Safety Evaluation;2016.
21. Ministry of Health and Welfare, Korea Center for Disease Control and Prevention. Korea Health Statistics 2012: Korea National Health and Nutrition Examination Survey (KNHANES V). Sejong: Ministry of Health and Welfare;2013.
22. Bristow SM, Gamble GD, Stewart A, Horne L, House ME, Aati O, et al. Acute and 3-month effects of microcrystalline hydroxyapatite, calcium citrate and calcium carbonate on serum calcium and markers of bone turnover: a randomised controlled trial in postmenopausal women. Br J Nutr. 2014; 112(10):1611–1620.
crossref
23. Lau EM, Woo J, Lam V, Hong A. Milk supplementation of the diet of postmenopausal Chinese women on a low calcium intake retards bone loss. J Bone Miner Res. 2001; 16(9):1704–1709.
crossref
24. Kim JY, Ahn BI. Effect of consumer's dietary lifestyle on consumption pattern of processed foods. Korean J Food Market Econ. 2015; 32(1):31–53.
25. Host A, McMahon AT, Walton K, Charlton K. Factors influencing food choice for independently living older people: A systematic literature review. J Nutr Gerontol Geriatr. 2016; 35(2):67–94.
26. Pechey R, Monsivais P. Socioeconomic inequalities in the healthiness of food choices: Exploring the contributions of food expenditures. Prev Med. 2016; 88:203–209.
crossref
27. Kim OY, Kwak SY, Kim B, Kim YS, Kim HY, Shin MJ. Selected food consumption mediates the association between education level and metabolic syndrome in Korean adults. Ann Nutr Metab. 2017; 70(2):122–131.
crossref
28. Shin BR, Choi YK, Kim HN, Song SW. High dietary calcium intake and a lack of dairy consumption are associated with metabolic syndrome in obese males: the Korean National Health and Nutrition Examination Survey 2010 to 2012. Nutr Res. 2016; 36(6):518–525.
crossref
29. Ministry of Health and Welfare, Office for Healthcare Policy. Korea Health Statistics 2015: Korea National Health and Nutrition Examination Survey (KNHANES VI-3). Sejong: Ministry of Health and Welfare;2016.
30. Calvo MS, Lamberg-Allardt CJ. Phosphorus. Adv Nutr. 2015; 6(6):860–862.
crossref
31. Takeda E, Yamamoto H, Yamanaka-Okumura H, Taketani Y. Increasing dietary phosphorus intake from food additives: potential for negative impact on bone health. Adv Nutr. 2014; 5(1):92–97.
crossref
32. Lou-Arnal LM, Arnaudas-Casanova L, Caverni-Muñoz A, Vercet-Tormo A, Caramelo-Gutiérrez R, Munguía-Navarro P, et al. Hidden sources of phosphorus: presence of phosphorus-containing additives in processed foods. Nefrologia. 2014; 34(4):498–506.
33. Shimada M, Shutto-Uchita Y, Yamabe H. Lack of awareness of dietary sources of phosphorus is a clinical concern. In Vivo. 2019; 33(1):11–16.
crossref
34. Korea Rural Economic Institute. The consumer behavior survey for food 2018. Naju: Korea Rural Economic Institute;2018.
35. Adatorwovor R, Roggenkamp K, Anderson JJ. Intakes of calcium and phosphorus and calculated calcium-to-phosphorus ratios of older adults: NHANES 2005–2006 data. Nutrients. 2015; 7(11):9633–9639.
crossref

Fig. 1.
Recommended nutrients intake (%) of Ca and P intake by gender and age groups The results were analyzed by ANOVA and bar with the different superscripts in age group within gender are significantly different by Duncan's multiple range test.
kjcn-25-32f1.tif
Fig. 2.
Contribution rate for Ca (left plot A) and P (right plot B) intake of the all subject by dish groups (n = 640)
kjcn-25-32f2.tif
Table 1.
Calcium and phosphorous intake of the subjects by gender, age and region
  All (n = 640) Gender P-value1) Age (years)
Male (n = 320) Female (n = 320) 19∼29 (n = 128) 30∼39 (n = 128) 40∼49 (n = 128)
Calcium Intake (mg/d) 1,542.1 ± 222.3 1,564.0 ± 233.5 1,520.1 ± 208.3 0.012 1,500.1 ± 218.9b 1,520.1 ± 212.6b 1,555.7 ± 205.6ab
RNI (%) 1,871.7 ± 929.8 1,872.9 ± 931.0 1,870.5 ± 928.5 0.316 1,866.8 ± 928.9b 1,869.5 ± 928.8b 1,874.3 ± 928.0ab
<EAR 386 (60.3) 202 (63.1) 184 (57.5) 0.225 88 (68.8) 84 (65.6) 69 (51.6)
Phosphorus Intake (mg/d) 1,068.3 ± 329.0 1,118.9 ± 335.6 1,017.5 ± 314.7 0.000 1,041.2 ± 347.7b 1,042.7 ± 309.0b 1,091.7 ± 318.8bb
RNI3) (%) 1,152.6 ± 947.0 1,159.8 ± 947.9 1,145.4 ± 945.0 0.000 1,148.7 ± 949.7b 1,149.0 ± 944.1b 1,156.0 ± 945.5bb
<EAR3) 924 (93.8) 911 (93.4) 913 (94.1) 0.554 11 (98.6) 93 (92.3) 94 (93.1)
Calcium: Phosphorus ratio
Ca: P 1,882.1 ± 990.6 1,892.2 ± 990.6 1,892.1 ± 990.6 0.421 1,892.3 ± 990.7a 1,892.2 ± 990.7a 1,892.1 ± 990.6ab

Mean ± SD or n (%) 1) Gender comparison was analyzed by Student's t-test or χ

2 test. 2) The results were analyzed by ANOVA and values with the different superscripts in age and region are significantly different by Duncan's multiple range test or χ

2 test. 3) RNI: Recommended nutrients intake; EAR: Estimated average requirement.

Table 1.
continued
Region
50∼59 60∼69 P-value2) Capital Chung-cheong Gyeong-sang Jeolla P-value2)
(n = 128) (n = 128)   (n = 160) (n = 160) (n = 160) (n = 160)  
1,542.0 ± 243.2b 1,592.5 ± 220.9a 0.011 1,497.1 ± 206.6b 1,554.6 ± 206.2a 1,564.3 ± 226.8a 1,552.4 ± 243.0a 0.029
1,970.2 ± 831.9b 1,977.7 ± 830.3a 0.028 1,965.7 ± 827.6b 1,973.8 ±8 27.6a 1,974.7 ± 830.4a 1,973.3 ± 832.8a 0.027
84 (65.6) 64 (50.0) 0.007 105 (65.6) 90 (56.3) 94 (58.8) 97 (60.6) 0.402
1,053.0 ± 328.5 1,112.4 ± 338.6 0.302 1,001.1 ± 285.2c 1,096.4 ± 334.7ab 1,130.9 ± 365.7a 1,080.9 ± 555.6bc 0.002
1,150.4 ± 846.9 1,158.9 ± 848.3 0.302 1,143.0 ± 840.7c 1,157.2 ± 848.0ab 1,161.6 ± 852.3a 1,149.2 ± 844.7bc 0.002
84 (83.1) 82 (81.6) 0.060 886 (83.8) 83 (81.9) 88 (85.0) 87 (84.4) 0.488
1,992.1 ± 880.6ab 1,992.0 ± 880.6b 0.017 1,992.2 ±88 0.7 1,992.1 ± 880.6 1,992.2 ± 880.7 1,992.1 ± 880.6 0.233
Table 2.
Dietary calcium intake from major dish groups by gender, age and region
  All (n = 640) Gender P-value 1) Age (years)
Male Female 19∼29 30∼39 40∼49
(n = 320) (n = 320) (n = 128) (n = 128) (n = 128)
Milks/dairy products 69.2 ± 109.2 61.8 ± 112 76.5 ± 106.1 0.090 85.0 ± 131.6 77.9 ± 123.8 59.2 ± 78.9
Soups 55.6 ± 969.6 65.5 ± 975.0∗ 45.7 ± 962.3 0.001 33.7 ± 944.4d 42.5 ± 951.4cd 63.1 ± 62.4b
Stir-fired foods 53.1 ± 970.7 55.9 ± 977.8 50.3 ± 962.8 0.317 43.8 ± 952.8 49.7 ± 950.5 60.2 ± 77.5
Stews 43.4 ± 985.4 53.8 ± 101.4∗ 33.1 ± 964.1 0.002 27.4 ± 959.4b 33.4 ± 963.8b 40.6 ± 84.7b
Kimchis 38.4 ±9 31.8 42.9 ± 933.4∗ 33.9 ±9 29.6 0.001 23.0 ±9 24.5c 29.9 ± 923.7c 42.3 ± 32.1b
Seasoned vegetables 35.6 ± 946.0 38.8 ±9 51.7 32.4 ± 939.3 0.078 24.5 ±9 42.9b 30.7 ± 940.8b 30.1 ± 33.7b
Noodles 35.5 ± 958.8 42.4 ± 964.6∗ 28.6 ±9 51.5 0.003 58.3 ± 978.1a 43.9 ± 963.2b 31.9 ± 50.9bc
Bakeries/snacks 28.1 ±9 58.4 27.1 ± 958.3 29.1 ± 958.5 0.658 43.5 ± 976.2a 49.9 ± 977.4a 21.8 ± 54.3b
Beverages/teas 24.0 ± 960.2 18.5 ± 934.2 29.5 ±9 77.6∗ 0.021 26.5 ± 957abc 33.6 ± 100.7a 29.7 ± 56.4ab
One-dish meals 22.7 ±9 37.5 22.4 ± 940.1 22.9 ± 934.7 0.850 37.8 ± 947.1a 25.2 ± 935.9b 23.3 ± 39.7bc
Cooked rice 15.0 ±9 16.0 14.9 ± 913.3 15.1 ± 918.3 0.856 98.4 ± 996.8c 10.6 ± 910.4c 14.6 ± 13.7b
Others 14.1 ± 200.2 95.0 ± 952.6 23.1 ± 9278.1 0.253 91.5 ± 996.8 40.0 ± 433.1 99.3 ± 55.8
Roasted foods 13.8 ± 930.1 14.3 ± 926.4 13.2 ± 933.5 0.643 16.3 ±9 44.8 10.5 ± 922.4 12.8 ± 22.5
Steamed foods 11.8 ±9 29.6 12.6 ±927.7 10.9 ± 931.3 0.474 98.4 ± 921.8b 96.8 ±9 18.2b 18.0 ± 41.4a
Pan-fried foods 10.9 ± 919.0 11.1 ±9 17.8 10.6 ±9 20.2 0.759 10.7 ± 920.6 99.5 ±9 15.0 12.2 ± 19.1
Vegetables/seaweeds 10.6 ± 920.1 99.7 ± 920.2 11.4 ± 919.9 0.291 94.6 ± 911.8c 97.7 ± 917.2bc 12.2 ± 23.5ab
Braised foods 10.2 ± 918.0 11.5 ± 918.6 98.8 ± 917.2 0.062 96.2 ± 915.2c 98.2 ±9 13.2bc 11.3 ± 18.4ab
Fruits 10.2 ± 913.6 98.9 ±9 12.9 11.4 ±9 14.1∗ 0.021 93.3 ±99 6.5c 95.8 ± 998.1c 10.4 ± 12.6b
Fried foods 98.5 ± 918.0 98.8 ±9 18.6 98.3 ± 917.3 0.757 14.6 ±9 22.4a 11.2 ±9 18.4ab 98.4 ± 15.2bc
Grains/potatoes 97.4 ±9 56.2 98.3 ± 977.8 96.5 ± 916.6 0.683 93.0 ± 915.2 94.9 ± 917.0 94.6 ± 15.4
Beans/nuts/seeds 96.1 ± 915.7 94.6 ± 912.4 97.7 ± 918.3∗ 0.014 92.9 ± 999.4c 93.9 ± 999.7bc 97.7 ± 19.7ab
Meat/fish products 94.7 ±9 28.2 94.2 ±9 19.7 95.2 ± 934.6 0.663 92.6 ± 997.2 92.4 ± 999.3 97.2 ± 46.2
Meats/fishes/eggs 94.4 ±9 18.0 94.7 ± 922.6 94.1 ±9 11.6 0.667 92.3 ± 997.7b 92.3 ± 996.6b 98.8 ± 32.0a
Pickled vegetables 93.2 ± 997.7 92.9 ± 997.4 93.6 ± 997.9 0.238 93.2 ± 999.3 93.1 ± 995.5 92.8 ± 96.4
Rice cakes 92.9 ± 914.6 92.2 ± 913.9 93.5 ± 915.4 0.272 90.6 ±99 1.9 92.9 ± 921.2 92.2 ± 96.6
Porridges 92.9 ±9 11.9 92.9 ±9 12.0 92.8 ± 911.9 0.922 91.2 ± 999.9b 91.1 ± 995.7b 92.5 ± 99.9ab
Salted seafoods 92.3 ± 999.5 92.5 ± 999.4 92.2 ±99 9.6 0.631 90.5 ±99 3.3 93.3 ± 912.6 92.3 ±9 7.5
Alcohols 92.1 ±9 95.5 92.6 ± 996.0∗ 91.6 ± 995.0 0.021 93.0 ± 997.6a 91.7 ±99 3.9ab 93.0 ± 96.0a
Seasonings 91.7 ± 994.2 91.9 ± 994.7 91.5 ±99 3.7 0.265 91.6 ±99 3.6 91.4 ±99 2.8 91.9 ± 94.5
Sugars/sweeteners 90.9 ± 995.7 91.2 ± 997.5 90.6 ± 993.0 0.167 91.8 ±99 6.1 91.2 ± 997.5 91.3 ± 98.3
Oils/fats 90.0 ± 990.1 90.0 ± 990.1 90.0 ± 990.1 0.302 90.0 ±99 0.1 90.0 ± 990.2 90.0 ± 90.1

Mean ± SD 1) Gender comparison was analyzed by Student's t-test. 2) The results were analyzed by ANOVA and values with the different superscripts in age and region are significantly different by Duncan's multiple range test.

Table 2.
continued
  P-value 2) Region P-value 2)
50∼59 60∼69 Capital Chung-cheong Gyeong-sang Jeolla
(n = 128) (n = 128) (n = 160) (n = 160) (n = 160) (n = 160)
58.9 ± 102.0 64.7 ± 101.1 0.205 76.3 ± 125.3 64.6 ± 89.6 78.1 ± 124.5 57.6 ± 991.8 0.280
57.7 ± 966.6bc 81.1 ± 100.2a 0.001 41.5 ± 950.7c 58.7 ± 62.4b 48.3 ±9 54.0bc 74.1 ± 997.2a 0.001
55.5 ± 969.0 56.2 ± 994.2 0.384 50.0 ± 977.4 61.3 ± 72.7 48.4 ±9 59.1 52.7 ± 972.2 0.372
48.6 ± 986.7ab 67.1 ± 116.1a 0.002 27.2 ± 951.1c 51.8 ± 77.7ab 58.4 ± 113.4a 36.4 ± 984.9bc 0.004
44.8 ±9 30.4b 52.3 ± 937.7a 0.001 33.7 ± 922.6b 46.2 ± 38.6a 34.0 ± 926.7b 39.8 ± 935.4ab 0.001
45.3 ± 946.6a 47.4 ± 958.7a 0.001 30.8 ±9 39.8 40.2 ± 54.9 33.3 ±9 39.9 38.1 ± 947.7 0.238
27.3 ± 949.9cd 16.1 ± 933.9d 0.001 35.2 ±9 53.9ab 46.9 ± 67.8a 31.6 ± 952.9b 28.3 ± 958.1b 0.028
15.7 ±9 27.3b 99.7 ± 919.6b 0.001 33.4 ± 955.0 20.4 ± 38.6 25.6 ± 950.5 33.0 ± 980.6 0.138
17.5 ±9 27.7bc 12.6 ± 923.9c 0.030 24.4 ± 946.0 18.9 ± 32.2 27.9 ± 953.0 24.7 ± 992.4 0.611
11.7 ± 929.1d 15.2 ± 927.0cd 0.001 19.6 ± 936.0 18.4 ± 29.9 28.1 ± 940.8 24.6 ± 941.7 0.070
16.3 ± 914.4b 24.9 ± 923.9a 0.001 15.3 ± 915.2 14.4 ± 13.0 14.7 ± 921.4 15.5 ± 912.9 0.935
99.8 ± 957.0 99.7 ± 982.1 0.586 12.8 ±9 89.6 90.8 ± 94.8 98.2 ± 945.9 34.6 ± 387.6 0.472
13.6 ± 923.7 15.7 ± 931.0 0.544 97.3 ± 913.5b 16.9 ± 42.3a 12.5 ±9 24.1ab 18.4 ± 931.9a 0.004
11.4 ± 931.5ab 14.2 ±9 28.3ab 0.018 97.7 ± 920.6b 12.6 ± 31.7ab 16.8 ± 938.8a 99.9 ±9 23.0b 0.037
99.6 ± 917.8 12.2 ± 921.8 0.639 99.6 ± 915.8 13.2 ± 19.9 12.0 ± 921.5 98.6 ± 918.1 0.117
12.0 ± 918.8ab 16.3 ± 924.5a 0.001 97.9 ± 916.9b 99.8 ± 16.1b 17.4 ± 929.5a 97.2 ± 911.7b 0.001
11.7 ±9 17.9ab 13.4 ± 922.9a 0.009 98.6 ± 913.6 10.1 ± 20.5 10.1 ± 916.5 11.8 ± 920.4 0.478
15.1 ±9 15.4a 16.3 ±9 17.2a 0.001 10.2 ± 912.7ab 98.9 ± 12.0b 12.7 ± 915.3a 98.9 ±9 13.8b 0.040
95.6 ± 917.3bc 92.9 ± 913.0c 0.001 98.9 ± 915.5 11.6 ± 23.0 97.1 ± 914.3 96.7 ± 917.5 0.058
16.8 ± 120.5 97.8 ± 922.3 0.290 97.5 ±9 25.4 94.4 ± 13.8 95.0 ± 910.7 12.7 ± 108.2 0.541
97.0 ± 915.0ab 99.1 ± 920.3a 0.006 97.7 ± 917.4ab 93.5 ± 98.9c 99.1 ± 920.7a 94.3 ± 912.5bc 0.003
96.2 ± 929.4 95.0 ± 928.8 0.583 91.4 ±99 5.2b 92.3 ± 15.5b 94.0 ± 918.0b 11.1 ± 950.4a 0.009
95.1 ± 917.4ab 93.7 ±9 12.8b 0.018 92.5 ± 996.9 93.6 ± 12.1 94.5 ± 912.1 97.2 ± 930.7 0.118
93.3 ±99 7.0 93.8 ±99 9.4 0.868 93.1 ± 996.2 93.8 ± 10.0 93.4 ± 996.7 92.7 ± 997.3 0.580
94.8 ±9 22.9 93.8 ± 997.0 0.183 92.6 ±9 19.0 93.2 ±9 6.4 94.0 ±9 20.8 91.6 ± 994.8 0.527
94.0 ±9 12.8ab 95.5 ± 917.5a 0.010 95.7 ±9 16.2a 91.1 ± 97.0b 92.8 ± 911.8b 91.9 ± 910.4b 0.003
92.6 ±9 11.4 92.9 ± 999.8 0.147 91.7 ± 995.5 92.2 ±9 7.7 92.0 ±9 10.6 93.5 ± 912.7 0.356
91.6 ±99 4.4ab 91.1 ± 994.8b 0.012 91.7 ±99 4.8 92.1 ± 94.9 92.0 ± 995.0 92.5 ± 997.1 0.589
92.3 ±99 5.4 91.2 ± 994.2 0.232 91.6 ±99 4.4 91.2 ± 93.6 92.2 ± 995.1 91.8 ± 993.5 0.198
90.0 ±99 0.2 90.1 ± 990.9 0.063 91.2 ± 998.1 91.3 ±9 5.4 90.4 ± 992.1 90.6 ± 995.7 0.435
90.0 ±99 0.0 90.0 ± 990.0 0.553 90.0 ± 990.2 90.0 ±9 0.0 90.0 ± 990.1 90.0 ± 990.0 0.685
Table 3.
Comparison of top 20 dishes contributing for dietary calcium intake by gender, age and region
Rank Gender Age (years)
Male (n = 320) Female (n = 320) 19∼29 (n = 128) 30∼39 (n = 128) 40∼49 (n = 128)
1 Soups 11.61) Milks/dairy 14.3 Milks/dairy 17.0 Milks/dairy 14.0 Soups 11.4
      products   products   products      
2 Milks/dairy 11.01) Stir-fired 9.4 Noodles 11.7 Bakeries/ 9.0 Stir-fired 10.8
  products   foods       snacks   foods  
3 Stir-fired 9.91) Soups 8.6 Stir-fired 8.8 Stir-fired 9.0 Milks/dairy 10.7
  foods       foods   foods   products  
4 Stews 9.51) Kimchi 6.4 Bakeries/snacks 8.7 Noodles 7.9 Kimchi 7.6
5 Kimchi 7.61) Stews 6.2 One-dish 7.6 Soups 7.7 Stews 7.3
          meals          
6 Noodles 7.51) Seasoned 6.1 Soups 6.7 Others 7.2 Noodles 5.7
      vegetables              
7 Seasoned 6.91) Beverages/ 5.5 Stews 5.5 Beverages/ 6.1 Seasoned 5.4
  vegetables   teas       teas   vegetables  
8 Bakeries/ 4.81) Bakeries/ 5.5 Beverages/ 5.3 Stews 6.0 Beverages/ 5.3
  snacks   snacks   teas       teas  
9 One-dish 4.01) Noodles 5.4 Seasoned 4.9 Seasoned 5.5 One-dish 4.2
  meals       vegetables   vegetables   meals  
10 Beverages/ 3.31) Others 4.3 Kimchi 4.6 Kimchi 5.4 Bakeries/ 3.9
  teas               snacks  
11 Cooked 2.61) One-dish 4.3 Roasted 3.3 One-dish 4.5 Steamed 3.2
  rice   meals   foods   meals   foods  
12 Roasted foods 2.51) Cooked rice 2.8 Fried foods 2.9 Fried foods 2.0 Cooked rice 2.6
13 Steamed foods 2.21) Roasted foods 2.5 Pan-fried foods 2.1 Cooked rice 1.9 Roasted foods 2.3
14 Braised 2.01) Fruits 2.1 Cooked 1.7 Roasted 1.9 Pan-fried 2.2
  foods       rice   foods   foods  
15 Pan-fried 2.01) Vegetables/ 2.1 Steamed 1.7 Pan-fried 1.7 Vegetables/ 2.2
  foods   seaweeds   foods   foods   seaweeds  
16 Vegetables/ 1.71) Steamed 2.0 Braised 1.2 Braised 1.5 Braised 2.0
  seaweeds   foods   foods   foods   foods  
17 Fruits 1.61) Pan-fried 2.0 Vegetables/ 0.9 Vegetables/ 1.4 Fruits 1.9
      foods   seaweeds   seaweeds      
18 Fried foods 1.61) Braised foods 1.6 Fruits 0.7 Steamed 1.2 Others 1.7
              foods      
19 Grains/ 1.51) Fried foods 1.6 Picked 0.6 Fruits 1.0 Meats/ 1.6
  potatoes       vegetables       fishes/eggs  
20 Others 0.91) Beans/nuts/ 1.4 Alcohols 0.6 Grains/ 0.9 Fried 1.5
      seeds       potatoes   foods  

1) Values are % of total calcium intake from each dish groups.

Table 3.
continued
Region
50∼59 (n = 128) 60∼69 (n = 128) Capital (n = 160) Chung-cheong (n = 160) Gyeong-sang (n = 160) Jeolla (n = 160)
Milks/dairy products 10.9 Soups 13.7 Milks/dairy products 15.3 Milks/dairy products 11.7 Milks/dairy products 13.8 Soups 12.8
Soups 10.6 Stews 11.3 Stir-fired foods 10.1 Stir-fired foods 11.1 Stews 10.3 Milks/dairy products 9.9
Stir-fired foods 10.2 Milks/dairy products 10.9 Soups 8.3 Soups 10.6 Stir-fired foods 8.6 Stir-fired foods 9.1
Stews 9.0 Stir-fired foods 9.5 Noodles 7.1 Stews 9.3 Soups 8.6 Kimchi 6.9
Seasoned vegetables 8.4 Kimchi 8.8 Kimchi 6.8 Noodles 8.5 Kimchi 6.0 Seasoned vegetables 6.6
Kimchi 8.3 Seasoned vegetables 8.0 Bakeries /snacks 6.7 Kimchi 8.3 Seasoned vegetables 5.9 Stews 6.3
Noodles 5.0 Cooked rice 4.2 Seasoned vegetables 6.2 Seasoned vegetables 7.3 Noodles 5.6 Others 6.0
Beverages/ teas 3.2 Fruits 2.8 Stews 5.5 Bakeries/ snacks 3.7 One-dish meals 5.0 Bakeries/ snacks 5.7
Grains/potatoes 3.1 Vegetables/seaweeds 2.8 Beverages/teas 4.9 Beverages/teas 3.4 Beverages/teas 4.9 Noodles 4.9
Cooked rice 3.0 Noodles 2.7 One-dish meals 3.9 One-dish meals 3.3 Bakeries/snacks 4.5 Beverages/teas 4.3
Bakeries/snacks 2.9 Roasted foods 2.7 Cooked rice 3.1 Roasted foods 3.0 Vegetables/seaweeds 3.1 One-dish meals 4.2
Fruits 2.8 One-dish meals 2.6 Others 2.6 Cooked rice 2.6 Steamed foods 3.0 Roasted foods 3.2
Roasted foods 2.5 Steamed foods 2.4 Fruits 2.1 Pan-fried foods 2.4 Cooked rice 2.6 Cooked rice 2.7
Vegetables/seaweeds 2.2 Braised foods 2.3 Pan-fried foods 1.9 Steamed foods 2.3 Fruits 2.2 Grains/potatoes 2.2
One-dish meals 2.2 Beverages/teas 2.1 Fried foods 1.8 Fried foods 2.1 Roasted foods 2.2 Braised foods 2.0
Braised foods 2.2 Pan-fried foods 2.1 Braised foods 1.7 Braised foods 1.8 Pan-fried foods 2.1 Meat/fish products 1.9
Steamed foods 2.1 Bakeries/snacks 1.6 Vegetables/seaweeds 1.6 Vegetables/seaweeds 1.8 Braised foods 1.8 Steamed foods 1.7
Others 1.8 Others 1.6 Steamed foods 1.5 Fruits 1.6 Beans/nuts/seeds 1.6 Fruits 1.5
Pan-fried foods 1.8 Beans/nuts/seeds 1.5 Beans/nuts/seeds 1.5 Grains/potatoes 0.8 Others 1.5 Pan-fried foods 1.5
Beans/nuts/seeds 1.3 Grains/potatoes 1.3 Grains/potatoes 1.5 Picked vegetables 0.7 Fried foods 1.3 Vegetables/seaweeds 1.2
Table 4.
Dietary phosphorus intake from major dish groups by gender, age and region
  All (n = 640) Gender P-value 1) Age (years)
Male (n = 320) Female (n = 320) 19∼29 (n = 128) 30∼39 (n = 128) 40∼49 (n = 128)
Cooked rice 160.7 ± 107.1 169.3 ± 105.3∗ 152.1 ± 108.3∗ ∗ 0.043 105.0 ± 978.5cb 1 123.6 ± 986.9cbb1 160.8 ± 105.2bb
Stir-fired foods 88.5 ± 989.4 95.2 ± 993.4∗ 81.7 ± 984.8∗ ∗ 0.056 96.7 ±9 91.9ab 90.2 ± 978.0abb 95.4 ±9 91.6ab
Soups 76.7 ±9 85.8 91.7 ±9 96.0∗ 61.7 ± 971.1∗ ∗ 0.001 53.5 ± 968.6cb 66.4 ±9 99.9bcb 83.6 ± 976.7ab
One-dish meals 63.3 ±9 94.4 61.4 ±9 93.8∗ 65.2 ±9 95.2∗ ∗ 0.614 107.0 ± 122.7ab 73.0 ± 996.0bbb 68.8 ± 996.0bb
Stews 62.6 ± 989.3 76.5 ± 101.8∗ 48.7 ± 972.3∗ ∗ 0.001 43.9 ± 971.9cb 52.8 ±9 77.3bcb 56.3 ± 979.7bc
Noodles 57.3 ± 980.7 63.5 ± 983.7∗ 51.1 ± 977.2∗ ∗ 0.051 77.9 ±9 93.4ab 72.7 ±9 87.6abb 52.8 ±9 74.7bb
Milk/dairy products 57.3 ±9 93.8 50.0 ±9 96.2∗ 64.6 ± 990.8∗ ∗ 0.049 68.1 ± 110.6ab 65.5 ± 108.6abb 49.5 ± 970.2ab
Roasted foods 53.5 ±9 85.9 59.9 ±9 84.2∗ 47.1 ± 987.2∗ ∗ 0.060 68.9 ± 122.1ab 47.2 ±9 76.8abb 48.4 ± 970.5ab
Bakeries/snacks 52.3 ±9 87.2 48.2 ±9 83.0∗ 56.4 ±9 91.2∗ ∗ 0.236 77.8 ± 105.0ab 91.6 ± 117.0abb 39.6 ±9 74.4bb
Seasoned vegetables 43.0 ± 954.6 46.6 ± 958.3∗ 39.4 ±9 50.4∗ ∗ 0.093 30.6 ± 949.8bb 42.3 ± 962.3abb 40.5 ± 940.0ab
Fried foods 39.1 ±9 81.0 42.3 ±9 90.6∗ 35.9 ±9 70.2∗ ∗ 0.320 77.8 ± 126.0ab 53.0 ± 987.8bbb 32.8 ±9 57.4cb
Beverages/teas 35.5 ± 973.5 29.9 ±9 53.4∗ 4.01 ±9 88.9∗ ∗ 0.057 31.4 ±9 52.3ab 43.2 ± 105.6abb 47.7 ±9 89.1ab
Pan-fried foods 32.4 ±9 57.9 32.9 ± 951.9∗ 31.9 ±9 63.4∗ ∗ 0.825 31.6 ± 956.9ab 29.6 ±9 47.7abb 35.7 ± 955.5ab
Kimchi 32.1 ± 926.2 37.1 ± 928.2∗ 27.2 ±9 23.2∗ ∗ 0.001 20.7 ± 922.6cb 25.9 ±9 19.7cbb 34.7 ± 925.7bb
Steamed foods 32.0 ±9 71.6 37.1 ±9 84.8∗ 26.8 ± 954.9∗ ∗ 0.071 34.7 ± 993.6ab 19.4 ± 939.6ab 41.9 ± 969.8ab
Braised foods 31.0 ± 954.0 35.2 ±9 56.5∗ 26.8 ±9 51.1∗ ∗ 0.048 18.0 ± 940.2bb 29.3 ± 949.9abb 34.4 ± 958.6ab
Fruits 22.7 ± 934.9 19.9 ±9 36.2∗ 25.6 ±9 33.3∗ ∗ 0.039 6.8 ± 913.2cb 12.1 ±9 15.1cbb 21.4 ±9 24.3bb
Grains/potatoes 19.4 ±9 66.3 16.8 ± 980.0∗ 22.1 ±9 48.8∗ ∗ 0.316 7.6 ± 924.4bb 14.7 ± 938.6bbb 17.7 ± 951.8ab
Beans/nuts/seeds 19.1 ±9 50.4 14.2 ±9 37.8∗ 23.9 ±9 60.0∗ ∗ 0.016 7.9 ± 922.7cb 11.9 ± 927.5bcb 19.1 ± 944.8bc
Meats/fishes/eggs 16.2 ± 960.7 17.7 ± 976.4∗ 14.6 ±9 39.3∗ ∗ 0.514 10.8 ±9 39.7ab 11.0 ± 932.9abb 25.7 ±9 77.6ab
Others 15.5 ± 256.5 3.8 ±9 23.6∗ 27.1 ± 361.9∗ ∗ 0.251 3.1 ± 916.4ab 51.1 ± 566.1abb 4.4 ± 925.9ab
Meat/fish products 14.5 ± 939.6 15.9 ± 940.8∗ 13.2 ± 938.4∗ ∗ 0.384 23.6 ± 943.7ab 14.1 ±9 36.1abc 18.8 ± 952.8ab
Vegetables/seaweeds 13.2 ± 925.3 12.0 ± 925.2∗ 14.5 ± 925.3∗ ∗ 0.204 7.3 ± 919.2cb 10.6 ±9 24.8bcb 15.1 ±9 26.4ab
Alcohols 12.6 ± 930.1 14.5 ± 931.0∗ 10.6 ±9 29.1∗ ∗ 0.106 16.6 ±9 30.4ab 12.1 ± 927.4bbb 21.7 ± 942.1ab
Rice cakes 8.1 ± 920.9 6.5 ± 921.8∗ 9.6 ± 919.9∗ ∗ 0.062 2.2 ± 996.9cb 5.8 ± 927.7bcb 7.2 ± 918.9bc
Porridges 7.4 ±9 32.9 8.5 ±9 39.7∗ 6.3 ±9 24.2∗ ∗ 0.391 0.8 ± 994.5bb 4.4 ± 916.9bbb 6.7 ± 928.4bb
Pickled vegetables 3.6 ± 998.5 3.6 ± 999.1∗ 3.5 ± 997.8∗ ∗ 0.869 2.8 ±99 8.0ab 3.5 ± 996.5abb 3.0 ± 997.2ab
Seasonings 3.5 ± 997.8 3.9 ± 998.7∗ 3.0 ± 996.8∗ ∗ 0.136 4.4 ± 999.9ab 3.8 ±99 7.9abb 3.2 ± 996.1ab
Salted seafoods 2.9 ± 912.3 3.1 ± 912.8∗ 2.8 ±9 11.9∗ ∗ 0.745 0.8 ± 995.4ab 4.6 ± 917.8abb 2.2 ±99 6.9ab
Sugars/sweeteners 1.5 ± 997.4 1.9 ±99 8.8∗ 1.2 ± 995.6∗ ∗ 0.265 2.8 ± 998.7ab 2.4 ± 999.8abb 2.1 ± 999.6ab
Oils/fats 0.2 ± 992.3 0.1 ± 990.9∗ 0.3 ± 993.0∗ ∗ 0.283 0.1 ± 990.8ab 0.4 ± 994.0abb 0.3 ±99 2.9ab

Mean ± SD 1) Gender comparison was analyzed by Student's t-test. 2) The results were analyzed by ANOVA and values with the different superscripts in age and region are significantly different by Duncan's multiple range test.

Table 4.
Continued
  P-value 2) Region P-value 2)
50∼59 (n = 128) 60∼69 (n = 128) Capital (n = 160) Chung-cheong (n = 160) Gyeong-sang (n = 160) Jeolla (n = 160)
182.5 ± 99.4b 231.6 ± 113.9a 0.001 152.2 ± 100.6 154.8 ± 893.6 167.5 ± 123.1 168.3 ± 108.8 0.401
886.7 ± 90.1 873.5 ± 893.9 0.237 886.9 ± 889.5 898.3 ±8 96.2 886.6 ± 879.0 882.2 ±8 92.0 0.420
892.8 ± 91.4a 887.1 ± 883.7ab 0.001 861.5 ± 892.0 884.5 ± 880.3 876.5 ±8 84.0 884.3 ±8 85.0 0.054
830.0 ± 54.0c 837.6 ± 868.0c 0.001 849.8 ±8 74.3 857.7 ± 894.9 876.7 ± 104.3 868.9 ±8 99.9 0.054
869.2 ± 86.1ab 890.7 ± 117.7a 0.001 848.3 ± 875.6b 875.4 ±8 94.6a 874.7 ± 102.2a 851.9 ±8 79.3b 0.005
849.4 ± 71.6b 833.8 ± 865.8b 0.001 861.1 ± 879.8a 867.9 ±8 85.0a 858.7 ±8 81.6ab 841.4 ± 874.1b 0.024
849.5 ± 82.7 853.7 ± 890.1 0.325 868.4 ± 115.1 857.3 ± 882.0 854.8 ± 893.7 848.6 ± 879.9 0.291
847.3 ± 62.1 855.5 ± 884.6 0.199 838.8 ± 863.0 861.0 ± 110.2 854.3 ±8 87.2 859.8 ±8 74.9 0.078
834.1 ± 55.8b 818.6 ± 832.7b 0.001 862.5 ± 896.7 844.9 ± 872.4 848.1 ± 874.2 853.8 ± 101.5 0.293
851.1 ± 52.0a 850.4 ± 863.4a 0.017 839.9 ± 857.4 844.9 ±8 55.8 838.9 ±8 36.4 848.2 ± 864.5 0.386
819.9 ± 46.5cd 812.1 ±8 33.6d 0.001 848.6 ± 889.3ab 850.4 ± 103.0a 831.3 ± 860.8bc 826.2 ±8 60.3c 0.012
831.6 ± 50.2 823.4 ± 849.2 0.057 838.0 ± 861.3 825.9 ±8 37.4 839.4 ± 889.7 838.5 ± 891.5 0.303
828.9 ± 55.5 836.0 ± 871.9 0.791 826.9 ±8 44.3 841.3 ± 862.8 832.9 ± 854.9 828.3 ± 866.7 0.109
836.5 ± 25.1b 842.8 ± 831.1a 0.001 829.2 ± 820.4b 837.4 ± 831.0a 829.9 ±8 23.8b 832.1 ± 827.9ab 0.021
825.0 ± 54.8 838.7 ± 885.0 0.062 825.7 ±8 54.8b 831.0 ± 853.9b 848.6 ± 109.9a 822.5 ± 846.9b 0.005
835.1 ± 52.7a 838.1 ±8 63.9a 0.025 830.3 ±8 49.5 829.5 ± 855.4 830.5 ± 851.7 833.6 ±8 59.2 0.910
835.0 ± 40.3a 838.4 ± 852.4a 0.001 820.8 ±8 25.1 819.3 ± 831.2 827.7 ± 846.4 823.0 ±8 33.1 0.155
832.7 ± 118.4a 824.4 ±8 54.2ab 0.030 822.1 ± 860.8 817.6 ± 860.0 818.2 ±8 34.1 819.9 ±8 95.8 0.933
823.7 ± 48.9ab 832.6 ±8 81.9a 0.001 821.3 ± 842.2ab 811.4 ± 827.6b 829.9 ± 877.3a 813.6 ± 838.3b 0.004
815.6 ± 35.1 817.6 ± 892.1 0.272 811.0 ±8 35.9 819.7 ± 887.2 815.5 ± 838.1 818.3 ±8 66.6 0.594
813.3 ± 84.1 885.4 ±8 30.7 0.524 881.2 ± 810.4 881.5 ±8 10.9 811.7 ± 877.5 847.5 ± 506.7 0.322
889.7 ± 28.7bc 886.4 ± 829.7c 0.003 888.0 ± 822.4b 813.6 ± 838.1ab 815.3 ± 840.8ab 821.2 ± 851.0a 0.028
813.0 ± 19.0bc 820.1 ± 832.8a 0.001 812.1 ± 828.6b 811.1 ± 816.5b 820.2 ±8 34.1a 889.6 ± 815.8b 0.001
889.1 ± 26.4bc 883.3 ± 814.8c 0.001 889.2 ±8 24.1 814.6 ± 832.2 811.8 ± 826.1 814.7 ± 836.4 0.310
810.4 ± 19.5ab 814.7 ± 823.7a 0.001 884.9 ± 824.8b 813.1 ± 821.4a 888.6 ± 819.3ab 885.8 ± 816.5b 0.002
889.2 ± 29.9ab 816.0 ±8 57.4a 0.004 812.5 ± 849.2a 882.2 ± 815.5b 888.7 ± 830.2ab 886.3 ± 826.6ab 0.042
883.9 ± 89.4 884.5 ± 810.6 0.472 882.9 ±88 6.6 883.8 ± 889.3 884.6 ±88 9.5 882.9 ± 888.1 0.215
883.8 ± 88.3 882.0 ±88 5.9 0.146 882.8 ± 887.3b 882.3 ± 885.4b 884.8 ± 889.7a 884.0 ±88 8.0ab 0.018
883.8 ± 14.7 883.3 ± 812.1 0.125 882.3 ±88 7.7 881.9 ± 887.3 882.9 ± 815.6 884.7 ± 815.8 0.184
880.2 ± 81.9b 880.2 ±88 1.2b 0.006 881.8 ± 888.6 882.3 ± 888.9 881.3 ± 886.3 880.7 ± 885.3 0.284
880.0 ±8 0.0 880.0 ±88 0.0 0.412 880.4 ±88 3.7 880.1 ± 880.7 880.2 ± 882.4 880.0 ± 880.0 0.433
Table 5.
Comparison of top 20 dishes contributing for dietary phosphorous intake by gender, age and region
Rank Gender Age (years)
Male (n = 320) Female (n = 320) 19∼29 (n = 128) 30∼39 (n = 128) 40∼49 (n = 128)
1 Cooked rice 15.11) Cooked rice 15.2 One-dish meals 10.3 Cooked rice 11.4 Cooked rice 14.7
2 Stir-fired foods 88.5 Stir-fired foods 8.2 Cooked rice 10.1 Bakeries/snacks 8.4 Stir-fired foods 8.7
3 Soups 88.2 One-dish meals 6.5 Stir-fired foods 9.3 Stir-fired foods 8.3 Soups 7.7
4 Stews 86.8 Milks/dairy products 6.5 Noodles 7.5 One-dish meals 6.7 One-dish meals 6.3
5 Noodles 85.7 Soups 6.2 Bakeries/snacks 7.5 Noodles 6.7 Stews 5.2
6 One-dish meals 85.5 Bakeries/snacks 5.6 Fried foods 7.5 Soups 6.1 Noodles 4.8
7 Roasted foods 85.4 Noodles 5.1 Roasted foods 6.6 Milk/dairy products 6.0 Milk/dairy products 4.5
8 Milk/dairy products 84.5 Stews 4.9 Milks/dairy products 6.5 Fried foods 4.9 Roasted foods 4.4
9 Bakeries/snacks 84.3 Roasted foods 4.7 Soups 5.1 Stews 4.9 Beverages/teas 4.4
10 Seasoned vegetables 84.2 Seasoned vegetables 3.9 Stews 4.2 Others 4.7 Steamed foods 3.8
11 Fried foods 83.8 Fried foods 3.6 Steamed foods 3.3 Roasted foods 4.3 Seasoned vegetables 3.7
12 Steamed foods 83.3 Pan-fried foods 3.2 Pan-fried foods 3.0 Beverages/teas 4.0 Bakeries/snacks 3.6
13 Kimchi 83.3 Kimchi 2.7 Beverages/teas 3.0 Seasoned vegetables 3.9 Pan-fried foods 3.3
14 Braised foods 83.1 Others 2.7 Seasoned vegetables 2.9 Pan-fried foods 2.7 Kimchi 3.2
15 Pan-fried foods 82.9 Steamed foods 2.7 Meat/fish products 2.3 Braised foods 2.7 Braised foods 3.2
16 Beverages/teas 82.7 Braised foods 2.7 Kimchi 2.0 Kimchi 2.4 Fried foods 3.0
17 Fruits 81.8 Fruits 2.6 Braised foods 1.7 Steamed foods 1.8 Meats/fishes/eggs 2.4
18 Meats/fishes/eggs 81.6 Beans/nuts/seeds 2.4 Alcohols 1.6 Grains/potatoes 1.4 Alcohols 2.0
19 Grains/potatoes 81.5 Grains/potatoes 2.2 Meats/fishes/eggs 1.0 Meat/fish products 1.3 Fruits 2.0
20 Meat/fish products 81.4 Meats/fishes/eggs 1.5 Beans/nuts/seeds 0.8 Alcohols 1.1 Beans/nuts/seeds 1.7

1) Values are % of total phosphorus intake from each dish groups.

Table 5.
Continued
Region
50∼59 (n =128) 60∼69 (n = 128) Capital (n = 160) Chung-cheong (n = 160) Gyeong-sang (n = 160) Jeolla (n = 160)
Cooked rice 17.3 Cooked rice 20.8 Cooked rice 15.2 Cooked rice 14.1 Cooked rice 14.8 Cooked rice 15.6
Soups 8.8 Stews 8.2 Stir-fired foods 8.7 Stir-fired foods 9.0 Stir-fired foods 7.7 Soups 7.8
Stir-fired foods 8.2 Soups 7.8 Milks/dairy products 6.8 Soups 7.7 One-dish meals 6.8 Stir-fired foods 7.6
Stews 6.6 Stir-fired foods 6.6 Bakeries/snacks 6.2 Stews 6.9 Soups 6.8 One-dish meals 6.4
Seasoned vegetables 4.9 Roasted foods 5.0 Soups 6.1 Noodles 6.2 Stews 6.6 Roasted foods 5.5
Milk/dairy products 4.7 Milks/dairy products 4.8 Noodles 6.1 Roasted foods 5.6 Noodles 5.2 Bakeries/snacks 5.0
Noodles 4.7 Seasoned vegetables 4.5 One-dish meals 5.0 One-dish meals 5.3 Milks/dairy products 4.8 Stews 4.8
Roasted foods 4.5 Kimchi 3.8 Fried foods 4.9 Milks/dairy products 5.2 Roasted foods 4.8 Milks/dairy products 4.5
Kimchi 3.5 Steamed foods 3.5 Stews 4.8 Fried foods 4.6 Steamed foods 4.3 Seasoned vegetables 4.5
Braised foods 3.3 Fruits 3.5 Seasoned vegetables 4.0 Bakeries/snacks 4.1 Bakeries/snacks 4.3 Others 4.4
Fruits 3.3 Braised foods 3.4 Roasted foods 3.9 Seasoned vegetables 4.1 Beverages/teas 3.5 Noodles 3.8
Bakeries/snacks 3.2 One-dish meals 3.4 Beverages/teas 3.8 Pan-fried foods 3.8 Seasoned vegetables 3.4 Beverages/teas 3.6
Grains/potatoes 3.1 Pan-fried foods 3.2 Braised foods 3.0 Kimchi 3.4 Pan-fried foods 2.9 Braised foods 3.1
Beverages/teas 3.0 Noodles 3.0 Kimchi 2.9 Steamed foods 2.8 Fried foods 2.8 Kimchi 3.0
One-dish meals 2.8 Beans/nuts/seeds 2.9 Pan-fried foods 2.7 Braised foods 2.7 Braised foods 2.7 Pan-fried foods 2.6
Pan-fried foods 2.7 Grains/potatoes 2.2 Steamed foods 2.6 Beverages/teas 2.4 Kimchi 2.6 Fried foods 2.4
Steamed foods 2.4 Beverages/teas 2.1 Grains/potatoes 2.2 Meats/fishes/eggs 1.8 Beans/nuts/seeds 2.6 Fruits 2.1
Beans/nusts/seeds 2.3 Vegetables/seaweeds 1.8 Beans/nuts/seeds 2.1 Fruits 1.8 Fruits 2.4 Steamed foods 2.1
Fried foods 1.9 Bakeries/snacks 1.7 Fruits 2.1 Grains/potatoes 1.6 Vegetables/seaweeds 1.8 Meat/fish products 2.0
Meats/fishes/eggs 1.5 Meats/fishes/eggs 1.6 Porridges 1.2 Alcohols 1.3 Grains/potatoes 1.6 Grains/potatoes 1.8
TOOLS
Similar articles