

 PDF
PDF ePub
ePub Citation
 Print
Print


Abstract
Objectives
This study investigates the current state of consuming breakfast among elementary school students residing in Malang, East Java, Indonesia, and to identify factors that influence breakfast behavior.
Methods
The research model was set up as per the health belief model, and slightly modified by adding the subjective normative factors of the theory of planned behavior. The survey was conducted from July 17 to August 15, 2017 using a questionnaire, after receiving the permission PNU IRB (2017_60_HR).
Results
The subjects were 77 boys (49.4%) and 79 girls (50.6%) suffering from malnutrition with anemia (21.2%) and stunting ratio of Height for Age Z Score (HAZ) (11.5%). Furthermore, moderate weakness (14.8%) and overweight and obesity (12.3%) by Body Mass Index for Age Z Score (BMIZ) were coexistent. According to the results obtained for breakfast, 21.8% did not eat breakfast before school, with 18.8% of the reasons for skipping breakfast being attributed to lack of food. Even for subjects partaking breakfast, only about 10% had a good balanced diet. The average score of behavioral intention on eating breakfast was 2.60 ± 0.58. The perceived sensitivity, perceived severity, perceived benefits, and self-efficacy of the health belief model correlated with breakfast behavior. Of these, self-efficacy (β=0.447, R2=0.200) and perceived sensitivity (β=0.373, R2=0.139) had the greatest effect on breakfast behavior. Mother was the largest impact person among children.
Conclusions
In order to increase the level of breakfast behavior intention among children surveyed in Indonesia, we determined the effectiveness by focus on education which helps the children recognize to be more likely to get sick when they don't have breakfast, and increase their confidence in ability to have breakfast on their own. We believe there is a necessity to seek ways to provide indirect intervention through mothers, as well as impart direct nutrition education to children.
Go to : 
References
1. Stefani M, Harfika A, Anwar K, Humayah W, Pujilestari S, Azni IN, et al. An integrated healthy breakfast education for teachers, school children, and parents in West Java. ICCD. 2018; 1(1):165–170.

2. Hong JK. A study on the professional guidance and counseling for children in elementary schools. J Elementary Educ. 2002; 15(1):1–20.
3. Susanto F. Breakfast skipper and breakfast eater: which is better. Int J Nutr Food Sci. 2015; 4(5):565–573.
4. Brown JL, Beardslee WH, Prothrow-Stith D. Impact of school breakfast on children's health and learning: An analysis of the scientific research [Internet]. Sodexo Foundation;2008. [cited 2019 Jul 1]. Available from:. http://us.stop-hunger.org/files/live/sites/stophunger-us/files/HungerPdf/Impact. %20of%20School %20Breakfast%20Study_tcm150–212606.pdf.
5. Huang CJ, Hu HT, Fan YC, Liao YM, Tsai PS. Association of breakfast skipping with obesity and health-related quality of life: evidence from a national survey in Taiwan. Int J Obes. 2010; 34(4):720–725.
6. The national institute of health research and development, Ministry of health, Republic of Indonesia. Report on result of national basic health research (RISKESDAS) [Internet]. Jakarta, Indonesia: Ministry of health, Republic of Indonesia;2007. [cited 2019 Jul 1]. Available from:. http://biofarmaka.ipb.ac.id/biofarmaka/2014/Riskesdas2007. %20-%20Report%20on%20Result%20of% 20National%20Basic%20Health%20Research.pdf.
7. Trihono, MSc. Riset Kesehatan Dasar: Riskesdas 2013. Badan Penelitian dan Pengemb A Nagan Kesehatan Kementerian Kesehatan RI;. 2013. [cited 2019 Jul 1]. Available from:. http://www.depkes.go.id/resources/download/general/Hasil. %20Riskesdas%202013.pdf.
8. Yang RJ, Wang EK, Hsieh YS, Chen MY. Irregular breakfast eating and health status among adolescents in Taiwan. BMC Public Health. 2006; 6(1):295.
9. Nurul Fadhilah A, Teo PS, Huybrechts I, Foo LH. Infrequent breakfast consumption is associated with higher body adiposity and abdominal obesity in Malaysian school aged children. PLoS One. 2013; 8(3):e59297.
10. WHO Working Group. Use and interpretation of anthropometric indicators of nutritional status. Bull World Health Organ. 1986; 64(6):929–941.
11. Mei Z, Grummer-Strawn LM. Standard deviation of anthropometric Z-scores as a data quality assessment tool using the 2006 WHO growth standards: a cross country analysis. Bull World Health Organ. 2007; 85(6):441–448.
12. Kuczmarski RJ, Ogden CL, Guo SS, Grummer-Strawn LM, Flegal KM, Mei Z, et al. 2000 CDC growth charts for the United States: Methods and development [Internet]. National Center for Health Statistics, USA;. 2002. [cited 2019 Jul 1]. Available from:. https://stacks.cdc.gov/view/cdc/6451.
13. Hardinsyah H, Aries M. Jenis pangan sarapan dan perannya dalam asupan gizi harian anak usia 6–12 tahun di Indonesia. Jurnal Gizi dan Pangan. 2012; 7(2):89–96.
14. Sekiyama M, Roosita K, Othsuka R. Snack foods consumption contributes to poor nutrition of rural children in West Java, Indonesia. Asia Pac J Clin Nutr. 2012; 21(4):558–567.
15. Februhartanty J. Nutrition education: It has never been an easy case for Indonesia. Food Nutr Bull. 2005; 26(2):S267–274.
16. Lee KA. Elementary school children's perceptions of traditional Korean foods, based on the health belief model. Korean J Nutr. 2013; 46(1):86–97.
17. Shin KO, Yoon JA, Je H, Hwang HJ, Lee Y, Choi JH. The effect of nutrition education based on health belief model for male college students in Seoul. Korean J Hum Ecol. 2018; 27(4):305–319.
18. Fathi A, Sharifirad G, Gharlipour Z, Hakimelahi J, Mohebi S. Effects of a nutrition education intervention designed based on the health belief model (HBM) on reducing the consumption of unhealthy snacks in the sixth grade primary school girls. Int J Pediatr. 2017; 5(2):4361–4370.
19. UNICEF. Child poverty and disparities in Indonesia: challenges for inclusive growth [Internet]. Jakarta UNICEF;2013. [cited 2019 Jul 1]. Available from:. https://www.unicef.org/indonesia/Child_Poverty_Indonesia.pdf.
20. Lee CH. The effect of locus of control and health belief model on handwashing: expanding health belief model [master's thesis]. Hanyang University;. 2015.
21. Kim JE. Study on predicting behavioral intention of breastfeeding among primigravida [Master's thesis]. Dongguk University;. 2000.
22. Kim JE. Microbiological analysis of hands and education of handwashing among preschool children in a day care center [master's thesis]. Hanyang University;. 2010.
23. WHO. Iron deficiency anaemia: assessment, prevention and control. A guide for programme managers [Internet]. Geneva: World Health Organization;2001. [cited 2019 Jul 1]. Available from:. http://www.who.int/nutrition/publications/micronutrients/anaemia_iron_deficiency/WHO_NHD_01.3/en/index.html.
24. Insani PN, Rimbawan R, Palupi E. Dietary habits and nutritional status among school children in rural and urban area: a comparative study from Bogor, Indonesia. Future Food J Food Agric Soc. 2018; 6(2):55–66.
25. OECD/World Health Organization. Health at a glance: Asia/Pacific 2012 [Internet]. OECD;2013. [cited 2019 Jul 3]. Available from:. https://apps.who.int/iris/bitstream/handle/10665/87269/9789264183902_kor.pdf?sequence=3&isAllowed=y.
26. WHO. The world health report 2002: Reducing risks, promoting healthy life [Internet]. World Health Organization, Geneva;2002. [cited 2019 Jul 1]. Available from:. https://www.who.int/whr/2002/en/.
27. Hardinsyah MS. Sarapan sehat salah satu pilar gizi seimbang [Internet]. Ketua umum pergizi pangan;2013. [cited 2019 Jul 1]. Available from:. https://pergizi.org/images/stories/downloads/materi_PESAN/materi3.pdf.
28. Rampersaud GC, Pereira MA, Girard BL, Adams J, Metzl JD. Breakfast habits, nutritional status, body weight, and academic performance in children and adolescents. J Am Diet Assoc. 2005; 105(5):743–760.
29. Evers S, Taylor J, Manske S, Midgett C. Eating and smoking behaviours of school children in southwestern Ontario and Charlottetown, PEI. Can J Public Health. 2001; 92(6):433–436.
30. Ming MF, Ying GC, Kassim M. Eating patterns of school children and adolescents in Kuala Lumpur. Malays J Nutr. 2006; 12(1):1–10.
31. So HK, Nelson EA, Li AM, Guldan GS, Yin J, Ng PC, et al. Breakfast frequency inversely associated with BMI and body fatness in Hong Kong Chinese children aged 9–18 years. Br J Nutr. 2011; 106(5):742–751.
32. Barker M, Robinson S, Wilman C, Barker DJ. Behaviour, body composition and diet in adolescent girls. Appetite. 2000; 35(2):161–170.
33. Kosti RI, Panagiotakos DB, Zampelas A, Mihas C, Alevizos A, Leonard C, et al. The association between consumption of breakfast cereals and BMI in schoolchildren aged 12–17 years: the VYRONAS study. Public Health Nutr. 2008; 11(10):1015–1021.
34. Kovarova M, Vignerova J, Blaha P, Osancova K. Bodily characteristics and lifestyle of Czech children aged 7.00 to 10.99 years, incidence of childhood obesity. Cent Eur J Public Health. 2002; 10(4):169–173.
35. Sjoberg A, Hallberg L, Hoglund D, Hulthen L. Meal pattern, food choice, nutrient intake and lifestyle factors in The Goteborg Adolescence Study. Eur J Clin Nutr. 2003; 57(12):1569–1578.
36. Keski-Rahkonen A, Kaprio J, Rissanen A, Virkkunen M, Rose RJ. Breakfast skipping and health-compromising behaviors in adolescents and adults. Eur J Clin Nutr. 2003; 57(7):842–853.
37. O'Neil CE, Nicklas TA. A review of the relationship between 100% fruit juice consumption and weight in children and adolescents. Am J Lifestyle Med. 2008; 2(4):315–354.
38. Cotton PA, Subar AF, Friday JE, Cook A. Dietary sources of nutrients among US adults, 1994 to 1996. J Am Diet Assoc. 2004; 104(6):921–930.
39. Whittaker P, Paul R. Tufaro PR, Rader JI. Iron and folate in fortified cereals. J Am Coll Nutr. 2001; 20(3):247–254.
40. Rampersaud GC. Benefits of breakfast for children and adolescents: Update and recommendations for practitioners. Am J Lifestyle Med. 2008; 3(2):86–103.
41. Menteri Kesehatan Republik Indonesia. Peraturan menteri kesehatan republik Indonesia nomor 41 tahun 2014 [Internet]. Jakarta, Indonesia;. 2014. [cited 2019 Jul 1]. Available from:. http://hukor.depkes.go.id/uploads/produk_hukum/PMK. %20No.%2041%20ttg%20Pedoman%20Gizi%20Seimbang.pdf.
42. Imanningsih N, Jahari AB, Permaesih ID, Chan P, Amarra S. Consumption and sources of added sugar in Indonesia: a review. Asia Pac J Clin Nutr. 2018; 27(1):47–64.
43. Lee SJ, Ryu HK. Relationship between dietary intakes and the double burden of malnutrition in adults of Malang, Indonesia: An exploratory study. Nutr Res Pract. 2018; 12(5):426–435.
Go to :
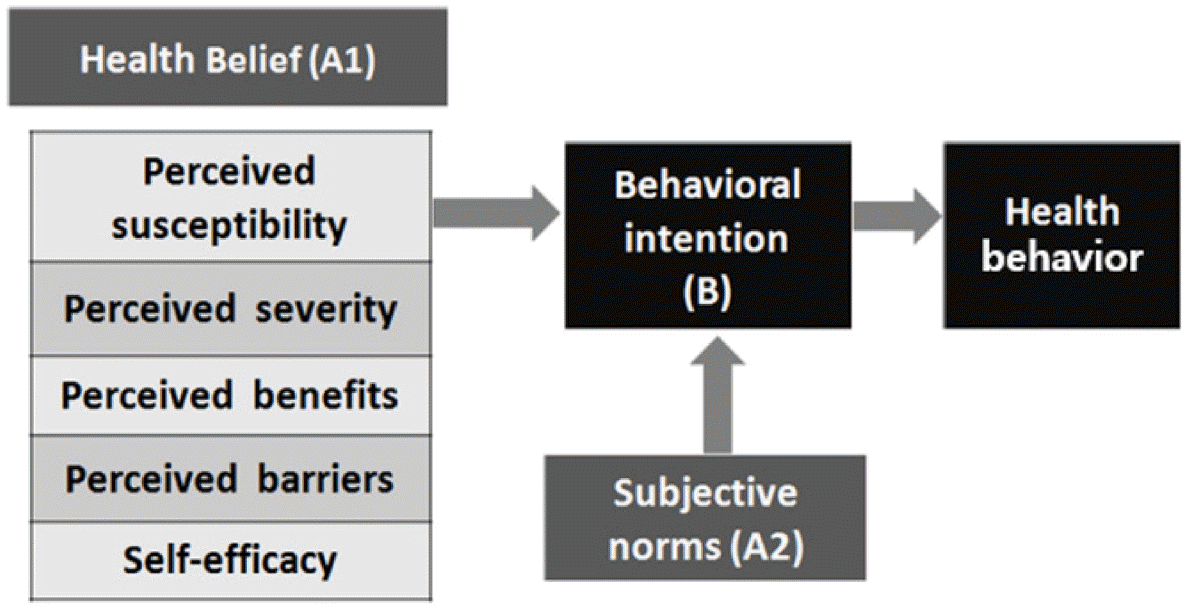
Table 1.
General characteristics of subjects
Table 2.
Growth and development status and anemia of the subjects
| Variables | Boys | Girls | Total | t or χ2 | |
|---|---|---|---|---|---|
| Anthtropometric status | |||||
| Height (cm) | 136.8 ± 7.5 | 141.5 ± 6.5 | 139.1 ± 7.0 | 0.003∗∗ | |
| Weight (kg) | 931.8 ± 7.2 | 933.2 ± 6.9 | 932.5 ± 7.0 | 0.366 | |
| Growth and development status | |||||
| HAZ1) | Severe stunting | 0 (880.0) | 0 (880.0) | 0 (880.0) | 6.574∗ |
| Moderate stunting | 14 (818.2) | 4 (885.1) | 18 (811.5) | ||
| Normal | 63 (881.8) | 75 (894.9) | 138 (888.5) | ||
| BMIZ2) | Severe weakness | 2 (882.6) | 3 (883.8) | 5 (883.2) | 0.844 |
| Moderate weakness | 9 (811.7) | 9 (811.4) | 18 (811.5) | ||
| Normal | 55 (871.4) | 59 (874.7) | 114 (873.1) | ||
| Overweight | 10 (813.0) | 7 (888.9) | 17 (810.9) | ||
| Obesity | 1 (881.3) | 1 (881.3) | 2 (881.3) | ||
| Anemia | |||||
| Anemia | 18 (823.4) | 15 (819.0) | 33 (821.2) | 0.883 | |
| Normal | 59 (876.6) | 64 (881.0) | 123 (878.8) | ||
| Total | 77 (100.0) | 79 (100.0) | 156 (100.0) | ||
Table 3.
Breakfast eating status of subjects
Table 4.
Types of foods for breakfast
Table 5.
Behavioral intention on eating breakfast
Table 6.
Health beliefs on eating breakfast
Table 7.
Subjective norms on eating breakfast
Table 8.
Correlation between constructs of health beliefs, subject norms, or behavioral intention on eating breakfast
Table 9.
Association between health beliefs and behavioral intention on eating breakfast
∗ P<0.05, ∗∗ P<0.01, ∗∗∗ P<0.001 1) Correlation coefficient between independent variable and dependent variable 2) Coefficient of determination, indicating how many percent of the total variability can be explained by independent variables 3) Test statistic of significance of the regression model 4) Regression coefficient, influence of independent variables on dependent variables, the closer to 1, the higher the influence 5) Test statistic of regression coefficient
 XML Download