

 PDF
PDF ePub
ePub Citation
 Print
Print


INTRODUCTION
Hypercholesterolemia is a condition characterized by abnormally high levels of total cholesterol in the blood and particularly LDL cholesterol is a major component to increase the risk of coronary heart disease (CHD) [1]. Earlier studies have suggested that an 1% increase in the total cholesterol (TC) level may result in a 2% increased risk of CHD [2], whereas every 1 mg/dL decrease in HDL cholesterol may lead to a 2–3% increase in CHD risk [3].
Based on the Cause of Death Statistics data, the CHD mortality rate in Korea is known to have markedly increased over 30 years [4]. The 2016 Korea National Health and Nutrition Examination Survey (KNHANES) has shown that 20.6% of male and 23.6% of female adults aged 30 years or older have hypercholesterolemia defined as TC levels ≥ 240 mg/dL [5], which is a three-fold increase from 2005 (7.3% in men and 8.4% in women). In contrast, the blood levels of HDL cholesterol and triglycerides did not change significantly during the similar period [56]. Given these reports, a rising trend in LDL cholesterol levels is likely and may be responsible for the increased CHD morbidity and mortality in Korea.
Health-related associations, organizations, and societies in Korea have made concerted efforts to control CHD risk factors. They have provided the guideline for the management of dyslipidemia emphasizing the use of lipid-lowering medications and lifestyle modifications including smoking cessation and dietary changes, which can improve LDL cholesterol levels [7]. In terms of dietary recommendations, they have advocated dietary fat intake less than 30% (saturated fat intake less than 7%) of total caloric intake and replacement of saturated fat with polyunsaturated fat in the diet [7]. A recent report, in which the KNHANES data from 1998 to 2015 were analyzed, has shown an increasing secular trend in the mean percent of calories from dietary fat (fat %) from 18% to 21% in male adults and from 16% to 19% in female adults [8]. However, it is questionable whether these increasing trends coincide with a secular trend in LDL cholesterol levels and whether such consumption, which is commonly observed in Asian populations [9], is associated with the individual-level prevalence of hyper-LDL-cholesterolemia (HC). Because the KNHANES data do not include information on the types of dietary fat, a secular trend in saturated fat intake is obscure.
A number of studies from different countries examined secular trends in lipid profiles [10111213141516]. One of them reported lifestyle factors contributing to such trends, including obesity, smoking, and alcohol drinking, but did not examine dietary factors [16]. Another study observed similar secular trends in serum cholesterol levels and dietary fat intake, but did not analyze their association [13].
Time series analysis of national health survey data is useful for monitoring secular trends in disease prevalence and related factors, establishing contemporary strategies and plans to improve health, and projecting a future estimate of disease burden. Based on results from the analysis, effective programs where lifestyle changes are essential for the prevention and management of chronic disease can be established [17].
The objectives of the present study, which used pooled cross-sectional data of nationwide surveys over 10 years, are as follows: 1) to examine secular trends in dietary and lifestyle factors (such as smoking, alcohol consumption, or sleep duration), other factors (such as demographic, socioeconomic, or psychological factors), and HC prevalence; 2) to evaluate the association between these factors and HC prevalence at the individual-level; 3) to construct a prediction model which includes significant factors contributing to HC prevalence; 4) to suggest implications for primary prevention strategies against HC based on the prediction model.
SUBJECTS AND METHODS
Study population
The present study obtained times series data from the website of the KNHANES (https://knhanes.cdc.go.kr/knhanes) and the Korean Statistical Information Service (KOSIS) (http://kosis.kr). Individual level data from the KNHANES and regional level data from the KOSIS for the period between 1998 and 2016 were obtained when accessed in May of 2018. A previous report described the KNHANES, which is a cross-sectional study [18]. Briefly, this nationwide health survey collects information on socioeconomic status, quality of life, health behaviors, dietary intake and behaviors, anthropometric and clinical measures, and biochemical profiles. The survey regarding health behaviors including smoking and alcohol drinking is self-administered while other survey processes are administered by trained researchers. A single 24-hour dietary recall and a qualitative food frequency table consisting of 63 food items are used in an interview to collect dietary information [18] and average daily nutrient intakes are calculated mainly based on the food composition database published by Rural Development Administration of Korea [19].
The present study used data of the KNHANES cycles III–VI (2005, 2007–2009, 2010–2012, and 2013–2015, respectively) and VII (only the year 2016) with a particular focus on the health and nutrition interview records. Because information on the use of cholesterol-lowering medications was available from the cycle III, earlier data were not used. After the cycle III–VI data for 41,864 participants aged 30 years or older were merged, data for 41,073 participants who had lipid profiles were used to analyze secular trends in variables. After excluding 2,679 HC patients, who reported the use of cholesterol-lowering medications or treatments, to minimize potential influence of HC diagnosis on lifestyle factors, data for 38,394 participants (15,634 men and 22,760 women) were used in analysis identifying significant factors associated with HC prevalence and constructing prediction models. The data of the year 2016 comprising 4,001 participants (1,623 men and 2,378 women) was used to validate the prediction models.
All procedures were approved by the Human Subjects Review Committee of Kookmin University (KMU-201512-HR-094).
Variables from the KNHANES data and the KOSIS data
The outcome variable of the study was the prevalence of HC that was defined as having serum LDL cholesterol levels ≥ 130 mg/dL or diagnosed HC, because LDL cholesterol is the primary target of dylipidemia management and reducing CHD risk [7]. LDL cholesterol levels were calculated using the Friedewald equation [20]. The initial list of potential factors contributing to HC was prepared based on the similar procedure that a previous study used [22] and reviewed by an expert council consisting of nutritionists, public health specialists, epidemiologists, and physicians. Based on the list revised by the expert council, variables available in the KNHANES, including age, gender, marital status, job status, income status, body mass index (BMI), smoking status, alcohol consumption status, sleep duration, psychological status, use of oral contraceptives (OC) in women, and dietary variables from 24-hour dietary recalls, were selected. For dietary variables, calculated total calorie (kcal/day), fat (g/day) intake, and consumption of high-fat food items (g/day), such as meats, eggs (due to high cholesterol content), dairy products, nuts, plant oils, and animal fats and oils, which had been classified in the KNHANES data, were selected. Variables regarding physical activity were not collected because survey questions on this topic were inconsistent across survey cycles. The KOSIS data regarding gasoline consumer price index, which may indirectly reflect physical activity [21], were extracted, merged with the KNHANES data according to 16 residence regions, and treated as a regional level variable.
Statistical analysis
Descriptive statistics were performed and p for trend across the KNHANES data cycles was obtained using the Chi-square test for trend (Cochran-Armitage test) and linear trend analysis in ANOVA. To analyze the associations between contributing factors and HC prevalence, logistic regression analysis was used. The model was constructed using the equation, P(Oijt=1) = ∫ (α + β1*Xit + β2*Zjt + β3*T), in which ‘O’ indicates an outcome variable; ‘i’, an individual; ‘j’, residence region; ‘t’, year; ‘X’, contributing factors for an individual subject; ‘Z’, a variable from the KOSIS data; ‘T’, yearly ranking; and ‘∫()’, a logit probability function. In this analysis, survey sample weights were given to the KNHANES. Based on such a model which was used in previous studies [2223], whether time, individual level variables, and region level variables are associated with HC prevalence was evaluated.
Among contributing factors, age, BMI, and consumption of high-fat foods were treated as continuous variables while marital status (single or married), job status (office job, non-office job, or no job), income status (low-income or higher-income household), smoking status (non-smoker or ever-smoker), alcohol consumption status (alcohol non-drinker or drinker), sleep duration (≤ 6 hours/day or > 6 hours/day), experiencing stress (no or yes), having depressed mood (no or yes), and OC use in women (no or yes) were treated as categorical variables in gender-specific models. Because there were trivial missing data in some dummy variables, individuals with a missing value were classified into a group with a higher frequency. To further analyze the association between fat % and HC prevalence, all of these variables, except for consumption of high-fat foods, were included in the multi-variable models. Total calorie intake, fat %, and consumption of high-fat foods were not controlled for simultaneously to avoid collinearity.
To identify the factors contributing to HC prevalence, significant independent variables were found at the level of 0.05 after variables were selected using a stepwise selection method (slentry = 0.15 and slstay = 0.15). Multivariable odds ratios (ORs) and its 95% confidence interval (CI) were obtained from the final gender-specific models. Coefficient estimates for significant variables were used to construct prediction models. To estimate HC prevalence for the year 2016, independent variables were selected from the 2016 KNHANES data.
RESULTS
Secular trends in hyper-LDL-cholesterolemia prevalence and dietary and modifiable factors
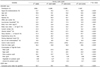
Table 1 shows the age-adjusted values of variables from the KNHANES data and the KOSIS data across the survey cycles. Age-adjusted HC prevalence increased over the 10-year cycles (P < 0.001). Proportions of people who were married, those with low income, smokers, alcohol drinkers, persons who admitted to experiencing stress or depression, and users of OC decreased (P < 0.001), whereas proportions of office workers and those with short sleep duration increased (P < 0.001) over the cycles. The average daily consumption of meats, eggs, dairy products, nuts, and vegetable oil products increased with total calorie and fat intake (P < 0.001) whereas consumption of animal fat products decreased over the cycles (P < 0.001). Based on the KOSIS data, the gasoline consumer price index had increased (P < 0.001).
Associations between dietary and modifiable factors and hyper-LDL-cholesterolemia prevalence
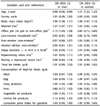
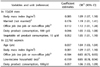
The results of stepwise regression analysis for the 10-year prevalence of HC are presented in Tables 2 and 3. Table 2 shows age-adjusted ORs and 95% CI for all variables by gender. Age, BMI, marital status, types of job, and consumption of dairy products and vegetable oil products were significant in men and age, BMI, types of job, income status, and dairy product intake were significant in women for the association with HC (P < 0.05).
Table 3 shows the gender-specific final models after conducting stepwise logistic regression analysis, which included all variables presented in Table 2, except for fat intake. Finally, BMI, marital status, types of job, and consumption of dairy products and vegetable oil products in men and age, BMI, types of job, income status, and dairy product intake in women were selected as significant variables (P-value < 0.001 in the Wald test). On the basis of the multivariate results, men who were married, had higher BMI, an office job, and consumed more dairy and vegetable oil products, and women who were older, had higher BMI, no job or non-office job, higher income, and consumed more dairy products showed higher probabilities of having HC.
Prediction of hyper-LDL-cholesterolemia prevalence
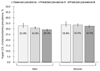
Using the gender-specific models demonstrated in Table 3, the observed and predicted estimates of HC prevalence for the year 2016 in male and female adults aged 30 years or older are shown in Fig. 1. The predicted estimates indicated as ‘predicted prevalence A’ were 30.8% (95% CI: 30.4, 31.2) for men and 33.6% (95% CI: 32.8, 34.3) for women. These predictions were comparable to the observed estimates of 32.8% (95% CI: 30.3, 35.4) for men and 33.8% (95% CI: 31.5, 36.2) for women.
Because the gender-specific final models included BMI, which is a well-known modifiable risk factor, as shown in Table 3, HC prevalence estimates were calculated under the assumption that BMI is reduced. After applying a reduction in body weight (a 2 kg/m2 decrease in BMI) to the prediction models, the modified estimates, indicated as ‘predicted prevalence B’, were 29.3% (95% CI: 28.9, 29.7) for men and 32.5% (95% CI: 31.8, 33.3) for women. Because the obesity prevalence of 43% in men and 32% in women was considered in this calculation, a reduction in HC prevalence was found to be greater in men than in women.
Association between fat intake and hyper-LDL-cholesterolemia prevalence
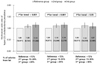
Fig. 2 demonstrates the association between fat % and HC prevalence after the adjustment of variables presented in Table 2, except for consumption of high-fat foods. Three options for the fat % categories were used in the models; 1) < 15%, 15–20%, and > 20%; 2) < 15%, 15-25%, and > 25%; 3) < 15%, 15–30%, and > 30%. Compared with the reference with < 15% of fat calories, the multivariable ORs (95% CI) were 1.08 (1.01, 1.16) for 15–20% and 1.14 (1.07, 1.22) for > 20% (P-value for trend < 0.001), 1.10 (1.04, 1.18) for 15-25% and 1.14 (1.04, 1.24) for > 25% (P-value for trend < 0.001), and 1.12 (1.05, 1.19) for 15-30% and 1.07 (0.95, 1.20) for > 30% of fat calories (P-value for trend < 0.05). Persons who consumed > 20% or > 25% of fat calories had a 14% significant increase in the OR of HC prevalence compared with those consuming < 15%. Compared with the same reference, however, those consumed > 30% of fat calories showed a 7% increase in the OR, which was not significant partly due to a small sample size.
DISCUSSION
In the present study, after analyzing national survey data from 2005 to 2015, BMI and dairy product consumption were found to be significant modifiable factors positively associated with HC prevalence in both male and female adults. The prediction models including these factors, which were constructed and validated in the study, indicated that moderate weight loss in obese individuals could result in an 1 to 1.5-fold reduction in HC prevalence.
The age-standardized prevalence of hypercholesterolemia defined as TC levels ≥ 240 mg/dL has been slowly increasing from 2005 to 2016; the KNHANES data revealed 8.0% in 2005 and 19.9% in 2016 among all adults aged 30 years or older [5]. The prevalence of hypercholesterolemia in U.S. adults aged 20 years or older was reported to be 12.4% in 2015–2016 [24] whereas comparable data for same-aged Korean adults reported 17.2%. Furthermore, the annual increase rate is less than 0.1% in U.S. whereas it is greater than 1% in Korea. An increase in the prevalence of hypercholesterolemia, particularly high levels of LDL cholesterol, among Korean adults may be due to unfavorable changes in risk factors. The present study confirmed an increasing trend in HC prevalence with increasing consumption of high-fat foods over 10 years. Particularly, a noticeable secular increase in the consumption of dairy products was observed. In association analysis, consumption of dairy products and vegetable oil products was found to be positively associated with HC prevalence. Whole-fat milk and dairy products are food sources of saturated fat as about two-thirds of milk fatty acid is saturated. Although the findings on the effect of whole-fat dairy consumption on raising LDL cholesterol are still inconsistent [25], it is quite obvious that substituting fat-free or low-fat dairy for whole-fat products is beneficial in reducing CHD risk [26]. Vegetable oil products, such as soybean oil and corn oil, are commonly used in Korea, and most of them are high in unsaturated fat and low in saturated fat. The findings of this study regarding the association between the consumption of vegetable oil products and HC prevalence conflict with the beneficial effects on LDL cholesterol of replacing unsaturated with saturated fat [27]. This discrepancy may be explained by the increasing consumption of heated vegetable oils in deep-fried foods [28], which was reported to increase the risk of CHD [29]. According to the Dietary Reference Intakes for Koreans 2015, the recommended percentages of calories from fat range from 15% to 30% for adults aged 19 years or older [30]. This range was newly established based on the KNHANES data regarding an increasing trend in the consumption of fat %; the previously recommended range was 15–25% [31]. In the present study, 15% of the study subjects were found to consume 20% to 25% of fat calories and contribute to an increase in the ORs of HC prevalence whereas only 6% of them consumed > 30% and their OR was not significant. Because these findings do not indicate causal associations, cautious interpretations are warranted and proper consumption of fat % cannot be suggested at this time. Nevertheless, data from the national survey regarding an increasing trend in fat consumption and its association with chronic disease should not be ignored when the dietary guideline is established.
In this study, BMI was found to be steady over the study cycles, but obesity prevalence tended to be slowly increasing. Furthermore, a positive association between BMI and HC prevalence was found as shown in earlier data [32]. The prediction results of this study suggest that an 1 kg/m2 change in BMI is associated with a 9% change in the odds of HC prevalence, and thus a 2 kg/m2 reduction in BMI would result in a 3.3-fold reduction in HC prevalence. A meta-analysis study including 65 studies reported a 0.77 mg/dL decrease in LDL cholesterol for every 1 kg of weight loss [33]. According to the 2016 KNHANES report, 42% of male and 26% of female adults have a BMI of 25 kg/m2 or greater and are considered high risk for HC [5]. For this population, implementing interventions aimed at weight control would be one of the primary prevention strategies to manage not only LDL cholesterol but also triglycerides.
In the present study, age, marital status, types of job, and income status were found to have a significant association with HC. Information on such demographic and socioeconomic factors can be utilized to identify a high-risk population. The impact of age on HC is expected to be greater because of an increasing size of the elderly population.
The limitations and strengths of the present study should be noted. Because of its cross-sectional design, causal associations between contributing factors and HC cannot be inferred from the findings of this study. Other factors which are potentially associated with HC, such as genetic predisposition [34], shift work [35], and physical activity [36], were not evaluated; especially physical activity, which is an important modifier of cholesterol levels. In the KNHANES data, information on regular walking was available but was considered to be insufficient to reflect overall physical activity. Instead, the consumer price index for gasoline was considered in the study, because high gasoline price is possibly linked to physical activity [21]. Because LDL cholesterol levels were calculated rather than assayed directly, non-differential misclassification in the outcome might occur. However, its influence on the findings may be minimal [37]. Some strengths of the study include the availability of a large sample size through using national survey data and that a wide range of variables were considered in the analysis.
In summary, the present study analyzed pooled cross-sectional data from nationwide surveys over 10 years and revealed that higher BMI and increasing consumption of calories from fat and some high-fat food products, such as dairy and vegetable oil products, are associated with the prevalence of HC defined using LDL cholesterol levels. Given the trend that HC prevalence, obesity, and fat consumption is gradually increasing in Korean adults, individual- and national-level efforts for weight control and proper dietary modification are needed to prevent and manage HC. At present, however, whether discouraging consumption of dairy and vegetable oil products can reduce HC prevalence is obscure. To clarify this issue, further studies with a prospective longitudinal design are warranted.
 XML Download