

 PDF
PDF ePub
ePub Citation
 Print
Print


INTRODUCTION
Adequate nutrition for athletes is important to maintain physical condition and achieve optimal athletic performance [1]. Careful nutritional management is required for weight class athletes who have to control their weight before competition [2]. Athletes such as taekwondo, judo, boxing, and wrestling athletes are classified based on body weight. This makes competitions more compatible with respect to body size, strength, and agility [34]. Many weight class athletes, however, practice short-term weight loss to compete at a lower weight class for the purpose of competing with lighter or weaker opponents [56].
Despite the importance of adequate diet for weight class athletes, studies have shown that their diets did not meet recommended nutrient intakes [78910]. In a study on adolescent taekwondo athletes, nutrient intakes, including energy, thiamin, riboflavin, vitamin C, folate, and calcium intakes both before and after competition as well as at ordinary times, were lower than recommended dietary intakes [7]. Similarly, college taekwondo athletes showed insufficient intakes of energy, calcium, and riboflavin over a 12-week pre-competition period [8]. Dietary management for weight class athletes is important according to general training period, before and after competition, and recovery period. However, it has been reported that many weight class athletes do not recognize the importance of nutrition and try to lose weight rapidly before competition [681112].
Appropriate weight control can be done through nutritional management, increasing physical activity, and exercise. Professionals recommend that 5% or less loss of body weight is appropriate in the case of weight control athletes [413]. As for methods of weight control, weight class athletes fast, restrict fluid intake, train in plastic suits and saunas, as well as diet and exercise [56811]. In addition, many weight class athletes try to lose weight in a short time period [212]. Weight loss in a short time (e.g., more than 5% loss of body weight within 1 week) has adverse effects on aerobic endurance, body function (e.g., cardiovascular, respiratory, and renal function), emotions, and overall sport performance [41415].
In order to help athletes adopt desirable weight control practices, factors related to weight control need to be examined. Psychosocial theories suggest ways of examining factors related to health behaviors [161718]. Constructs such as beliefs and self-efficacy regarding behavior, have been suggested in the Social Cognitive Theory (SCT) and the Theory of Planned Behavior (TPB). Beliefs (outcome expectations in the SCT, behavioral beliefs in the TPB) are the perceived advantages or disadvantages of performing a certain behavior. Self-efficacy indicates the perceived ability to perform the behavior and is known as an important predictor of health behaviors [161718]. Studies on athletes reported that self-efficacy positively influences exercise adherence [1920].
Previous nutritional studies on weight class athletes have mostly focused on weight control status [821] and nutrient intakes during different time periods [7810]. There have been few studies, however, that have examined weight control practices and psychosocial factors (i.e., beliefs, self-efficacy) in college weight class athletes. This study was conducted to examine weight control practices as well as to investigate whether or not weight control practices, beliefs regarding rapid weight loss, self-efficacy for eating behaviors and weight control, eating behaviors during training, and weight control period differ according to weight control level in college weight class athletes. This study will provide baseline information for developing education programs for desirable weight control in college weight class athletes.
SUBJECTS AND METHODS
Subjects
Subjects for this study were weight class athletes recruited from two colleges in Gyeong-gi province, Korea. The colleges contacted for the study had weight class athletes in taekwondo, judo, and boxing. After getting permission from coaches, investigators explained the study to the athletes, and those who were willing to participate in the survey provided written informed consent. Subjects were also informed that they could withdraw from the study if they were not willing to respond to the survey questionnaire. Data were collected by self-report from 182 weight class athletes. Excluding the data on athletes who were not weight-classed (e.g., taekwondo poomsae) or did not control their weight as well as those who responded incompletely to major study variables (i.e., weight control practices), data from 151 athletes (completion rate: 83.0%) were used for the statistical analysis. The survey was done during 2016. This study was approved by the Institutional Review Board of Seoul Women's University (IRB-2015A-37).
Measurements
The survey questionnaire was developed by literature review regarding weight control in weight class athletes [561121222324]. The questionnaire draft was revised based on comments from sports nutrition professionals. The survey questionnaire included items measuring general characteristics, weight control practices, beliefs regarding rapid weight control, self-efficacy for eating behaviors and weight control, eating behaviors during training period and weight control period (1 week before competition), and dietary intakes during different time periods. Results on dietary intakes in male athletes were previously reported [25].
General characteristics included items such as age, gender, height, weight, grade, sports type, and age of starting sports [2122]. Weight control practices were examined by items, including starting age of weight control, frequency of weight control per year, duration of weight reduction before competition, magnitude of weight reduction per trial, maximum weight reduction, appropriate degree of weight reduction, education experience regarding weight control, methods used for weight control, and satisfaction with weight control methods [5611212226].
Items for assessment of beliefs regarding rapid weight control were developed based on the literature [2728]. These included advantages (e.g., playing a match in desired weight class, increased speed/flexibility, and increased concentration for sports during training) and disadvantages of weight control in a short time (e.g., difficulty in eating a variety of foods, reduced digestibility, deteriorating cognitive ability and situational judgment, increased risk of injury, and making me unhealthy). These items were rated on a 5-point scale ranging from ‘strongly disagree’ (1) to ‘strongly agree’ (5) to indicate the strength of these beliefs. Total score for beliefs was defined as the summated score of eight beliefs, while reversely coding the score on the disadvantages of weight control. The higher total score indicated having more favorable beliefs toward rapid weight control. The Cronbach's alpha for beliefs regarding rapid weight control was 0.76.
Items for self-efficacy were made to measure the perceived confidence in performing specific eating behaviors and weight control using appropriate methods, based on the literature [232930]. Five items were used to measure self-efficacy, including perceived confidence in ‘eating low calorie foods instead of high calorie foods’, ‘food selection for snacks’, 'resisting eating high calorie foods in tempting situations’, ‘controlling excessive overeating/binge eating after matches’, and ‘making weight within weight class by gradual dieting and exercise’. These items were measured on a 5-point scale ranging from ‘very difficult’ (1) to ‘very easy’ (5). Total score for self-efficacy was the summated score of five self-efficacy items. The higher total score for self-efficacy indicated having more confidence in performing eating behaviors related to weight control. The Cronbach's alpha for self-efficacy was 0.71.
Items for eating behaviors consisted of 16 items [243132]. These included four items on general eating behaviors (e.g. eating regularly, eating an adequate amount of meals, eating a variety of foods, and having breakfast), seven items on eating foods in foods groups (e.g., grains, protein foods, vegetables, dairy products, etc.), and five items on undesirable eating behaviors (e.g., eating foods high in fat, sodium, sugar, processed/instant foods, etc.). Eating behaviors were measured during both the general training period and weight control period (1 week before competition). These items were measured by asking subjects to check on the categories (0–2 days, 3–5 days, 6–7 days a week) that applied to them. To calculate the total score for eating behaviors, each item was coded from 1 (0–2 days a week) to 3 (6–7 days a week). Total score for eating behaviors was the summated score of 16 eating behaviors, while reversely coding the score on undesirable eating behaviors. The higher total score for eating behaviors indicated having more desirable eating behaviors. The Cronbach's alpha for eating behaviors was 0.57 during the training period and 0.53 during the weight control period.
Statistical analysis
Data were analyzed using SPSS (PASW Statistics 21.0; SPSS Inc., Chicago, IL, USA). Subjects were categorized into two groups by weight control level, ‘High Weight Loss (HWL, > 5% loss of body weight)’ and ‘Normal Weight Loss (NWL, ≤ 5% loss of body weight)’. Group categorization was performed based on the literature, which has shown that the appropriate level of weight control for athletes is about 5% or less of body weight [1413] and that rapid weight loss (> 5% loss of body weight in a short time) adversely affects normal growth, aerobic and anaerobic exercise capacity, competitive performance, and psychological function [4131433]. T-test, analysis of covariance (ANCOVA), or χ2-test was used to examine differences in weight control practices, beliefs regarding rapid weight control, self-efficacy, eating behaviors during training period, and eating behaviors during weight control period by weight control level. Multiple logistic regressions were employed to examine the association of factors (i.e., beliefs, self-efficacy, and eating behaviors) to weight control while adjusting for demographic covariates. Multiple logistic regressions were performed at two different levels: total score and subscales of beliefs, self-efficacy, and eating behaviors. Factor analysis was performed to find the subscales. Statistical significance was examined at P < 0.05.
RESULTS
General characteristics of subjects by weight control level
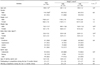
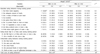
Mean age of subjects was 19.8 years, and 72.8% were male athletes (Table 1). About 72.8% (110 athletes) were categorized into the HWL group, whereas 27.2% (41 athletes) were in the NWL group. The mean height, weight, and body mass index (BMI) of male subjects were 178.0 cm, 74.3 kg, and 23.4 kg/m2, respectively. The mean weight (P < 0.01) and BMI (P < 0.01) of male subjects were significantly lower in the HWL group than the NWL group. The mean height, weight, and BMI of female subjects were 168.3 cm, 63.1 kg, 22.3 kg/m2, respectively, and these were not significantly different by weight control level.
About 61.6% of respondents were taekwondo athletes, 26.5% were judo athletes, and 11.9% were boxers; distribution of sports type was significantly different by weight control level (P < 0.05). Subjects started their sport at 12.3 years of age, on average. They competed 5.3 times and won the competitions 2.4 times during the last 12 months, which were not statistically different by weight control level (Table 1).
Weight control practices of subjects by weight control level
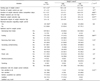
Subjects started weight control at 15.7 years of age, on average (Table 2). After considering demographic covariates that were significantly related to weight control level in Table 1, it was shown that subjects in the HWL group practiced weight control more frequently than the NWL group (P < 0.01). Duration of weight reduction before competition (P < 0.001), magnitude of weight reduction per weight control trial (mean: 5.9 kg vs. 2.7 kg, P < 0.001) and maximum weight reduction per trial (mean: 8.0 kg vs. 6.1 kg, P < 0.001), and appropriate degree of weight reduction (P < 0.001) were also significantly higher in the HWL than the NWL group. Only 19.2% of subjects received education regarding weight control (Table 2).
Subjects used ‘decreasing food intake’ (92.1%), ‘increasing activity/training’ (80.1%), ‘wearing plastic suits’ (73.5%), and ‘fasting’ (72.8%) to lose weight (Table 2). Significantly higher percentages of subjects in the HWL than the NWL group used inappropriate methods such as ‘fasting’ (P < 0.001), ‘restricting fluid intake’ (P < 0.01), ‘wearing plastic suits’ (P < 0.05), ‘sauna’ (P < 0.05), and ‘diuretics/laxatives’ (P < 0.05). About 34.5% of the HWL group, compared to 7.3% of the NWL group, were ‘not satisfied at all’ or ‘not satisfied’ with the weight control methods that they used (P < 0.001).
Beliefs regarding rapid weight control by weight control level
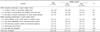
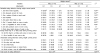
Total score for beliefs regarding rapid weight control (possible score: 8–40) was 23.2, which was 58.0 out of 100 (Table 3). Total score for beliefs regarding rapid weight control was significantly lower in the HWL group than the NWL group (P < 0.05).
When examined by each belief item using ANCOVA, three out of the eight beliefs were significantly related to weight control level. Subjects in the HWL compared to the NWL group, agreed more strongly on the disadvantages of rapid weight loss, including ‘difficulty in eating a variety of foods’ (P < 0.01), ‘making me unhealthy’ (P < 0.01), and ‘deteriorating cognitive ability and situational judgment’ (P < 0.05). In contrast, none of the beliefs regarding advantages of rapid weight loss was significantly different between the HWL and NWL groups (Table 3).
Self-efficacy regarding eating behaviors and weight control by weight control level
Total score for self-efficacy (possible score: 5–25) was 14.9, which was 59.6 out of 100 (Table 4). The ANCOVA results show that the total score for self-efficacy was significantly lower in the HWL group than the NWL group (P < 0.01). Two out of five self-efficacy items differed significantly by weight control level after considering the covariates of age, BMI, and sports type. Subjects in the HWL compared to the NWL group, perceived less self-efficacy in ‘controlling overeating/binge eating after matches’ (P < 0.001), and ‘making weight within the desired weight class through gradual dieting and exercise’ (P < 0.05).
Eating behaviors during training and weight control periods by weight control level
Total score for eating behaviors during training period (possible score: 16–48) was 30.3, which was 63.1 out of 100. There was no significant difference in total score of eating behaviors during training period between the HWL and NWL groups (Table 5). When each eating behavior in both groups was examined, percentages of those who showed desirable eating behaviors during training period such as eating meals regularly, eating an adequate amount of meals, and adequate consumption of foods in food groups were low. None of the 16 eating behaviors during training period were significantly different between the HWL and NWL groups (Table 5).
Total score for eating behaviors during weight control period (possible score: 16–48) was 28.4, which was 59.2 out of 100. Total score for eating behaviors of the HWL group was significantly lower than that of the NWL group when considering covariates of age, BMI, and sports type (27.8 vs. 30.2, P < 0.001). Twelve out of the 16 eating behaviors during weight control period were significantly different by weight control level (Table 6). Percentages of those who performed desirable behaviors (3–7 days a week before competition) were significantly lower in the HWL group than the NWL group. These differences were noted in behaviors such as ‘eating adequate amount of meals’ (P < 0.001), ‘eating grains three times a day’ (P < 0.001), ‘eating three meals regularly’ (P < 0.001), ‘eating a variety of foods at meals’ (P < 0.001), ‘eating protein foods at meals’ (P < 0.001), ‘drinking about eight glasses of water a day’ (P < 0.001), ‘having breakfast’ (P < 0.01), and ‘eating vegetables at meals’ (P < 0.01). In contrast, percentages of those who performed undesirable eating behaviors infrequently (0–2 days a week before competition) were significantly higher in the HWL group than the NWL group. More specifically, 83.6% and 82.7% of the HWL group consumed fatty foods and spicy/salty foods infrequently, respectively, compared to 56.1% of the NWL group (P < 0.01). Those who ate processed foods/instant foods and caffeinated beverages infrequently were 70.9% in the HWL group and 48.8% in the NWL group (P < 0.05).
Association of beliefs, self-efficacy, and eating behaviors to weight control level
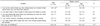
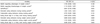
Multiple logistic regression results at the total score level of variables are shown in Table 7. After adjusting for demographic variables of age, BMI, and sports type, self-efficacy regarding eating behaviors and weight control (OR = 0.846, 95% CI: 0.730, 0.980) as well as eating behaviors during weight control period (OR = 0.731, 95% CI: 0.620, 0.863) were found to be associated with a significantly decreased risk of being in the HWL group. In contrast, eating behaviors during training period (OR = 1.285, 95% CI: 1.112, 1.485) were related to a significantly increased risk of being in the HWL group.
Based on the factor analysis, two subscales of beliefs, a self-efficacy scale, and three subscales of eating behaviors during training period and weight control period, respectively, were obtained. These included beliefs regarding advantages of weight control (three items, Cronbach's α = 0.66), beliefs regarding disadvantages of weight control (five items, α = 0.73), self-efficacy (five items, α = 0.71), desirable eating behaviors (nine items, α = 0.78 for training period, α = 0.84 for weight control period,), undesirable eating behaviors (five items, α = 0.70 for training period, α= 0.79 for weight control period), and eating foods high in ω3 fatty acids (two items, α = 0.68 for training period, α = 0.63 for weight control period). Table 8 shows multiple logistic regression results at subscale levels. After controlling for age, BMI, and sports type, self-efficacy regarding eating behaviors and weight control (OR = 0.847, 95% CI: 0.720, 0.996) as well as desirable eating behaviors during weight control period (OR = 0.688, 95% CI: 0.564, 0.840) were associated with a significantly decreased risk of being in the HWL group. Desirable eating behaviors during training period (OR = 1.202, 95% CI: 1.016, 1.421) were associated with a significantly increased risk of being in the HWL group.
DISCUSSION
This study examined whether or not weight control practices, beliefs, self-efficacy, and eating behaviors during training period and weight control period differ by weight control level in college weight class athletes. Subjects showed an average of 7.2% reduction in body weight when they tried weight control (not shown in Tables), and 72.8% of athletes reduced more than 5% of their body weight. Similarly, Kim et al. [21] found that weight-classed athletes lost 6.5% of their body weight. Previous studies have reported that weight class athletes showed an average body weight reduction of 2.5%–5.4% [61112], which is lower than that of the current study. In a study on adolescent weight class athletes, Park et al. [34] reported that an 8% body weight reduction significantly decreased cardiovascular function capacity while a 3% body weight reduction did not, suggesting the optimal level of weight reduction. Similar to a previous study [8], it seems that subjects tried weight control before each competition, based on the finding that subjects participated in competitions 5.3 times and attempted weight control 5.1 times per year, on average. Subjects lost an average of 5.0 kg when they attempted weight control, and the magnitude of weight loss was significantly greater in the HWL than the NWL group (P < 0.001). Similarly, Brito et al. [11] reported that judo athletes reduced an average of 5.6 kg during the competitive week.
Subjects began weight control at the age of 15.7 years, which is similar to that reported in previous studies (14.0–16.5 years) [51121]. Athletes in the HWL and NWL groups practiced weight control for an average of 12.6 days and 7.3 days before competition, respectively (P < 0.001), suggesting that weight loss was performed within a short time. Lee et al. [35] found that 57.5% of adolescent taekwondo athletes tried weight loss within 1 week before competition, whereas only 16% of them reduced weight gradually over 2–3 weeks before competition. As for methods of weight control, a higher percentage of subjects in the HWL than the NWL group used inappropriate weight control methods such as fasting, restricting fluid intake, and saunas. Consistently, previous studies have reported that weight class athletes excessively performed weight loss using methods such as skipping meals, restricting fluids, training with plastic suits, and saunas [6112135]. Rapid and continuous weight loss in weight class athletes might cause malnutrition, loss of minerals due to dehydration, decreases in athletic performance, and physical injuries [436]. Inappropriate use of weight control methods might be related to dissatisfaction with weight control methods in the HWL group. Study results show that only 19.2% of athletes received education regarding weight control, which is lower than that reported in previous studies [2135]. Results regarding weight control practices have suggested that education regarding appropriate weight control in weight class athletes is urgently needed.
The significant association between beliefs regarding rapid weight control and weight control level disappeared in the multiple logistic regression models, suggesting that beliefs regarding rapid weight control might be less important in explaining weight control level than other factors such as self-efficacy and eating behaviors during weight control period. When examined by each belief item, athletes in the HWL group agreed more strongly on the disadvantages of rapid weight loss than the NWL group. This suggests that athletes in the HWL group tried to lose weight even though they acknowledged the disadvantages and adverse effects of rapid weight loss. This might be due to the perception that rapid weight loss and competing at a lower weight class resultantly increases the possibility of winning. Therefore, it is urgent to educate college weight class athletes on the reality that rapid weight loss does not necessarily lead to better athletic performance and winning [37], in addition to the adverse effects of rapid weight loss. Instead, advantages and tips related to proper weight control through gradual diet and exercise need to be emphasized.
Self-efficacy was found to be important in differentiating the HWL and NWL groups. The odds ratio for HWL was 0.85 with unit increase in self-efficacy score. It seems that athletes in this study were not confident in maintaining adequate eating behaviors related to weight control, based on their total score for self-efficacy (59.6 out of 100). In addition, subjects in the HWL group compared to the NWL group were less confident regarding specific self-efficacy (controlling excessive overeating/binge eating after matches and making weight within their weight class through gradual dieting and exercise) as well as total self-efficacy. These results support the notion that self-efficacy is important in performing a behavior (e.g., adequate weight control). Consistently, Kang & Kim [38] observed that self-efficacy was a strong predictor of older adults' physical activity, followed by perceived exercise benefits, family support, and physical environment. In a study on college female athletes, dietary self-efficacy and nutrient intakes (e.g., carbohydrate, fiber) were significantly elevated after nutrition education programs focused on self-efficacy [39]. These study results imply that education programs need to focus on increasing self-efficacy by providing strategies to adopt desirable eating behaviors (e.g., methods for gradual adoption of proper eating habit, methods for step-by-step dieting and exercise, resisting temptations to overeat after matches, etc.). Self-efficacy might be elevated through methods such as providing opportunities to perform a behavior, indirect experience (e.g., modeling), persuasion, and praise [18].
This study shows that eating behaviors of college weight class athletes were generally inadequate during training period as well as pre-competition period. Based on multiple logistic regression analyses, it was shown that eating behaviors during training period as well as weight control period were associated with a specific weight control group (HWL vs. NWL). The odds for HWL increased with an increased score for eating behaviors during training period, whereas the odds for HWL were reduced with an increased score for eating behaviors during weight control period. In addition, it seems that the association of eating behaviors to weight control group was mainly due to differences in desirable eating behaviors during each period (e.g., eating meals regularly, eating adequate amounts, eating a variety of foods, and adequate consumption of foods in food groups) based on the finding of subscale level analysis of the multiple logistic regression.
Athletes in the HWL group practiced inadequate eating behaviors, especially during weight control periods. This might be due to excessive dieting or fasting to make weight. Consistent with the current study, previous studies have reported the undesirable eating behaviors of weight-classed athletes [71026]. Specifically, intakes of energy and nutrients of weight-classed athletes were significantly reduced before competition and increased after competition [7]. Fleming & Costarelli [10] also reported that weight class athletes consumed a suboptimal diet both at ordinary times and during pre-competition, and intakes of energy, carbohydrates, calcium, and sodium during pre-competition were significantly lower than that at ordinary times. In a study on adolescent taekwondo athletes, Jung et al. [40] reported that consumption of foods such as protein-rich foods and processed foods was reduced during training period before competition compared to usual training period. Restriction of food intakes during the weight control period might lead to overconsumption of foods after competition, causing weight cycling commonly found in weight class athletes.
The limitation of this study is that the study results are based on a convenient sample of college weight class athletes in Gyeong-gi Province, Korea. Therefore, the study findings might not be generalized to different groups of weight class athletes. In future research, factors related to weight control might be broadened to include environmental influences.
In summary, this study shows that college weight class athletes practiced weight loss inappropriately. Use of weight control methods, such as restricting fluid intake and using plastic suits and saunas, were more prevalent in the HWL compared to NWL group. Self-efficacy, eating behaviors during training period, as well as eating behaviors during weight control period were also significantly associated with weight control group. Based on this study, nutrition education for college weight class athletes should be provided to make weight by using appropriate weight control methods in collaboration with tailored, gradual weight loss approaches. Further, information regarding the adverse effects of rapid weight loss and use of inappropriate weight control methods is needed. Education programs also need to include strategies to increase self-efficacy as well as methods to alter eating behaviors before competition, especially for those who try lose weight rapidly.

 XML Download