

 PDF
PDF ePub
ePub Citation
 Print
Print


INTRODUCTION
There have been inconsistent reports on the association between serum vitamin D levels and the risk of hypertension (HTN). Meta-analyses of prospective studies [12] and cross-sectional studies [1] have shown that low vitamin D levels are associated with an increased risk of HTN. In contrast, a meta-analysis of 30 randomized controlled trials failed to show evidence of an association, suggesting that vitamin D supplementation may not result in an overall reduction in the blood pressure (BP) value [3]. Therefore, it remains unclear whether the role of vitamin D in BP and HTN is causal.
Estimates derived from observational studies may be biased because of confounders (environmental and behavioral), systematic error, and/or reverse causation [12]. For example, the association between serum 25-hydroxyvitamin D [25(OH)D] levels and HTN could be explained by other factors (e.g., obesity) that affect serum 25(OH)D levels and HTN risk [145]. These factors may confound the association between serum 25(OH)D levels and HTN, giving biased results. Even after appropriate adjustments, we were unable to eliminate the effect of all the potential confounders. Moreover, several studies have suggested that low serum 25(OH)D levels result from disease progression, indicating the possibility of reverse causality [6]. Low serum 25(OH)D levels can be influenced by HTN onset, indicating the possibility of reverse causation [67]. Furthermore, several studies have suggested that serum 25(OH)D levels are a marker, rather than a cause, of disease outcome [89].
The mendelian randomization (MR) approach was proposed to strengthen the causal inferences using genetic variants associated with an exposure phenotype as instrumental variables (IVs) [101112]. This approach is based on Mendel's laws of segregation and independent assortment; this law states that genetic variants are randomly allocated during meiosis and these genetic variants are unlikely to be influenced by factors that bias observational studies. Therefore, the effect estimates from MR analyses are unlikely to be confounded. Reverse causation is also unlikely, because the outcome (i.e., HTN) does not determine which 25(OH)D-associated single nucleotide polymorphisms (SNPs) is inherited.
A recent large European MR study concluded that higher serum 25(OH)D levels predicted using a 25(OH)D synthesis score (DHCR7 rs12785878 and CYP2R1 rs12794714,) are associated with lower BP value and a lower risk of HTN [13]. In another study on a European population, a similar pattern of association was found with genetic variants in regions related to 25(OH)D metabolism (CYP24A1) [14]. However, the role of vitamin D in cardiovascular health, including BP and HTN, in Korean population is unclear because most studies have focused on European population. Further, to our knowledge, no study has investigated the relationship between serum vitamin D levels and BP using the MR approach in the Korean population.
Here, we investigated the association of serum vitamin D levels with the HTN risk in 2,591 Korean subjects using the MR approach. We used five SNPs (DHCR7 rs12785878 Chr.11: 71456403; CYP2R1 rs10741657 Chr.11:14893332; CYP2R1 rs1279 4714 Chr.11:14892029; CYP24A1 rs6013897 Chr.20:54125940; and GC rs2282679 Chr.4:71742666,) that were identified a priori from previous genome-wide association studies (GWASs) [1516] and MR studies of vitamin D [17181920], as IVs for 25(OH)D levels because they had the potential to satisfy the assumptions of MR and these variants reportedly account for a large proportion of the difference in serum 25(OH)D levels [152122]. These SNPs are related to the genes known to affect synthesis (DHCR7: endogenous production; CYP2R1: liver conversion) and metabolism (CYP24A1: degradation of vitamin D, GC: transportation of vitamin D to target cells) of 25(OH)D. Previous MR studies have used these SNPs as IVs to verify the causal effects of vitamin D on the risk of multiple diseases including type 2 diabetes [17], multiple sclerosis [18], and ovarian cancer [19] in European and Chinese populations.
SUBJECTS AND METHODS
Study participants
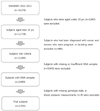
We used data from the Korea National Health and Nutrition Examination Survey (KNHANES) 2011-2012, a nationally representative cross-sectional survey conducted by the Korea Centers for Disease Control and Prevention. A stratified multistage probability sampling design was used to obtain a nationally representative sample of Korean subjects based on the geographical area, sex, and age from a household registry. The KNHANES comprises the following three different sections: health examination, health interview, and nutrition survey. Detailed information on the KNHANES is available elsewhere [23]. Among the 16,576 participants (8,518 participants in 2011 and 8,058 participants in 2012), those aged < 20 years were excluded. We also excluded participants who had been diagnosed with cancer and women who were pregnant or lactating. After further excluding participants with missing or insufficient DNA samples (n = 9,445), 2,600 eligible participants were available for genotyping. Of these, nine with had missing values in their genotype data or BP measurements were excluded. Finally, 2,591 participants (490 participants in 2011 and 2,101 participants in 2012) were included in the analyses (Fig. 1). The study protocol was approved by the institutional review board of the Korea University (KU-IRB-16-EX-272-A-1).
Basic characteristics
Sociodemographic data and lifestyle information were obtained using a health interview questionnaire, that included questions regarding sex, age, education level, smoking status, current drinking status, physical activity, and use of antihypertensive medication. The education level was categorized as follows: completed elementary school, middle school, high school, or university education. The smoking status was classified into the following four groups: never-smoked, former smoker, smokes sometimes, and smokes every day. The drinking experience was classified as “no experience of drinking (no)” or “experience of drinking (yes).” To obtain information on physical activity, the participants were asked to report the time spent on walking, moderate activity, and vigorous activity. Physical activity was defined as participation in any of the following activities: walking for 30 min per day for at least 5 days/week, moderate activity for 30 min per day for at least 5 days/week, or vigorous activity for 20 min per day for at least 3 days/week. Use of antihypertensive medication was defined as taking antihypertensive medication at least once a month. Anthropometric information was obtained from the results of a health examination. Height and weight of the participants were measured by trained medical personnel as per standardized protocols. Body mass index (BMI) was calculated by dividing the weight in kilograms by the square of the height in meters (kg/m2). To measure biochemical markers, blood samples were collected after an 8-h fast. Serum triglyceride (TG; mg/dL), total cholesterol (TC; mg/dL), high-density lipoprotein cholesterol (HDL-C; mg/dL), fasting blood glucose (FBG; mg/dL), aspartate aminotransferase (AST; IU/L), and alanine aminotransferase (ALT; IU/L) levels were measured using enzymatic methods and a Hitachi automatic analyzer 7600 (Tokyo, Japan). Low-density lipoprotein cholesterol (LDL-C) levels were calculated according to the following equation: LDL-C (mg/dL) = TC (mg/dL) − HDL-C (mg/dL) − {[TG (mg/dL)/5] (TG < 400)} [24]. Glycosylated hemoglobin (HbA1c; %) was measured using high-performance liquid chromatography (HLC-723G7; Tosch, Tokyo, Japan).
Measurement of serum 25(OH)D levels
Blood samples were collected after an 8-h fast and immediately processed, refrigerated, and transported to the central testing institute (NeoDIN Medical Institute, Seoul, Korea). Serum 25(OH)D levels were measured within 24 h using radioimmunoassay (RIA) using a 1470 WIZARD gamma-counter (PerkinElmer, Turku, Finland) and a 25-Hydroxyvitamin D 125I RIA Kit (DiaSorin, MN, USA). In the present study, serum 25(OH)D levels were considered sufficient if they were ≥ 30 ng/mL, insufficient if they were between 20 ng/mL and 30 ng/mL, deficient if they were between 10 ng/mL and 20 ng/mL, and severely deficient if they were < 10 ng/mL [25]. Participants were divided into the following four groups based on their serum 25(OH)D levels: severe deficiency, deficiency, insufficiency, and sufficiency of serum 25(OH)D levels.
BP and hypertension
Measurement of BP was performed by a trained technician using a mercury sphygmomanometer (Baumanometer, NY, USA). The BP was measured three times on the right arm, and the average values of the second and third readings were recorded as the systolic BP (SBP) and diastolic BP (DBP) measurements. Those with a self-reported history of physician-diagnosed HTN, BP >140/90 mmHg, or on antihypertensive medication were defined as having HTN.
Genetic variants
Five well-known serum 25(OH)D-related SNPs (DHCR7 rs1278 5878; CYP2R1 rs10741657 and rs10741657; CYP24A1 rs6013897; and GC rs2282679) were selected from a previous GWAS [15] and MR studies [4131718192026]. DNA samples were extracted from the blood samples at the time of blood collection. Three vials of DNA samples (20 ug per vial) in ethylenediaminetetraacetic acid (EDTA) tube were stored in a deep freezer at −70℃. In 2017, about 6–7 years after the blood collection, we obtained 300 ng DNA samples from the National Biobank of Korea where the DNA samples were stored for genotyping [27]. Genotyping for rs12785878 (DHCR7), rs10741657 and rs12794714 (CYP2R1), and rs6013897 (CYP24A1) was performed using a SNP type assay (Fluidigm, San Francisco, CA, USA), as per the manufacturer's instructions at DNALINK, INC (Seoul, Korea). Genotyping of rs2282679 (GC) was further analyzed using the TaqMan assay method with a TaqMan fluorogenic 5??nuclease assay (ABI, Foster City, CA, USA). Detailed methods of genotyping are described elsewhere [2829].
Statistical analysis
All the statistical analyses were performed using Stata MP 13 (Stata Corp LP, TX, USA). Data are reported as mean ± standard error values for the continuous variables and as number of counts and percentages for the categorical variables. Differences in the characteristics were evaluated using one-way analysis of variance (ANOVA) for continuous variables and chi-squared test for categorical variables. The effect allele frequency was calculated according to the following formula: (counts of heterozygotes + 2 × homozygotes of effect allele)/(2 × total counts). The strength of the associations between serum 25(OH)D levels and IVs was tested using the F-statistic. We conducted both observational and MR analyses to examine the relationships of serum 25(OH)D with HTN and BP values. The observational analysis for the associations between serum 25(OH)D levels and HTN/BP was conducted using the ordinary least squares (OLS) estimation method (in logistic regression models and linear regression models, respectively), adjusted for sex, age, BMI, education level, smoking status, drinking experience, physical activity, and use of antihypertensive medication as confounders. In the MR analysis, the effects of serum 25(OH)D levels on HTN/BP were estimated using an IV analysis with the two-stage least squares method. In the first stage, the association of individual genetic variants with serum 25(OH)D levels was tested in an additive model. The fitted serum 25(OH)D levels were then regressed on HTN/BP in the second stage. In the secondary analyses, we created a composite genetic risk score (GRS) (range 0–9) to assess the polygenic contribution of the loci associated with serum 25(OH)D by summing the number of 25(OH)D-increasing alleles across the five SNPs. Weighted GRS (wGRS) (range 0–9.5) was created by weighing each allele by its effect size reported in a previous GWAS [30]. We further created two separate function-based GRSs: synthesis score (range 0–6) using three SNPs relevant for synthesis of 25(OH)D (DHCR7 rs12785878, CYP2R1 rs10741657 and rs12794714;) and metabolic score (range 0–4) using two SNPs associated with transfer and clearance of 25(OH)D (CYP24A1 rs6013897, GC rs2282679). Results are presented as odds ratios (ORs) and 95% confidence intervals (CIs) for HTN and β coefficient and 95% CIs for BP.
RESULTS
General characteristics according to the serum 25(OH)D levels
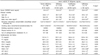
Total 2,591 participants with both genetic and serum vitamin D data were included in our analyses. The basic characteristics of the study participants included are shown in Table 1. The prevalence of vitamin D sufficiency (serum 25(OH)D ≥ 30 ng/mL) was very low (n = 71; 2.7%). There were differences in the age, sex, BMI, education level, smoking status, and use of antihypertensive medication among the groups stratified as per the serum 25(OH)D levels. However, there were no differences in their drinking experience and physical activity levels. Analyses of the biochemical risk markers showed that TC, FBG, HbA1c, AST, and ALT levels were different among the serum 25(OH)D groups. However, these differences were attenuated after adjustment for sex and age (data not shown).
General characteristics as per the genotype of serum vitamin D-related SNPs
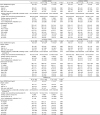
Genotypes are randomly assigned at conception; therefore, IVs are unlikely to be related to the potential confounders. To confirm the lack of association between the IVs and the potential confounders (one of the assumptions for IV), we compared the distributions of the participant characteristics by genotypes (Table 2). For each SNP, the potential confounders such as age, sex, BMI, education level, smoking status, drinking experience, physical activity, use of antihypertensive medication, and biochemical risk markers did not differ by genotypes.
Association between the vitamin D-related SNPs and serum 25(OH)D levels
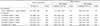
Table 3 summarizes the genetic information of the five vitamin D-related SNPs. Serum 25(OH)D-increasing alleles were termed effect alleles, and their frequencies are presented. For all five SNPs, 25(OH)D-increasing alleles were positively associated with serum 25(OH)D levels, as shown by β coefficients. Of these, the associations were strongest for rs2282679 (per allele: β = 0.639 ng/mL, F-statistics = 14.31, P < 0.001) and rs12785878 (per allele: β = 0.579 ng/mL, F-statistics = 13.34, P < 0.001). Other three SNPs (rs10741657, rs12794714, rs6013897) had F-statistics < 10, demonstrating the possibility of weak instrument bias.
Association of the serum 25(OH)D levels with HTN and elevated BP: Observational and MR estimates
The association between circulating 25(OH)D levels and HTN is presented in Table 4. In the observational analysis, serum 25(OH)D levels were associated with a decreased prevalence of HTN (per 1 ng/mL increase: OR: 0.97, 95% CI: 0.94, 0.99) in the OLS models. SBP was inversely associated with serum 25(OH)D levels (β: −0.13 mmHg, 95% CI: −0.24, −0.03); however, DBP did not show such an association. The MR analysis showed no strong pattern of association between the serum 25(OH)D levels and HTN using individual SNPs as IVs. Although the CIs were wide, genetically determined serum 25(OH)D levels tended to be inversely associated with SBP but not with DBP. For rs6013897 (CYP24A1), the association tended to be inverse with both HTN (OR: 0.76, 95% CI: 0.26, 2.25) and BP (β: −5.46 mmHg, 95% CI: −23.7 to 12.8 for SBP; β: −2.08 mmHg, 95% CI: −10.1 to 5.93 for DBP). Similar results were observed for the GRSs (Supplementary Table 1 and 2).
DISCUSSION
The main finding of this study was that there was no association between the serum 25(OH)D levels and HTN in Korean population in a framework of MR. However, our observational analyses from the same data showed that serum 25(OH)D levels were inversely associated with both HTN and SBP, consistent with the findings from other observational studies [12829]. A cross-sectional analysis of the KNHANES 2009–2012 data showed an inverse association between vitamin D levels and HTN in young and middle-aged Korean women (OR: 0.93, 95% CI: 0.58, 0.91) [31]. In another study on middle-aged Korean adults, 3,234 participants with normal BP were followed up for 4 years and those with serum vitamin D levels less than the median value had a higher risk of HTN (OR: 2.74, 95% CI: 1.40, 5.34) [32]. Similarly, most studies in Western populations have reported an inverse association between the serum 25(OH)D levels and incident HTN [233]. However, results from these observational analyses are prone to bias because of confounding factors and reverse causation.
The lack of association between genetically determined serum 25(OH)D and HTN observed in the present study is inconsistent with results from previous MR studies of European and North-American populations that report a favorable association between an increase in genetically instrumented 25(OH)D levels with HTN and BP values [1314]. The difference in the associations may be explained by the biological differences in the ability of vitamin D synthesis and metabolism among different racial groups [34]. Awumey et al. [35] reported that Indians have altered vitamin D endocrine systems and lower serum 25(OH)D levels than Caucasians. The lack of association with HTN in our study can also be explained by the limited sample size and possible weak instrument bias. Our data showed that three of five SNPs (rs10741657, rs12794714, rs6013897) were only weakly associated with the serum 25(OH)D levels (F-statistics < 10); thus, these SNPs may have been weak instruments leading to underestimation of the associations with HTN. Using BP as an outcome, we found a general tendency for inverse associations between genetically determined vitamin D levels and SBP, possibly due to an increased power in the analyses using continuous variables. To overcome problems with weak instrument bias and increase the statistical power, we used GRSs (weighted GRS, synthesis score, and metabolism score) as IVs. The strength of the IV assessed using F-statistic was increased from 12.68 (metabolism score) to 27.18 (wGRS). However, the results of the GRSs analyses consistently disprove a causal role of vitamin D in BP.
Violation of the assumption of IVs (pleiotropy) can result in several biases [36]. Pleiotropy occurs when the genetic variant affects the outcome through biological pathways other than the targeted mechanism of interest. It has been reported that DHCR7 and CYP2R1 genes are valid for the assumption of exclusion restriction [21]. However, DHCR7 gene encodes enzymeconverting 7-dehydrocholesterol to cholesterol involved in cholesterol synthesis [2137], thus the possibility of pleiotropy cannot be completely ruled out. However, DHCR7 was not associated with the serum cholesterol level in our study (Table 2; P-value = 0.328), and a previous large GWAS study of blood lipid [38] did not identify genome-wide significant association with DHCR7 gene. CYP2R1 gene encodes the vitamin D 25-hydroxylase enzyme that converts vitamin D to 25(OH)D [39]. CYP2R1 is directly and biologically associated with the serum vitamin D levels; thus, it could be the best IV for MR studies on vitamin D [21]. Previous MR studies have demonstrated biological evidence of pleiotropy in two genes (CYP24A1 and GC) involved in the metabolism of vitamin D [1321]. These genes reportedly control the free vitamin D levels through a feedback-loop [40]. By examining the association between genotypes and biomarkers, we tested whether pleiotropy would occur in our study. Based on the results shown in Table 2, there was no significant association between genotypes and biomarkers except for serum vitamin D levels. This can partially support that these genes influence the outcome only through serum vitamin D levels. We additionally conducted the MR-Egger test for pleiotropy [41]. The results showed no evidence of pleiotropy according to the intercept of MR-Egger (P = 0.74).
To our knowledge, this is the first study to examine the causal effects of serum 25(OH)D levels on HTN and BP in a Korean population using the MR approach. This study has several strengths. In the MR analyses, bias due to confounding factors and reverse causation is likely to be reduced. The concept of randomly allocated genotypes at conception (Mendel's law of independent assortment) is similar to that in a randomized controlled trial, in which the exposure is randomly assigned to each group [42]. Within both frameworks, individuals are assigned to random groups with balanced distributions of factors that generally confound the relationship between serum vitamin D levels and HTN. In addition, MR is unaffected by reverse causation because of the clear temporal sequence between the genotype and the outcome. Our results showed that each IV was independent of the potential confounders that we evaluated, including age, sex, BMI, education level, smoking status, drinking experience, physical activity, and use of antihypertensive medication. Thus, our results are unlikely to be confounded by these factors, although we cannot eliminate the possibility of confounding even in MR analysis. Further, contrary to a single measurement of serum 25(OH)D level used in the observational analyses, genetically determined vitamin D level used in the MR analyses had a lower measurement error, was less likely to be influenced by season or region (e.g., latitude) in which the blood samples were collected, and was more likely to represent lifelong exposure levels of vitamin D. Despite these strengths, this study has certain limitations. Genetic variants used as IVs in our study were not selected from an East Asian GWAS because previous GWASs on serum 25(OH)D levels were limited to European and South Asian populations [15164344]. However, a recent MR study on a Chinese population has demonstrated the associations of these SNPs with circulating vitamin D levels [17], supporting the use of these SNPs as IVs in East Asian subjects. In this study on a Korean population, we also confirmed that each SNP was associated with the serum 25(OH)D levels and the directions of association were consistent with previous studies [1516].
In conclusion, this study does not support the causal effects of circulating 25(OH)D levels on HTN in Korean adults. The lack of association observed in the present MR study could be attributed to the relatively small sample size and possible weak instrument bias. However, to our knowledge, this is the only data set available for examining the associations among genotype, serum 25(OH)D levels, and HTN in the general Korean population. Our study contributes to the understanding of the association between serum 25(OH)D levels and prevalence of HTN, the prevalence of which has been continuously increasing in the Korean population. However, further MR studies with larger sample sizes are required for confirming the present results.

 XML Download