

 PDF
PDF ePub
ePub Citation
 Print
Print


INTRODUCTION
Nutrition surveys have been widely used to assess food and nutrient intake or dietary patterns of a specific target population [1]. Accurate methods to assess food or nutrient intake are necessary to manage daily personal dietary intake and to conduct academic nutritional research. Commonly used dietary assessment methods are 24 h recall, food frequency questionnaire (FFQ), and food records. Dietary assessments were traditionally completed using Pen-and-Paper interviewing (PAPI) and Computer-assisted Personal Interviewing (CAPI), which are heavily dependent on memory and cognition of the subject [1]. In addition, people may underreport their intake due to the recoding burden [2]. Table 1 is a summary of the features of representative nutrition survey methods.
Recently, a self-report method using a mobile device (e.g., smartphone) has been extensively used to assess dietary intakes. A mobile device camera is used to record meals before and after eating to provide a visual food record [3]. However, major concerns of this approach are associated with food recognition and intake volume (weight) estimation [45]. However, there are assessment tools available to help people identify their dietary intake. The Wellnavi is a dietary evaluation method based on a portable personal digital assistant device with a phone card and a camera [67]. The technology Assisted Dietary Assessment (TADA) image analysis tool is useful for identification and quantification of food intake in which images taken before and after food consumption are used to calculate the amount and type of food consumed [8]. The Remote Food Photography Method (RFPM) uses a smartphone to capture food images before and after consumption, and sends images to a server to provide an estimate of food intake [9]. A multisensor device, the eButton, worn on the chest uses a camera to manually capture all relevant images in front of the subjects [10]. Many of these tools are being improved and are in use in the food intake research field [11]. However, the tools have difficulty recognizing food and estimating the amount of food accurately [12].
Currently, in Korea, PAPI or CAPI-based nutrition surveys have been performed, but there is a growing demand for mobile device-based dietary assessment tools. However, Asian foods including Korean foods, include a greater variety of cooking methods and a higher number of ingredients than those in Western foods [13]. Furthermore, some similar Korean foods may look different while some entirely different Korean foods look very similar, which makes the identification of food items from images difficult [14].
Most dietary assessment methods using mobile devices have been used by dietitians to estimate intakes using food photographs taken before and after the meal [151617]. Many approaches to improving dietary intake amount estimation have been proposed [181920]. The vast majority of those techniques rely on hand-engineered features and traditional signal processing methods. For instance, DietCam [21] uses fusion of a nearest-neighbor based best match search and the SIFT-based Bag of Visual Words (BoW) classification methods to estimate daily food intake. Another food recognition system aimed to estimate the calorie and nutrition levels of foods [22]. The authors used segmented food item regions in order to increase the accuracy of their recognition system: a system that recognized foods based on information sources including the SURF-based Bag of Features and a color histogram extracted from the segmented food item regions. In addition, artificial Intelligence (AI)-based algorithms have been used to detect food items from images obtained from a wearable device [23]. For instance, the Deep Convolutional Neural Network (DCNN), a state-of-the-art technology, has been reported to have reliable results even on large and diverse image datasets with non-uniform image backgrounds [24]. The DCNN to recognize images and it provided accurate detection of food items [24].
The purpose of this study was to evaluate the applicability of food recognition model using DCNN in Korean food items. We undertook automatic Korean food classification using a new DCNN model that recognizes given images of Korean dishes and compared our results using various classification tasks with those from other popular models.
MATERIALS AND METHODS
Building a dataset for Korean food recognition
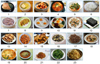
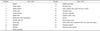
A localized image dataset is required to obtain accurate food item recognition results since foods vary by region [14]. To the best of our knowledge, there is no publicly available image dataset for Korean food item recognition. Therefore, we collected more than 4,000 food images by taking pictures of dishes in restaurants as well as by searching the Internet for web-based images. Sample images from the collected dataset are shown in Fig. 1. In order to build a dataset suitable for training the complex recognition model for Korean food images, we established 23 food groups based on the frequently consumed food list of the Korean National Health and Nutrition Examination Survey; the selected food class names are provided in Table 2.
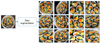
Since all images were collected from various sources, their format, resolution, and quality were different. Moreover, even though the number of collected images was more than 4,000, it was insufficient for use in training high quality deep-learning models. Therefore, to increase the dataset size, data augmentation and image processing techniques were performed on more than 4,000 collected images. Data augmentation methods were used to generate new images from a single image whereas the image processing techniques were used for improving the quality and reducing the similarity of the newly generated images. During data generation, random contrast, brightness, sharpness and color changes were added to each of the augmented images in order to decrease image similarity. As a result, the data size substantially increased. Examples of the artificially generated images are presented in Fig. 2. The final dataset contained 92,000 images. After the image collection and image processing were finished, the dataset was prepared for use in the learning process. All images were down-sampled to a fixed resolution of 150 × 150 and then randomly divided into training and testing groups at a ratio of 3:1, resulting in 69,000 training and 23,000 test images.
K-food network Structure
A Convolutional Neural Network (CNN) usually consists of convolutional layers and pooling layers [13]. Notations w and h represent width and height, ch is the RGB color channels of the input image I (w, h, ch). the convolutional layer and max-pooling are denoted as C and MP, the convolutional layer is C (k, cs, o) and takes kernel size (k), convolutional strides (cs), and the number of output feature maps is (o) as arguments. The pooling layer MP (r, ps) considers the side length of the pooling receptive field (r) and the pooling strides (ps). In addition, FC (c) and F (class) correspond to the fully-connected layer and the output layers, respectively, where (n) is the number of nodes and (c) is one of the food categories. Notation D stands for dropout. All convolutional layers use ReLU as an activation function. The DCNN model (M) is thus represented by:
M⇒ I (150, 150, 3) → C (9, 2, 32) → C (7, 2, 64) → [C (1, 1, 128), C (3, 2, 128), C (5, 2, 128)] → concat → [C (1, 1, 128), C (3, 2, 128), C (5, 2, 128)] → concat → MP (2, 2) → D → C (3, 2, 256) → MP (2, 2) → C (3, 2, 512) → MP (2, 2) → FC (2048) → D → FC (2048) → F (class).
The Softmax function (normalized exponential function) is defined as:

Where, Fj is the features of the output layer. The final prediction (Prediction) is gained from the maximum value of S(F)

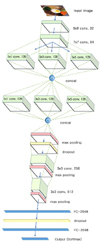
The schematic architecture of the DCNN used in this study is depicted in Fig. 3. In order to achieve improved performance we implemented a wider and deeper network. The initial layer receives 150 × 150 × 3 tensors (RGB values for a 150 × 150 × 3 image) as an input and produces 32 feature maps by convolving with the kernel size 9 × 9. A 7 × 7 kernel is used to convolve the previous output, resulting in 64 feature maps.
Subsequently, every map will be simultaneously convolved with 1 × 1, 3 × 3 and 5 × 5 convolutional kernels, in which, there are three separate layers. Each of these layers will produce 128 feature maps. The output tensors will be concatenated before feeding the next convolution layers with the same kernels. The produced output tensors are down-sampled using a max pooling operation after the second concatenation. The first dropout layer is used after max pooling to reduce overfitting.
Convolutional-pooling layers using 3 × 3 kernel and producing 256 and 512 feature maps are followed by the max polling layers. After the last pooling layer, the fully connected (FC) layers are activated with 2048 nodes as well as the dropout layer between the FC layers. All convolutional and FC layers use ReLU activation functions. Finally, there are 23 SoftMax neurons in the output layer, which corresponds to the 23 groups of food.
Experimental settings
A high-end server with 64GB of RAM and equipped with two Nvidia GeForce GTX 1080 Ti GPUs was used to do the training. The training was carried out by using TensorFlow machine learning framework and a batch size of 64 was established; the batches were randomly shuffled during the training process. In addition, two training schemas (20 and 40 epochs) were implemented to determine the different behaviors of the model. Dropout is used to prevent overfitting in neural networks [13]. The dropout layer was used twice within the model to reduce overfitting and both dropout layers had a 0.4 equal rate during training. We used a placeholder to dynamically control the dropout rate when simultaneous training and inference. The dropout rate was set to turn off the function to make predictions and inferences.
During the training, TensorFlow's AdamOptimizer() [25] function was used as the optimizer while the sparse_softmax_cross_entropy() [26] function was used as a loss function. In order to train the DCNN, choosing suitable hyperparameters is essential among those, the leaning rate (η) is the most critical as it significantly affects the training performance. However, the use of a fixed learning rate for the entire training process is not an optimal solution as it does consider the dynamical nature of the training behavior of the model. Therefore, the learning rate was dynamically updated throughout the training process. The function which updated that rate was the exponential function of cost η = η0 × exp (loss), where loss was the value of the sparse_softmax_cross_entropy() obtained during training and η0 was equal to 1e−4. Such a schedule for updating the learning rate strongly is related to the training performance.
The initial speed of the training was high due to the high learning rate, but training loss was also large; subsequently, the learning rate decreased automatically to avoid overshooting the best result.
RESULTS
Accuracies of K-foodNet model
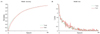
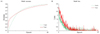
The graphs in Fig. 4 reveal both training and testing accuracies as well as the loss functions of the model with 20 epochs. The loss function decreased rapidly and maintained a steady index around zero. The test accuracy plateaued at approximately 88% within just 20 epochs.
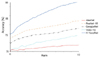
Based on the accuracy and loss curves in the Fig. 5, it is clear that the performance of the model could be further improved by increasing the number of training epochs. The figure shows that the gap between test and training functions is not large and that both curves increase over subsequent epochs, during which loss rapidly decreases before maintaining a stable rate in both training and test cases. The use of 40 epochs resulted in a 90% accuracy in the test, which shows the model could be trained to achieve higher accuracy.
In order to evaluate the performance of the proposed model, we trained the model 20 epochs. Fig. 4 shows that after the training was complete, training and testing accuracy had not stabilized. In other words, there was no overfitting, indicating that the model is still learning. In further experiments, we trained the same network and dataset using the same configurations; however, for that additional training case, we have assigned 40 epochs to determine whether the model still could be improved. Interestingly, as shown Fig. 5, after 40 epochs the model is still improving without overfitting; moreover, the model performance is sufficiently promising for application to an artificially extended dataset.
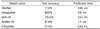
Comparisons of test accuracies and prediction times of the K-foodNet model and existing state-of-the-art models
In order to provide a fair benchmark to our K-foodNet, we trained other models with the same configurations and the same number of epochs (40 epochs) to compare with the results of our method. A summary of the comparisons is provided in the Table 3. Among the tested networks, our model was the fastest in term of prediction. In addition, the other models were deeper than our network but suffered from overfitting. Finally, the overall test accuracy of our method was higher than that of the other models.
Average test accuracy of the 23 Korean food groups
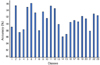
Fig. 7 illustrates the results of the average testing accuracy for each of the 23 individual food groups. Among those groups, the model's classification accuracies for images of white Kimchi, boiled rice, and Gimbap were more than 95%. However, the classification accuracies for stir-fried pork and radish Kimchi were approximately 87%, indication that these latter two food groups were more difficult to recognize.
DISCUSSION
Food intake assessment has important roles in chronic diseases management and the provision of public healthcare services. Recently, there has been a growing demand for nutrition management via mobile device applications. Mobile phones have been considered the most effective tool for gathering and delivering food information [21]. Thus far, many mobile device tools and programs have been developed and used to estimate food intake. For example, DietCam, an automatic food calorie measurement system, was developed for use in obesity nutrition management [12]. DietCam consists of three parts: image management, food volume estimation, and food classification. It uses optical character recognition (OCR) techniques and a scale-invariant feature transform (SIFT). A feature-based food classification approach and a multi-view method to calculate the food calorie and the volumes has also been described [21]. In addition, a wearables device, an automatic ingestion monitor, and a neural network classifier have been used to detect and monitor food intake of participants at a resolution of 30 s [27]. NutriNet, which is based on the recognition of food images by using DCNN, was developed as a dietary assessment applicaion for Parkinson's patients [14]. DeepFood is a food image recognition system that uses deep-learning algorithms to evaluate dietary intake [28]. These provious studies and the associated investigative tools were undertaken to accurately recognize food images and volumes by applying various algorithms and deep-learning methods, but prior to this study, no such studies have been undertaken in Korea.
A novel DCNN model based on real-time recognition of digital Korean food images was implemented in this study. The new dataset consisted of popular Korean food images and contained more than 4,000 original images in 23 food groups and the images illustrated mostly common dishes consumed in daily life in Korea. After expanding the dataset via data augmentation, the acquired number of images was more than 92,000. We applied DCNN in the complex recognition model and compared the result with other large-scale image recognition networks: AlexNet, GoogLeNet, Very Deep Convolutional Neural Network, VGG and ResNet, for large-scale image recognition. Our study results showed K-foodNet achieved better performance in detecting and recognizing Korean food compared to other state-of-the-art models.
To our best knowledge, there has never been a DCNN-based food recognition algorithm developed for Korean food. One of the challenges we faced was the unique characteristics of Korean foods [13]. Input images were different in terms of shape, texture, size and color as the Korean foods lack a typical or generalized layout. Korean foods are more complex than other types of food such as Indian or Italian food, and recognition of images of Korean food is difficult because images of foods within the same food category can appear different. In general, Korean food may be cooked with different ingredients and using different cooking methods; thus, images of the same food item can look dissimilar. Moreover, the same food item can look different to the naked eye. In addition, image noise from various backgrounds and textures is an obstacle to recognition as all images in the dataset were captured in a variety of places and environments, thereby including insufficient or different image brightness, strong reflection, distracting ornaments, etc.
Our approach had several strengths when compared to the aforementioned image recognition approaches. First, we have designed a new model on the assumption that CNNs that can handle a large artificially extended dataset of food images. More images in our dataset were generated from a limited number of images by using data augmentation techniques; therefore, similarity was very high between images, which, in turn, can lead to strong overfitting during training. However, it is clear from the results that the model is stable and is capable of learning images without overfitting. Although the above mentioned approaches use classic off-the-shelf deep learning architectures, our novel solution produced better performance and robustness with respect to existing approaches. Furthermore, our model is able to accurately distinguish images with very complex textures, in other words, images that belong to the same food category can appear very different due to differences in texture. In spite of these challenges, our model achieved excellent results compared to other currently available models. Others have noted that in computer vision tasks, CNN-based models can outperform traditional methods and achieve higher accuracy when using deeper CNNs [142930]. A model purposed by Lu [31], obtained an overall 90% accuracy using DCNNs and a small dataset with 5,822 images and 10 food groups. Their model used five convolutional layers to recognize food images. Moreover, a DCNN-based model, FoodNet, was proposed by Pandey et al. [32]. In that model, the dish image recognition system used a large dataset (ETH Food-101) that include 101 food categories.
Although our model achieves high performance, its loss function is considered too noisy and not capable of a smooth reduction due to the use of similar augmented images. This problem requires future study to resolve. A possible solution to such a problem would be to use reduce the network depth and/or to remove very similar food images from the dataset.
The limitations of this study are as follows. First, the limited number of high quality, specific food images. Second, although a wide range of food categories exists in Korean food, we only included 23 groups of Korean food. Third, there is no publicly available image dataset suitable for Korean food recognition in Korea. Importantly, the quality of images in a dataset has a pivotal role in training the DCNN, and obtaining high performance from deep models is still data-driven to some extent. Therefore, in order to improve the performance of the current model, high-quality images obtained under sufficient lighting conditions and from appropriate angles are needed. As well, the food should be presented in an appropriate, recognizable manner.
The next step in this research is to improve the DCNN algorithm's food image recognition performance level and ensure that the recognition process uses high quality, appropriate images. Such improvements will produce a model that can assess dietary intake accurately and be applied to nutrition management programs in Korea.

 XML Download