

 PDF
PDF ePub
ePub Citation
 Print
Print


INTRODUCTION
According to the 2015 National Health and Nutrition Examination Survey, the prevalence of obesity in Korean adults has remained at 23–26% since 1998; notably, in 2015, it increased to 26.0%, up 2.7% from the previous year.
Analysis of the distribution of obesity by age group showed that 13.4% of obese Korean women were in their 20 s, with the prevalence increasing continuously until reaching the highest proportion of 41.7% in women in their 60 s [1]. Also, the prevalence rate of severely obese women [body mass index (BMI) ≥ 30 kg/m2] increased from 2.8% in 2005 to 4.7% in 2015 [1]. These results suggest that the level of need for the prevention and management of obesity increases as the age of women increases.
Obese individuals have more than twice the risk of metabolic disease compared to those of normal weight, and obesity is also related to the incidence of arteriosclerosis, cancer, respiratory disorders, fatty liver, and arthritis [2]. An increase in adipose tissue leads to increased secretions of various cytokines such as tumor necrosis factor (TNF)-α, interleukin-6, and obesity can induce insulin resistance [34]. Increased insulin resistance results in an increased prevalence of type 2 diabetes and various cardiovascular diseases [25].
Many recent studies have suggested the use of a new phenotype-based description of obesity. Although they may have a high body mass index (BMI), there are obese people who do not have abnormalities in blood pressure, lipid metabolism, inflammation, hormone levels, and immune system responses, as well as no insulin resistance. Such people have been phenotypically described as metabolically healthy obese (MHO) individuals [6789]. There is also evidence that MHO subjects are less likely to accumulate visceral fat, but not subcutaneous fat, compared to their metabolically abnormal obese (MAO) counterparts [671011].
The criteria for the determination of MHO and MAO are variable, and the prevalence of each may vary according to the diagnostic criteria being applied. Many studies have shown that BMI, blood pressure, triglyceride, high-density lipoprotein cholesterol (HDL-C), fasting plasma glucose, homeostatic model assessment of insulin resistance (HOMA-IR), low-density lipoprotein cholesterol (LDL-C), and C reactive protein can be used as diagnostic criteria when determining obesity phenotype [12]. In Korea, there have been some studies in which National Cholesterol Education Program Adult Treatment Panel III (NCEP-ATP III) guidelines were applied as diagnostic criteria for assessing the metabolic syndrome in obese individuals [13].
Fujilka et al. [14] reported that the complication rate associated with obese patients was dependent on the distribution of body fat, especially that for visceral fat type obesity with abdominal fat accumulation. Karelis et al. [7] reported that MHO women had a lower inflammatory state than women with postmenopausal insulin resistance and that this had a role in lowering the risk of cardiovascular disease. Van Pelt et al. [15] also reported that body fat distribution in obese people is related to insulin resistance and dyslipidemia. Based on the results of previous studies, it seems that there are factors that affect the metabolic abnormalities of obese people.
Therefore, it is necessary to investigate the clinical characteristics of obese people that have significant metabolic abnormalities. There are few studies that have analyzed the relationship between metabolic risk and body composition in Korea. In this study, we aimed to compare body compositions, dietary intakes, biochemical indicators, and energy metabolism between the two metabolic phenotypes of obese Korean adult women.
SUBJECTS AND METHODS
Subjects
The subjects in this study were adult women aged 19 to 60 who had a BMI of 25 or more and a waist circumference of 85 cm or more, in accord with the Asia-Pacific Obesity Guidelines. The enrolled subjects fully understood the purpose, content, and method of the study and signed a written participation agreement voluntarily.
Persons suffering from heart, kidney, liver, thyroid, cerebrovascular, or gallbladder disease or those with a gastrointestinal disorder, gout, porphyria, a psychiatric disorder, depression, schizophrenia, alcoholism, and drug addiction, as well as pregnant or lactating women, and those who participated in an obesity- or diet food-related program within 30 days of the start of the study were excluded from the study. After final selections, the study group included 59 obese Korean women.
This study was conducted after obtaining the approval of the clinical trial committee of Kyunghee University Hospital (KMC IRB 1304-03 and KMC IRB 1509-01). The study included two periods: April 1 2013 to December 31 2013 and April 1 2015 to December 31 2015.
Classification of MAO and MHO
Based on the NCEP-ATP III guidelines, subjects meeting three or more of the following criteria were classified into the MAO group and those meeting two or less of the following criteria were classified into the MHO group [161718].
Body measurement and blood pressure measurement
The weight and height of the subjects were measured with an electronic height scale while wearing light clothing, and weight and height were measured to one decimal place (0.1 kg and 0.1 cm, respectively). BMI was calculated by dividing the measured body weight (kg) by the squared height (m).
Waist circumference (cm), hip circumference (cm), thigh circumference (cm), and mid-arm muscle circumference (MAMC; cm) were measured using a tape measure. Triceps skin-fold thickness (TSF) was measured thickness of the upper arm skin (mm) by caliper (Skyndex, USA). Blood pressure was measured using a standard electronic pressure gauge (FT 500, Korea) during subject stability.
Health-related behavior and eating habits survey
A health-related behavior survey was conducted by using a previously prepared questionnaire. Health-related behavior items included questions about functional food intake, smoking, drinking, and exercise.
Eating habits of subjects were determined via surveys composed of questions regarding the number of meals, breakfast regularity, meal timing regularity, meal consumption speed, snack intake frequency, overeating frequency, and others. The health-related behavior and eating habits questionnaires were provided to the subjects once during the study, and subjects were asked about their typical health and dietary behaviors.
Food and nutrient intake survey
Diet diaries were used by subjects to record all meals and snacks consumed for a total of 3 days, including 2 days on weekdays and 1 day on a weekend. Before starting the recording, a trained clinical nutritionist provided guidance to the subjects about the use of a food diary and the recording of food items. After completion of the record, a one-on-one interview was conducted to clarify the exact type/amount of food consumed. The collected data were analyzed by using the computer-aided nutritional analysis for professionals (CAN pro version 5.0, Korean Nutrition Society) nutritional assessment program.
In addition, the food types were grouped into 16 food groups (cereals, potatoes, whole grains, sugars, beans, seeds, vegetables, mushrooms, fruits, meat, eggs, seafood, seaweed, milk, and dairy products).
Body composition analysis
Body composition was measured by using a DEXA system (Discovery QDR 4500 W, Hologic Inc., USA) and bioelectric impedance analysis (BIA) using an Inbody 720 analyzer (Korea).
DEXA was performed on the back of the subject on a test bed, and it provided measurements of body fat mass, percent body fat, and lean body mass. Body fat and fat measurements were divided into body, arm and leg estimates. Android fat and gynoid fat were also measured.
Biochemical tests
After collecting 10 mL of brachial vein blood from a subject in a fasting state, the blood was centrifuged at 2500 r/min for 15 min to obtain the plasma in the upper layer. AST, ALT, and plasma glucose concentrations were measured by using an autoanalyzer (Beckman CX-7, USA). Insulin concentrations were measured by using a human insulin-specific radioimmunoassay (RIA) kit (Linco Research Inc., USA).
The triglyceride and total cholesterol concentrations were measured by using an enzyme-based kit (Wako Co., Japan). LDL and HDL cholesterol concentrations were measured by using an enzyme-based kit (Bayer, USA).
Leptin, visfatin, and adiponectin were measured by applying an RIA method (Linco Research Inc., USA) and TNF-α was measured by using a human TNF-α ELISA kit (Linco Research Inc., USA).
To determine insulin resistance, we calculated the homeostasis model assessment index (HOMA-IR) by using measured insulin and blood glucose levels as follows:

Resting metabolic rate and respiratory rate
Resting metabolic and respiratory rates were measured by performing indirect calorimetry and a ventilated hood device (TrueOne 2400, Parvo Medics, USA). Alcohol consumption on the day before and the day of these measurements was restricted, and fasting was performed 4 h before the measurements. After resting for 10–15 min before measurement, the subject was placed on a bed in a stable state and the measures obtained. After the gas respiration analyzer tube and subject canopy were connected to each other, the subject was allowed to breathe comfortably for about 5 min while their shoulders were covered by the canopy, which extended from the face to the elbow of the subject. After the respiratory gas was calibrated and the subject was stable, respiration of the subject was measured for approximately 20 min.
Statistical processing
The collected data were analyzed statistically by using SPSS Statistics version 24.0 (IBM Corporation, USA). The Mann-Whitney U test was used to compare the general characteristics, body measurements, body composition, biochemical indicators, nutrient intake, and energy metabolism of the two phenotype groups. The χ2 test was used to examine the differences in health-related lifestyle and eating habits. The significance level for all data processing and statistical analysis results was P < 0.05.
RESULTS
Descriptive data and anthropometric data
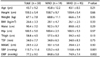
A total of 59 subjects (average age 43.7 years) were enrolled in this study, of those, 14 (23.7%) were MAO and 45 (76.3%) were MHO. Table 1 summarizes the descriptive and anthropometric data for the study subjects according to their metabolic phenotype. There was no significant difference in age, height, weight, BMI, waist circumference, hip circumference, thigh circumference, triceps skin-fold thickness, and MAMC results between the two groups. However, the systolic blood pressure (SBP) was 123.2 ± 4.8 mmHg in the MAO group, significantly higher than the 110.8 ± 9.9 mmHg SBP in the MHO group (P < 0.01). The diastolic blood pressure (DBP) was 84.8 ± 5.8 mmHg in the MAO group and 74.9 ± 7.4 mmHg in the MHO group, with DBP being significantly higher in the MAO group (P < 0.01).
Health-related lifestyles of subjects
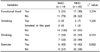
Table 2 summarizes the health-related lifestyle variables according to the phenotype of the subjects. Of the total MAO subjects, 21% consumed functional foods, whereas 38% of the MHO subjects consumed functional foods; inversely, 79% of the MAO subjects and 62% of the MHO subjects did not consume functional foods. Although the MHO group tended to have a higher intake of functional foods, there was no statistical significance of the difference.
Most of the subjects in both groups did not smoke (MAO, 100% nonsmoker; MHO 91% nonsmoker). There was no statistically significant difference between the two groups in their smoking, drinking, and exercise health-related lifestyle factors.
Nutrient intake
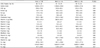
Table 3 summarizes the average daily intakes of various nutrients according to the metabolic phenotype of the subjects. The proportions of carbohydrate, protein, and fat within the total daily calorie intake were 61% carbohydrate, 15% protein, and 24% fat in the MAO group and 59% carbohydrate, 15% protein, and 25% fat in the MHO group. The daily calorie intake was 1,596.8 ± 543.8 kcal in the MAO group and 1,585.8 ± 513.6 kcal in the MHO group. There were no significant differences between the two groups in the daily intake of any of the nutrients assessed.
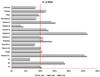
The average daily intakes of various nutrients compared to the recommended daily allowance (% RDA) for that nutrient according to the phenotypes of the subjects are shown in Fig. 1. With regard to the intake of calories, 82% of the MAO and 84% of the MHO subjects consumed below the RDA. In both groups, vitamin K (MAO 265%, MHO 257%), vitamin B12 (MAO 263%, MHO 251%), and sodium (MAO 187%, MHO 182%) intakes were approximately twice the RDA.
Eating habits
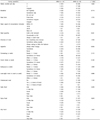
Table 4 summarizes the eating habits of the study subjects according to their phenotype. With regard to mealtime, 14% of the MAO and 31% of the MHO subjects responded with the at a ‘fixed time’ response, whereas, regarding the speed of eating a meal, 50% of the MAO and 36% of the MHO subjects responded that they consumed the meal ‘within 10 minutes’. The diversity of meals response rate for ‘eating everything’ was 50% in the MAO group and 60% in the MHO group. Regarding the overeating question, 14% of the MAO subjects and 27% of the MHO subjects responded with the answer ‘often’. The question about the number of instances of ‘eating-out’ per week produced a response of ‘rarely’ in 43% of the MAO group and 24% of the MHO group. With regard to the late-night meal or snack, the response rate of ‘rarely’ was 36% in the MAO and 56% in the MHO. To the question about consuming an ‘imbalanced meal’, 57% of the MAO group and 69% of the MHO group responded ‘no’. Furthermore, 36% of the MAO subjects and 47% of the MHO subjects responded that they ‘like’ spicy food, whereas 43% of the MAO subjects and 29% of the MHO subjects responded that they ‘like’ to eat ‘oily foods’.
In summary, the MAO group tended to eat fast (within 10 minutes) and the MHO group tended to eat at a regular time, have a slightly more diverse composition of meals, eat-out more regularly, and rarely consume late-night meals or snacks. Regardless, there were no significant differences between the two groups in any of their eating habits.
Body composition
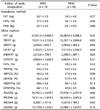
Table 5 summarizes various aspects of the body composition of the two metabolic phenotype groups. In the body composition measured by the BIA method, body fat and body fat percentage were higher in the MAO group than in the MHO group, whereas mean fat-free mass was higher among MHO subjects than MAO subjects. Regardless, there was no statistical significance to those differences.
Among the body composition indices measured by DEXA, the total fat mass was higher in the MAO group than in the MHO group, but the difference was not statistically significant. The trunk fat mass was 15,531.3 ± 3,102.4 g in the MAO group, significantly higher by 1,824.3 g than that in the MHO group (13,707.1 ± 2,894.6 g; P < 0.05). Similarly, arm fat mass in the MAO group (2,943.6 ± 842.7 g) was significantly higher, by 499 g, than that in the MHO group (2,444.6 ± 603.4 g; P < 0.05). Leg fat mass was slightly higher in the MHO group, but the difference was not statistically significant.
The average android fat mass was 2,612.8 ± 578.5 g in the MAO, 332.3 g significantly higher than that in the MHO group (2,290.5 ± 697.1 g; P < 0.05). However, gynoid fat mass, although the MAO level was higher than the MHO level, there was no statistical significance to the difference.
In summary, total fat, trunk fat percentage, and arm fat percentage were significantly higher in MAO subjects; in contrast, leg fat and gynoid fat percentages were higher in MHO, but the differences were not statistically significant. Moreover, total lean mass, trunk lean mass, and leg lean mass were higher in the MAO group, but the differences were not significant. However, arm lean mass was 282.5 g higher in the MAO group (4,208.1 ± 411.8 g) than that in the MHO group (3,925.6 ± 585.2 g), a significant difference (P < 0.05).
Blood biochemical parameters
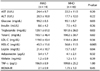
Table 6 summarizes various biochemical parameters for the two metabolic phenotype groups. Glucose was 99.2 ± 8.5 mg/dL in the MAO and 93.1 ± 8.7 mg/dL in the MHO, a significant difference (P < 0.05). Regarding triglyceride levels, the MAO group average was 139.1 ± 61.0 mg/dL while the MHO average was significantly lower at 101.0 ± 36.0 mg/dL; P < 0.05). The HDL cholesterol level was 45.3 ± 11.6 mg/dL in the MAO group, significantly lower than the 56.8 ± 11.5 mg/dL in the MHO group (P < 0.05). In contrast, the leptin average was 21.4 ± 10.7 mg/dL in the MAO group, significantly higher than that in the MHO group (15.7 ± 8.7 mg/dL; P < 0.05).
The AST, ALT, insulin, total cholesterol, LDL cholesterol, visfatin, and HOMA-IR averages were higher in the MAO group than in the MHO group, and adiponectin and TNF-α were higher in the MHO group than in the MAO group; however, none of those differences were statistically significant.
Energy expenditure and respiratory quotient
Table 7 summarizes the resting metabolic rate and respiratory rate of the two groups. The resting energy expenditure values were 1,393.0 ± 150.0 kcal in the MAO group and 1,356.2 ± 191.3 kcal in the MHO; there was no difference between the two groups. The respiratory quotients were similar, 0.7 ± 0.0 in the MAO group and 0.7 ± 0.0 in the MHO group with no significant difference between the two groups.
DISCUSSION
This study was conducted on obese Korean women who were over 19 years old, under 60 years old, with a BMI of 25 or more, or a waist circumference of 85 cm or more. The study took place in two periods: April 1 2013 to December 31 2013 and April 1 2015 to December 31 2015. Metabolic risk was assessed according to NCEP-ATP III guidelines and the subjects were classified as either MHO or MAO. Dietary intakes, body composition, and biochemical parameters were compared. Of the 59 subjects in this study (average age 43.7 years) 14 (23.7%) were in MAO and 45 (76.3%) were MHO.
Based on group measurements of blood pressure and biochemical indicators, MAO subjects had higher systolic and diastolic blood pressures, as well as higher blood glucose, triglyceride, and leptin levels than MHO subjects. On the other hand, HDL cholesterol was lower in MAO subjects. In previous studies, Gomez-Ambrosi et al. [19] reported that the MAO had higher systolic and diastolic blood pressures, as well as blood glucose, insulin, HOMA index, triglyceride, ALT, and leptin levels than the MHO. In addition, Camhi et al. [20] reported that MAO women had higher systolic and diastolic blood pressures, blood glucose, and triglyceride levels, and lower HDL cholesterol levels than MHO women. In a study by Camhi et al. [21] conducted on African American and Caucasian overweight or obese women, the metabolically unhealthy obese had higher very low density lipoprotein, triglyceride, and blood glucose levels than the MHO, whereas their HDL cholesterol level was lower. Therefore, the results of this study are consistent with previously obtained biochemical results.
As a result of the comparison of health-related lifestyle factors in the two groups, 21% of the MAO and 38% of the MHO consumed functional food, suggesting that the rate of intake of functional foods was higher in the MHO group than in the MAO group; however, there was no statistical significance to the difference. Most of the subjects (93%) had no previous smoking experience. Choi et al. [22], who conducted studies on male and female adults in Korea, reported that 90.7% of their MAO subjects and 89.7% of their MHO subjects did not smoke. In addition, 56.2% of the MAO and 67.5% of the MHO in that study reported that they were drinking appropriately, similar to the results in this study. Choi et al. [22] reported a rate of exercise in adult women of 25.1% in their MAO and 28.6% in their MHO subjects. The results of this study showed that the level of participation in exercise of both groups (MAO 43%, MHO 42%) was higher than that reported previously [22].
There were no significant differences in the intake of nutrients between the two groups. The average dietary fiber intake of the subjects was 19.2 g, which was similar to the average female dietary fiber intake (20.9 g) reported in the 2015 Korea National Health and Nutrition Survey. The average caloric intake of the subjects was 83% of the dietary reference intake for Koreans, which was lower than the recommended amount. According to Chung [23], the caloric intake of obese women with metabolic syndrome was 1,577.2 kcal/day while that of obese women without metabolic syndrome was 1,510.0 kcal/day. This trend was similar to the results of this study showing little difference between the two groups (MAO 1,596.8 kcal, MHO 1,585.8 kcal). It has been reported that it is difficult to use a food intake record in a study of obese subjects' energy intakes [24] and reported energy consumption and measured energy consumption can differ by 20–50% [2526]. Under-reporting of intake was reported to be associated with increased BMI [2728]. Therefore, the energy intake data from the dietary intake data collected from adult obese people are thought to be somewhat different from their actual intake.
Our results showed that the eating habits of MHO subjects are healthier than those of MAO subjects. The MAO had more responses of ‘less than 10 minutes’ for meal consumption duration and a greater preference for oily food than those of the MHO group. In addition, the response rate of eating ‘till a full stomach’ was obtained was higher in the MAO group than in the MHO group. Therefore, the eating habits of the MHO group tended to be more positive than those of the MAO; however, none of the differences were significant.
The body composition analysis of the two phenotype groups showed that body fat mass, arm fat mass, and android fat mass, as measured by DEXA, were significantly higher in the MAO group than in the MHO group. Camhi et al. [21] found that MAO women had significantly higher body fat, visceral fat mass, and muscle mass than MHO women. In a study of postmenopausal women, Peppa et al. [29] reported that metabolically unhealthy obese people had higher abdominal fat, body fat mass, abdominal fat to hip fat ratio, and arm fat mass than healthy obese people. Van Pelt et al. [15] reported that body fat mass in postmenopausal women is an independent predictor of insulin resistance and dyslipidemia, and that leg fat mass is associated with the prevention of metabolic abnormalities. It has also been shown that the arm fat content is related to undesirable metabolic effects, which is due to the strong correlation of arm fat with central fat. The HOMA-IR value was shown to increase with an increase in arm fat ratio independent of increased age in adult women with abdominal obesity [30]. Choi et al. [31] conducted a study of men and postmenopausal women over the age of 50 years and reported that body fat and arm fat increased the risk of type 2 diabetes in both men and women. In a cohort study by Snijder et al. [32], high body fat mass in diabetic subjects was associated with a high level of fasting glucose. In many studies, central or trunk obesity has been reported to increase metabolic risk and the risk of cardiovascular disease [333435].
The distribution of body fat mass is associated with undesirable glucose metabolism, which is reported to be the result of the direct release of free fatty acids from visceral fat into the portal vein, leading to impaired glucose metabolism [3637]. Another recently proposed hypothesis for the relationship between body fat and glucose metabolism is that visceral fat is associated with the storage of ‘ectopic fat’ such as pericardial fat, intramuscular triglyceride, and liver fat [38]. The accumulation of ectopic fat in this paradigm is the result of an energy imbalance that is beyond the normal storage capacity of the subcutaneous fat tissue reservoir. Subcutaneous fat functions abnormally, resulting in reduced ability to release or store triglycerides and excess free fatty acids. This concept also includes abnormalities due to increased infiltration of adipose tissue by inflammatory cells, excessive release of potentially harmful cytokines, and a reduced release of beneficial adipocytes [39]. However, another study has demonstrated that subcutaneous fat in the abdomen is more closely associated with insulin resistance than with visceral fat [40].
Android fats are characterized by the presence of intra-abdominal (visceral) fat, which is reported to increase the risk of cardiovascular disease, hypertension, dyslipidemia, insulin resistance, and type 2 diabetes [4142]. The increase in android fat percentage is also associated with an increase in triglyceride, LDL cholesterol, and a decrease in HDL cholesterol [43], and with an increase in insulin resistance [44]. In a study by Bi et al. [45] of obese Caucasian and African American people, the increases in body fat and android fat percentages were associated with an increase in insulin levels. Gynoid fats are characterized by a high distribution of subcutaneous fat, are generally more common in women than men, and are less associated than android fat with cardiovascular disease [46]. Many previous studies have shown that the ratio of male to female android fats is associated with metabolic risk [434748]. In this study, the difference in the distribution of the android fat between the two groups was not significant, which can be seen as supporting the previous studies.
There were no significant differences between the RQ and REE values for the MHO and MAO groups. The REE value is associated with body composition, and an increase in lean mass is known to be closely related to an increase in the resting metabolic rate [49]. In this study, there was a significant difference in arm lean mass between the two groups (P < 0.05), but the differences in total lean mass and trunk lean mass between the MAO and MHO groups were only close to being significantly different (P = 0.05 and 0.06, respectively); regardless, there was no difference in resting metabolic rate between the two groups. In addition, the differences in trunk fat mass and arm fat mass between the two groups were not reflected by a difference in resting metabolic rate.
The limitations of this study are presented in the following. Hormonal changes after menopause in women have been reported to affect body fat distribution and increase metabolic risk factors associated with cardiovascular disease [50]. However, this study failed to evaluate the subjects' physiological status associated with menopause due to the lack of data related to menopause. In addition, the body, arm, and leg fat mass measurements obtained by DEXA do not distinguish between subcutaneous and visceral fat (intramuscular fat). Therefore, it was not possible to determine whether the relationships between trunk fat and arm fat and metabolic risk are influenced by subcutaneous or visceral fat.
The results of this study showed that MAO group had higher body fat, arm fat, and android fat mass than the MHO group. These results support previous studies suggesting that trunk fat and android fat mass are predictors of metabolic diseases such as type 2 diabetes and cardiovascular disease. Also, we suggest that an increase in arm fat mass may affect metabolic risks in Korean obese women. In addition, the health-related lifestyle and eating habits of the subjects were related to their obesity phenotype. Studies involving analysis of subcutaneous and visceral fats within trunk fat in obese Korean women and into the mechanism(s) involved in the metabolic risks associated with arm fat mass are necessary.

 XML Download