

 PDF
PDF ePub
ePub Citation
 Print
Print


INTRODUCTION
Osteoarthritis (OA) is a major public health issue in Japan and other countries [1], and it is a common disease in adults, especially obese and elderly people [23]. Although OA may occur at any joint of the body, it is more likely to occur in the knees which bear most of the body weight. In Japan, it is estimated that there are 25.3 million OA patients and an OA prevalence rate of 42.6% in men and 62.4% in women over 40 years of age [4]. For these people, prevention and reduction of pain caused by OA is important for maintaining quality of life, and this is a serious social problem to be solved. Other countries also have a similar problem.
Nonsteroidal anti-inflammatory drugs and steroids are commonly used as symptomatic treatments of OA, although adverse effects such as gastrointestinal disorders occur in some patients [5]. Surgery or injection of hyaluronic acid into the cartilage is another OA treatment approach [6], but the frequent number of operations contributes financial burden to not only the patients, but also the national health-insurance system [7]. Furthermore, physical stress of patients is unavoidable in such treatments. Foods are suitable for prevention and treatment of OA in that they have no serious side effects and can be taken for a long duration without pain. Therefore, foods that preventing or treating OA are in strong demand. Although dietary supplements containing cartilage components, such as chondroitin and glucosamine, have been used for the prevention and improvement of cartilage disorder [8], functional foods which are more effective with less intake are still required.
Chicken legs are consumed in certain areas of the world, including Japan. Because proteins and peptides found in chicken meat and bones are known to be rich in nutritional and functional food ingredients for relieving fatigue, sarcopenia and osteoporosis [910], it can be expected that chicken legs also contain such ingredients. We prepared a water-soluble chicken leg extract (CLE), evaluated the acid mucopolysaccharide production-promoting activity of artificially digested CLE in cartilage precursor cells, and examined the matrix regeneration effect of orally administered CLE using rabbits. Moreover, we identified the peptides absorbed in the human body derived from orally administered CLE by LC-MS/MS. We evaluated the acid mucopolysaccharide production-promoting activity of these peptides which are thought to be the active ingredient in the CLE digest.
MATERIALS AND METHODS
Chicken leg extract preparation
In this study, we used a CLE known as HAS-II® (Pharma Foods International, Kyoto, Japan). This CLE was prepared using hot water extraction followed by endoprotease hydrolysis.
Animal study
The animal study was approved by the Animal ethics committee of Nihon Bioresearch Inc. (Gifu, Japan) in accordance with the guideline of the Minister of Education, Culture, Sports, Science and Technology-Japan (approval number 071334P). Wound healing study using rabbits was conducted following previously reported methods [11] with modification. Four SCL-JW rabbits (22-weeks old) were purchased from Japan SLC (Kurume, Japan). Each rabbit underwent surgery to pierce a total of four burr holes in the knee joint of the femur. Two rabbits were orally administrated CLE (50 mg/day) and the other two rabbits only water (sham controls) every day for three weeks. After three weeks, the degree of wound healing was evaluated by macroscopic observation and histochemical assessment. Macroscopic observation was evaluated by a four-grade evaluation: score 0 - the burr hole is visible and not filled with matrix; score 1 - the burr hole is slightly difficult to recognize, but not filled with matrix; score 2 - the burr hole is indistinctive or filled with matrix; and score 3 - the burr hole is indistinctive and filled with matrix. Histochemical assessment was performed by alcian blue staining. Acid mucopolysaccharides in paraformaldehyde-fixed sections were stained with alcian blue and the stained area at the injured site was determined by the SAS system (SAS Institute Japan Ltd., Osaka, Japan).
Artificial digestion of CLE
CLE (50 mg) dissolved in 1.5 mL of 0.1 M HCl was mixed with 50 µL of 1 mg/mL pepsin (Nacalai Tesque, Kyoto, Japan). After incubating for 4 h at 37℃, 600 µL of PBS was added and the solution pH was adjusted to 7.4 using 3 M NaOH. The mixture was then incubated with 20 µL of 10 mg/mL pancreatin (FUJIFILM Wako Pure Chemical Corporation, Osaka, Japan) in PBS, 15.4 units of carboxypeptidase B (Worthington Biochemical Corporation, Lakewood, USA) and 4.9 units of leucine aminopeptidase (Sigma-Aldrich, Missouri, USA) for 24 h at 37℃. Next, the mixture was centrifuged with centrifugal filters (cut off 10,000 Da, 2,000 g, 90 min) and the supernatant was used as the artificial CLE digest in subsequent studies.
Determination of molecular weight of the artificial CLE digest
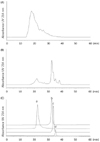
The artificial CLE digest was fractionated by size exclusion chromatography (SEC) using Superdex peptide 10/300 column (GE Healthcare, Amersham Place, UK) at 25℃. The mobile phase was 50 mM phosphoric acid and 150 mM sodium chloride and the flow rate was 0.5 mL/min. Aprotinin (molecular weight (MW): 6,512, FUJIFILM Wako Pure Chemical Corporation), angiotensin II (MW: 1,046, FUJIFILM Wako Pure Chemical Corporation), triglycine (MW: 189, Tokyo Chemical Industry, Tokyo, Japan) and glycine (MW:75, FUJIFILM Wako Pure Chemical Corporation) were used as standards. An analytical curve of the molecular weight and the elution time was made and the average molecular weight was calculated.
Cell culture and assay
ATDC5 cells (RIEKN BRC, Ibaraki, Japan), a chondrogenic progenitor cell line derived from mouse tetracarcinoma cells, were used for in vitro studies. Cells were plated to a 24-well plate (5 × 10⁵ cells/mL, 20 µL) at the center of each well, and cultured in maintenance medium, i.e., DMEM/F-12 (GIBCO BRL, Palo Alto, CA, USA) with 5% FBS (Corning Inc, New York, USA) and 1% penicillin-streptomycin (Sigma Aldrich), 5 µg/mL transferrin (Sigma Aldrich), 30 nM sedium selenite for 3 h. Then the medium was changed to maintenance medium containing the test sample supplemented with 0.1 µg/mL insulin (Sigma Aldrich), and cultured for 14 days. Finally, the cartilage matrix secreted from the cells were stained by alcian blue and the stained area was measured with Image J [1213].
Estimation of peptides in the CLE digest
The artificial CLE digest was fractionated by SEC using Superdex peptide 10/300 (GE Healthcare). The mobile phase was an aqueous solution containing 10% acetonitrile and 0.1% formic acid and the flow rate was 0.5 mL/min. Fractions were collected every 1 min. The collected eluent was then concentrated and dried using a centrifugal concentrator. The dried sample was dissolved in a 30% acetonitrile and 0.1% formic acid solution. The sample was then analyzed by HPLC linked to a 3,200 Q Trap LC-MS/MS system (Biosystems/MDS Sciex, Ontario, Canada) using COSMOSIL 5C18-AR-II Packed Column (2.0 mm I.D. × 250 mm; Nacalai Tesque). The mobile phase system was consisted of 0.1% formic acid (solvent A) and 60% acetonitrile-0.1% formic acid (solvent B). The gradient program was fallows: 0–5 min, 0.1% B; 5–20 min, 0.1–30% B; 20–25 min, 30–100% B; 25–30 min, 100% B; 30–30.01 min, 100–0.1% B; 30–40 min, 0.1% B. The flow rate was set at 0.2 mL/min while the column temperature was maintained at 40℃. Peptides of the CLE digest in the SEC fractions were detected by total ions at positive mode in the range of m/z 120–200, 200–250, 250–300, 300–400, 400–1,000. The m/z of peptides were recorded and used for MS/MS analysis. The molecular structure was estimated based on production patterns.
Digestion and absorption of CLE in humans
This study was approved by the Ethical Review Board of Pharma Foods International (approval No. PF0088) and conducted in accordance with the guidelines of declaration of Helsinki and ethical guidelines for medical and health research involving human subjects proposed by the Japan Ministry of Health, Labor, and Welfare. All the subjects received explanations about the study and they provided written informed consent before commencement of the study. Three healthy human volunteers (Mens, Age 26–41) were orally administered 10 g of CLE. Blood samples were collected using syringes containing heparin sodium, just before and 60 min after oral administration of CLE. The blood samples were collected at 60 min after oral administration because it was reported that Hyp-containing peptides reached maximum levels in human plasma 60 min after administration of collagen hydrolysate [14]. The collected blood was immediately mixed by inverting and centrifuged (800 g, 15 min). After centrifugation, the supernatant was filtered with a 0.45 µm filter (Merck Millipore, Guyancourt, France) and stored at −80℃. In the plasma, estimated peptides from CLE digest were analyzed with LC-MS/MS using multiple reaction monitoring mode, in the same conditions described in the estimation of peptides in the CLE digest section. The peptides with increased ion intensity after CLE ingestion were regarded as peptides derived from CLE, and the peptides were identified by comparing the sample elution time with the standards.
Synthesis of dipeptides
Four dipeptides, Leu-Hyp, Pro-Hyp, Glu-Hyp and Phe-Hyp, were synthesized by a liquid-phase method [15]. When synthesizing Leu-Hyp, 1.8 mM of Boc-Leucine-OH (Watanabe chemical industry, Hiroshima, Japan) was reacted with 1.8 mM of (t-Butyl)-trans-4-hydroxy-L-proline t-butyl ester hydrochloride (Watanabe chemical industry) overnight at 4℃ in the presence of 2.6 mM of 1-ethyl-3-(3-dimethylaminopropyl) carbodiimide monohydrochloride (Watanabe chemical industry) and 4.4 mM of 1-hydroxybenzotriazole (Watanabe chemical industry) as catalysts. The reaction product, N and C-protected dipeptidyl Leu-Hyp derivative (Boc-Leu-Hyp-OtBu), was reacted with 4 M HCl/dioxane (30 min, 25℃) to cleave Boc groups and OtBu groups [16]. The obtained crude product was purified by preparative reversed-phase HPLC using Cosmosil 5C18-AR-II (10 mm I.D. × 250 mm; Nacalai Tesque).The final product was characterized by analytical reversed-phase HPLC using Cosmosil 5C18-AR-II (2.0 mm I.D. × 250 mm; Nacalai Tesque) and electrospray ionization ion-trap mass spectrometry with HPLC linked to 3200 Q Trap LC-MS/MS system. Pro-Hyp, Glu-Hyp and Phe-Hyp were synthesized in the same manner as Leu-Hyp, using the starting materials corresponding to the dipeptide to be synthesized.
Statistical analysis
Data are expressed as mean ± standard deviation (SD). In order to compare in vivo activity between the sham control group and CLE ingestion group, the macroscopic observation score and alcian blue-stained area of the injured site was statistically analyzed using the Mann-Whitney U test and Student's t-test, respectively. In the in vitro study, statistical analysis between control and other samples was performed using the Dunnett test, while Student's t-test with Bonferroni correction was used for the comparison among the three samples (control, artificial CLE digest and Phe-Hyp; Fig. 7A).
RESULTS
Molecular weight of the artificial CLE digest
The average molecular weight of CLE and the artificial CLE digest was 5,217 and 629, respectively (Fig. 1).
Effect of CLE digest on chondrogenic progenitor cells
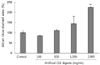
Effect of the artificial CLE digest on cartilage matrix production was investigated using ATDC5 cells, a chondrogenic progenitor cell. Acid mucopolysaccharide, including hyaluronic acid and chondroitin sulfate, was quantified by alcian blue staining. We showed that artificial CLE digest induced the production of acid mucopolysaccharides (Fig. 2). Compared with the control, 1,000 and 2,000 µg/mL of CLE treatment showed significantly higher acid mucopolysaccharide production in a concentration-dependent manner (144% and 225%, respectively).
Animal wound healing study
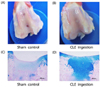
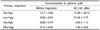
An animal test was conducted to evaluate the effect of orally administered CLE in vivo. CLE did not show any adverse effects, with no changes in body weight, physical activity and behavior. Artificial burr holes created in knee joint of the rabbits in the CLE ingestion group were more healed than the sham control (Fig. 3A, B). The score of macroscopic observation and alcian blue-stained area of burr holes are shown in Table 1. The macroscopic observation scores of the CLE ingestion group and sham control group were 2.3 ± 1.0 and 1.1 ± 1.1, respectively (P = 0.08). Alcian blue staining of burr holes revealed the presence of acid mucopolysaccharide (Fig. 3C, D). It was confirmed that burr holes were filled with acid mucopolysaccharides in the CLE ingestion group. Moreover, the stained area with alcian blue in the CLE ingestion group was significantly higher (1.61 fold, P < 0.01) than that of the sham control group.
Estimation of peptides in the CLE digest
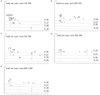
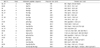
The peptides in the CLE digest of SEC fractions were analyzed with total ion positive mode using LC-MS/MS, at the range of m/z = 120–200, 200–250, 250–300, 300–400 and 400–1,000 (Fig. 4A, B, C, D and E, respectively). The peaks marked with Single-Letter Amino Acid Code and “Hyp” were estimated as amino acid based on their m/z of precursor ion. The peaks marked with lowercase were estimated as peptides based on the m/z of precursor ion and product ion pattern. We found that 20 peptides were estimated as constituents of the artificial CLE digest (Table 2). The peaks marked with asterisks were compounds that could not be estimated as peptides based on the m/z of precursor ion and product ion pattern (Fig. 4A, B, C, D and E, respectively). It was found that many peptides from CLE contained hydroxyproline (Hyp) or proline (Pro) in their sequence.
Analysis of CLE-derived peptides in human plasma
From three volunteers that ingested CLE, we collected and analyzed blood to identify peptides derived from CLE absorbed into their blood. Four oligopeptides (Pro-Hyp, Leu-Hyp, Glu-Hyp and Phe-Hyp) with increased ion intensity were detected in the plasma (Table 3).
Effect of peptides derived from CLE on chondrogenic progenitor cells
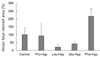
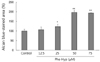
The acid mucopolysaccharide production-promoting activities of the four peptides from CLE identified in human plasma after CLE ingestion were investigated using ATDC5 cells. It was found that only Phe-Hyp at a concentration of 500 µM significantly promoted acid mucopolysaccharide production, while the other three peptides did not show any activity (Fig. 5). Compared with the control, treatment with 25, 50 and 75 µM of Phe-Hyp significantly increased acid mucopolysaccharide production (123%, 197%, and 193%, respectively; Fig. 6).
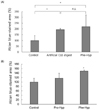
We next investigated how much Phe-Hyp contributed to the acid mucopolysaccharide production-promoting activity of whole CLE digests. Phe-Hyp in the artificial CLE digest was quantified by LC-MS/MS and the concentration of the peptide in the CLE digest was 1.03% (data not shown). Comparing 2,000 mg/mL of artificial CLE digest and 21 µg/mL (75 µM) of Phe-Hyp in consideration of material balance, there was no significant difference between the two samples, with both showing almost the same degree of acid mucopolysaccharide productionpromoting activity (Fig. 7A).
Based on the plasma concentration ratio of Pro-Hyp and Phe-Hyp observed after CLE ingestion (50:1, Table 3), Pro-Hyp and Phe-Hyp were separately added to the cells in consideration of this ratio (Pro-Hyp 2.5 mM, Phe-Hyp 50 µM). Although Pro-Hyp showed no significant difference from the control, Phe-Hyp significantly promoted acid mucopolysaccharide production (Fig. 7B).
DISCUSSION
In this study, we used animal and cell models to evaluate whether CLE induces the production of articular cartilage matrix and can be an effective food for treating or preventing OA. Since foods are absorbed after digestion, it is important to evaluate the digestion state of ingested foods. It was reported that in vitro angiotensin-converting enzyme inhibitory activity of whey protein and pea protein was evaluated after artificial digestion [17]. In this study, we conducted in vitro tests using an artificial digest of CLE. Pepsin and pancreatin are commonly used for artificial digestion, but it has been pointed out that digestion with only these two enzymes is not sufficient [1819]. Therefore, in addition to these enzymes, carboxypeptidase β and leucine aminopeptidase were used for preparing the artificial CLE digest. We confirmed that CLE was hydrolyzed into smaller molecules by artificial digestion.
Production of articular cartilage matrix in cells was evaluated using alcian blue which stains acid mucopolysaccharides, a major component of cartilage matrix [20]. Because ATDC5 cells, a chondrogenic progenitor cell, do not produce cartilage matrices, it is necessary to differentiate the cells into chondrocytes with insulin to evaluate the production of cartilage matrix [21]. We demonstrated that the artificial CLE digest promoted acid mucopolysaccharide production. Because deficiency of acid mucopolysaccharide promotes OA, CLE could be a suitable alternative for OA treatment.
In addition, we conducted an animal study to evaluate the effect of CLE in vivo. Burr holes were made in the rabbit's knee joint by surgery and CLE was orally administered to the animals. Macroscopic observation demonstrated that orally administered CLE had a tendency to accelerate wound healing of artificial burr holes compared with the sham control. OA has been reported to reduce the amount of cartilage matrix and production of the cartilage matrix which eventually causes low friction properties of articular cartilages [2223]. What is important is the content of which the burr holes are filled with, since the burr holes could be filled with materials that are not cartilage matrix. Using alcian blue staining, the holes were found to be filled with acid mucopolysaccharides. It was confirmed that orally administered CLE promoted the production of appropriate cartilage matrix and facilitated the healing of cartilage damage with the matrix.
We next identified the active ingredients in CLE. Since proteins and peptides are main components of CLE, we considered that smaller oligopeptides derived from CLE act as active ingredients after being absorbed through the intestine. The sequence of oligopeptides contained in the artificial CLE digest were estimated from the pattern of precursor ion and product ion obtained from analysis using LC-MS/MS. Twenty oligopeptides were estimated, many of which had Hyp or Pro at the C-terminus. It is reasonable that many peptides from the artificial CLE digest contained Hyp or Pro, because it was reported that peptides containing Hyp or Pro at the C-terminus are hardly degraded by intestinal digestion [24]. Peptides in the human body after CLE ingestion were screened, and four peptides were identified in the plasma: Pro-Hyp, Leu-Hyp, Glu-Hyp and Phe-Hyp. This result indicates that CLE is absorbed in the form of these peptides after digestion.
We subsequently found that Phe-Hyp was relevant to increase in acid mucopolysaccharide production in ATDC5 cells, while Pro-Hyp, Leu-Hyp and Glu-Hyp did not increase production. To estimate whether Phe-Hyp is the major active compound in the CLE digest and the proportion of contribution to the effect of CLE, Phe-Hyp and CLE digest were compared in terms of acid mucopolysaccharide production-promoting activity. We found that Phe-Hyp contributed to the majority of the activity of the CLE digest. It was reported that Pro-Hyp increased acid mucopolysaccharide production at a concentration of 2.5 mM [25]. Considering the abundance ratio of Pro-Hyp and Phe-Hyp in human plasma after CLE ingestion, the activities of the two peptides were then compared in vitro. Because Pro-Hyp and Phe-Hyp exists in human plasma at a molar ratio of 50:1 after CLE ingestion, Pro-Hyp and Phe-Hyp concentration used in the in vitro test were 2.5 mM and 50 µM, respectively. Phe-Hyp, but not Pro-Hyp, increased acid mucopolysaccharide production at the tested concentrations. These results indicate that Phe-Hyp derived from the CLE digest is the essential contributor to increasing production of the cartilage matrix in vivo.
In this study, it was shown that CLE stimulated the production of articular cartilage matrix both in vitro and in vivo, and that CLE could be an effective food for treating or preventing OA. Furthermore, only Phe-Hyp was confirmed as an active compound in the CLE digest, suggesting that the activity of CLE is attributed to Phe-Hyp.

 XML Download