

 PDF
PDF ePub
ePub Citation
 Print
Print


 , Kisun Nam2, YoonJu Song3
Abstract
Purpose
Methods
Results
Figures and Tables
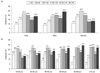 | Fig. 1Distribution of estimated glycemic load among Korean adults by sex (A) and age groups (B) using the data from 2013 ~ 2016 KNHANES. The complex sampling design parameters of the Korea National Health and Nutrition Examination Survey were used.
|
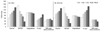 | Fig. 2Food group consumption of study participants according to quintile of energy-adjusted daily total estimated glycemic load (eGL) by sex. Q: quintile of energy-adjusted daily total eGL. %Servings = the number of servings consumed/the recommended number of servings based on the Dietary Reference Intakes for Koreans×100. MFEB: meat, fish, eggs, and beans. The complex sampling design parameters of the Korea National Health and Nutrition Examination Survey were used from a general linear model after adjusted for age, body mass index, education, household income, physical activity, smoking, alcohol consumption, and total energy intake. * p for trend < 0.05, ** p for trend < 0.0001
|
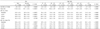
Table 2
Partial spearman correlation coefficients between estimated glycemic load (eGL) and macronutrient intakes by sex1)
![]()
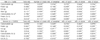
Table 3
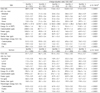
General characteristics of study participants according to quintile of energy-adjusted daily total estimated glycemic load (eGL) by sex1)

1) The complex sampling design parameters of the Korea National Health and Nutrition Examination Survey were used. All values are presented as mean ± standard error for continuous variables or n (%) for categorical variables.
2) Daily total eGL was energy-adjusted by residual method.
3) Physical activity: “yes”, performed vigorous-intensity activities for at least 75 min, or moderate-intensity activities for at least 150 min, or an equivalent combination of moderate- and vigorous-intensity activity during a typical week
4) Alcohol consumption: “none”, no consumption of any type of alcoholic beverage or drank less than once a month over the past year, “moderate”, drank alcoholic beverages more than once a month over the past year, “high”, drank more than 7 glasses of alcoholic beverages for men and 5 glasses of alcoholic beverages for women per occasion more than two times per week
5) Smoking: “never”, never smoked cigarettes of smoked < 100 cigarettes in lifetime, “former”, smoked ≥ 100 cigarettes in lifetime but current non-smoker, “current”, smoked ≥ 100 cigarette in lifetime and current smoker
![]()
Table 4
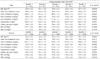
Mean estimated glycemic load (eGL) of mixed meal and macronutrient intake of study participants according to quintile of energy-adjusted daily total eGL by sex1)2)
1) The complex sampling design parameters of the Korea National Health and Nutrition Examination Survey were used.
2) All values are presented as adjusted mean ± standard error after adjusting for age, body mass index, education, household income, physical activity, smoking, alcohol consumption, and total energy intake (except energy intake).
3) Daily total eGL was energy-adjusted by residual method.
4) P for trends were obtained from a general linear model.
5) EER: Estimated energy requirement
![]()
Table 5
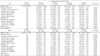
Anthropometric and biochemical variables of study participants according to quintile of energy-adjusted daily total estimated glycemic load (eGL) by sex1)2)3)
1) The complex sampling design parameters of the Korea National Health and Nutrition Examination Survey were used.
2) All values are adjusted mean ± standard error after adjusting for age, body mass index (except the model of waist circumference), education, household income, physical activity, smoking, alcohol consumption, and total energy intake.
3) Blood sample were collected from the participants after fasting for at least 8 hours or more.
4) Daily total eGL was energy-adjusted by residual method.
5) P for trends were obtained from a general linear model.
6) BMI: body mass index
7) HDL: high-density lipoprotein
8) LDL (low-density lipoprotein)-cholesterol was calculated in accordance with the Friedewald's formula for subjects whose triglyceride level was < 400 mg/dL.
9) DBP: diastolic blood pressure
10) SBP: systolic blood pressure
![]()
Table 6
Multivariable-adjusted odds ratios and 95% confidence intervals of metabolic diseases according to quintile of energy-adjusted daily total estimated glycemic load (eGL) by sex1)2)
1) The complex sampling design parameters of the Korea National Health and Nutrition Examination Survey were used.
2) Adjusted for age, body mass index (except the model of waist circumference), education, household income, physical activity, smoking, alcohol consumption, and total energy intake.
3) Daily total eGL was energy-adjusted by residual method.
4) P for trends were obtained from a multiple logistic regression analysis.
5) Metabolic syndrome was defined if three or more of following components were existed: increased waist circumference (men ≥ 90 cm, women ≥85 cm), elevated blood pressure (systolic blood pressure ≥ 130 mmHg or diastolic blood pressure ≥ 85 mmHg), reduced high-density lipoprotein (HDL) cholesterol (men < 40 mg/dL, women < 50 mg/dL), elevated triglycerides (≥ 150 mg/dL), and elevated fasting glucose (≥ 100 mg/dL).
6) Dyslipidemia was defined if one or more of following components were existed: elevated total cholesterol (≥ 240 mg/dL), elevated triglycerides (≥ 200 mg/dL), elevated low-density lipoprotein (LDL) cholesterol (≥ 160 mg/dL), and reduced HDL-cholesterol (men < 40 mg/dL, women < 50 mg/dL).
7) Systolic blood ≥ 140 mmHg or diastolic blood pressure ≥ 90 mmHg
8) Fasting blood glucose ≥ 126 mg/dL
![]()
 XML Download