

 PDF
PDF ePub
ePub Citation
 Print
Print


INTRODUCTION
According to Grundy et al. [1], metabolic syndrome (Mets) describes multiple metabolic disorders associated with elevated blood pressure, abdominal obesity, low high-density lipoprotein (HDL) cholesterol, hypertriglyceridemia, and hypertension. The prevalence of Mets in 2015 was 24.3% in 10 European countries [2] and 24.5% in China [3].
The dietary habits of Koreans have changed frequently due to rapid economic development and westernized living habits. Previous studies reported an age-standardized prevalence of Mets of 20.3% (95% confidence interval [CI], 19.6%–21%) based on data from the Korean National Health and Nutrition Examination Survey (KNHANES) VI (2013–2015) [4]. While the mechanism of ongoing Mets is not clear, the interaction of environmental factors such as genetic and health behavior factors (e.g., smoking, alcohol consumption, stress, sleeping duration, and breakfast intake) is involved [5]. Recent studies have reported Mets improvement or prevention through the management of risk factors such as physical activity [6] and breakfast consumption [7].
In 2014, the statistics of industrial accidents in Korean workers indicated that 415 (10.2% of the total 4,085) workers with work-related illnesses had CVD, which is closely related to the Mets. However, studies on work-related factors among Korean workers are thus far insufficient. There is a lack of population-based research on topics such as Korean workers. The factors affecting Mets in workers include age, sex [8], smoking status, physical activity level [9], diet [10], working hours [11], shift work [12], and occupation [13]. Wang et al. [12] reported that shift work is significantly associated with the risk of Mets, especially in those who are working long hours at night. Yu [11] reported that the relationship between working hours and Mets among 1,148 workers differed according to sex. The prevalence of Mets was significantly higher in women who worked more than 60 hrs/wk (odds ratio [OR], 2.21; 95% CI (1.07, 4.57) compared to that in women working 40–51 hrs/wk. However, the associations with Mets are not consistent due to differences in study subjects, designs, and period [1214]. Therefore, large-scale population-based studies are needed to analyze the association of working type and health-related factors with Mets.
SUBJECTS AND METHODS
Subjects and study design
The KNHANES, conducted by the Ministry of Health-Welfare and the Korea Centers for Disease Control and Prevention, is a cross-sectional study. The study design was a sample survey rather than a full survey and used a two-stage stratified cluster sampling. All estimates were weighted and calculated considering the complex study design. The 7th KNHANES, conducted from January to December 2016, included 3,513 households and 8,150 participants. After excluding pregnant and lactating women who could affect the onset of Mets, as well as self-employed and employers, unpaid family workers, unemployed individuals, and the non-economically-active population, a total of 4,666 participants were selected as the final analysis subjects in the present study.
This study was approved by the Institutional Review Board (IRB) of Chonnam National University, Gwangju, Korea (IRB: 1040198-180529-HR-052-01) and was performed in accordance with the principles of the Declaration of Helsinki.
Assessment of sociodemographic and health-related characteristics of workers
To analyze the sociodemographic characteristics of the subjects, as described in a previous study [17], the ages of the study subjects were grouped as follows: 19–34, 35–49, and 50–64 years. The classification of occupations in the KNHANES was based on standard occupational classifications, with managers, experts and related workers, clerks categorized as office workers, while service workers, sales workers, agriculture fishery skilled workers, functional and related functional workers, equipment, machine operators and assembly workers, and laborers were classified as non-office workers. Using the KNHANES' working hour variable, we classified the working type as day work (6 am–6 pm) and shift work. This shift work were included evening work (2 pm-midnight), night work (9 pm–8 am the next day), day and night regular shift work and all irregular shift work.
In the dietary survey, the frequency variables of eating breakfast and eating out for one week in the previous year were assessed. Eating out was defined as eating food prepared at places other than the home, such as food for delivery, pre-packaged food, or food provided by a religious group. This study did not consider snacks to be eating out.
Assessment of anthropometry, biochemical and nutrient intake characteristic
The anthropometry and biochemical characteristic of the participants were assessed by anthropometric measurements and BP, body mass index (BMI), WC, FBG, TG, and HDL-C data from the KNHANES. KNHANES was conducted by asking the participants to recall their food consumption in 24-hr during a face-to-face interview in order to estimate the daily energy and nutrient intakes. Detailed information on anthropometric and biochemical measurements, and nutrient intake characteristic is described elsewhere [4].
Statistical analysis
Statistical analysis was performed using SPSS 18.0 (SPSS Statistics, Armonk, NY, USA). Continuous variables were expressed as means ± standard deviation using the general linear model t-test. Categorical variables were presented as percentages (%) by chi-square tests. Multiple logistic regression analysis was performed to analyze the 95% CIs and the association between health-related factors of workers with the OR of Mets. In order to identify accurate associations through multiple logistic regression analysis, we used a regression model that corrected for confounding factors.
RESULTS
General characteristics of workers with metabolic syndrome
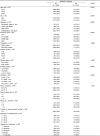
As shown in Table 1, participant age (P < 0.001), sex (P < 0.001), education level (P < 0.001), economic level (P < 0.001), occupation (P = 0.002), and working type (P = 0.004) differed significantly according to Mets status. Men and women comprised of 579 (56.7%) and 442 (43.3%) of participants in the Mets group, respectively. With regards to working type among participants with of Mets, 86.2% were day workers (n = 661) and 13.8% were shift workers (n = 106). In terms of health-related factors, smoking status (P < 0.001), alcohol consumption (P < 0.001), sleep duration (P = 0.016), aerobic physical activity (P < 0.001), frequency of breakfast consumption (P = 0.039), and frequency of eating out (P < 0.001) differed significantly according to Mets status. 58.6% (n = 598) of participants with Mets had sleeping durations of ≥ 8 hrs/day (P = 0.016). Regarding the frequency of breakfast consumption, 60.8% (n = 501) of the participants with Mets ate breakfast 5–7 times/wk. Finally, 45.3% (n = 373) of the participants with Mets reported eating out 1–6 times/wk, and 31.3% (258) reported eating out ≥ 1 time/day (P < 0.001).
Anthropometry, biochemical and, nutrition intake of workers with Mets
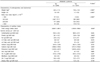
As shown in Table 2, among Met subjects, 54.5% (n = 555) were overweight (BMI 25.0–29.9 kg/m2) while 28.0% (n = 285) were normal weight (BMI 18.5–24.9 kg/m2). The total energy intake differed significantly between the Mets (2,103.8 kcal) and non-Mets (2,026.7 kcal) groups (P = 0.032). The protein (g/1,000 kcal), fat (g/1,000 kcal), n-6 fatty acid (g/1,000 kcal), riboflavin (mg/1,000 kcal) intakes (P < 0.05) differed significantly between the Mets and non-Mets groups.
Association between health-related factors and metabolic syndrome prevalence
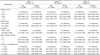
Health-related factors of the workers on Mets were analyzed and the data are presented in Table 3. In order to validate the health-related factors of workers with Mets, multiple logistic regression analysis was performed using the regression model as the confounding factor. Model 3 was adjusted for multiple confounding factors, including sex; age; BMI; education; economic level; smoking status; alcohol consumption; stress perception; aerobic physical activity; frequency of eating out; and intakes of total energy (kcal), protein (g/1,000 kcal), fat (g/1,000 kcal), n-6 fatty acids (g/1,000 kcal), and riboflavin (mg/1,000 kcal). With regard to working type, the adjusted odds ratio (AOR) of Mets increased by 1.726-fold (95% CI: 1.077–2.765)] in male day workers compared to male shift workers. Regarding breakfast frequency, the AOR of Mets decreased by 0.593-fold (95% CI: 0.372–0.944) for a frequency of 5–7 times/wk compared to < 1 time/wk in men. With regard to sleep duration, the AOR of Mets increased by 2.133-fold (95% CI: 1.041–4.368) for sleep duration of ≥ 8 hrs compared to < 6 hrs. Thus, the working type and frequency of breakfast consumption in men and sleep duration and frequency of breakfast consumption in women affected the prevalence of Mets in our study.
Participant characteristic according to working type
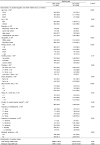
As shown in Table 3, the OR for Mets of day workers was higher than that of shift workers; thus, we sought to identify the health-related variables of day workers. Therefore, we analyzed the characteristics of subjects according to working type, as shown in Table 4. According to working type, there were significant differences in participant age (P < 0.001), sex (P=0.043), education (P < 0.001), occupation (P < 0.001), working hours (P < 0.001), alcohol consumption (P = 0.05), stress perception (P = 0.018), sleep duration (P < 0.001), frequency of breakfast consumption (P = 0.016), frequency of eating out, (P = 0.032), Mets (P = 0.004), and potassium intake (mg/1,000 kcal) (P = 0.030) between day and shift workers.
DISCUSSION
Mets risk factors are affected by the interactions between lifestyle factors such as smoking, alcohol consumption, stress, sleeping hours, breakfast intake, and physical activity [56]. The aim of this study was to identify the risk factor of Mets in Korean workers, including various health-related factors, using 2016 KNHANES data. Male day workers had a 1.726-fold increased prevalence of Mets compared to that of male shift workers (95% CI: 1.077–2.765). In addition, male consumption of breakfast 5–7 times/wk was associated with a 0.593-fold reduced risk of Mets compared to that in male workers who consumed breakfast < 1 time/wk (95% CI: 0.372–0.944). Similar to the report from Cheserek et al. [8], men in our study were more vulnerable to Mets than were women.
Traditional Korean dietary patterns have been westernized in recent decades and it has become common to substitute bread for rice in daily diets. Although the importance of breakfast as a healthy dietary factor has been reported [18], the breakfast type (ready-to-eat cereal breakfast, etc.) has changed and the ratio of those who skip breakfast is increasing [19].
In the KNHANES 2013–2016 report, 25.1% of men and 22.6% of women skipped breakfast in 2013, which increased to 29.5% and 24.9%, respectively, for in 2016 [19]. According to previous studies, compared to subjects who reported eating breakfast daily, the maximally-adjusted hazard ratios and 95% CIs of those with the frequencies of almost every day and 3–5, 1–2, and 0 days/week were 1.06 (95% CI, 0.73–1.53), 2.07 (95% CI, 1.20–3.56), 1.37 (95% CI, 0.82–2.29), and 2.12 (95% CI, 1.19–3.76), respectively [20]. There is increasing evidence that skipping breakfast is directly related to weight gain and other unhealthy results such as insulin resistance and T2D [18]. Thus, skipping breakfast, at least in part, might affect the risk of Mets. In our study, consuming breakfast 5–7 times/wk was associated with a 0.593-fold reduced OR (95% CI: 0.372–0.944) compared to consuming breakfast < 1 time/wk in men, while eating breakfast 1–2 times/wk was associated with a 0.393-fold reduced OR (95% CI: 0.161–0.962) compared to < 1 time/wk in women.
In this study, 20.6% of day workers ate out ≥ 1 times/day. Based on the KNHANES 2008–2014 report, the percentage of eating-out increased from 23.8% in 2008 to 28.3% in 2014 [21]. The negative effects of frequent eating-out on T2DM, CVD, Mets, and obesity have been reported and the frequency of eating-out is increasing, indicating the need to create healthy eating environments [22]. The results of the present study of a higher prevalence of Me ts among day worker compared to that of shift worker were in contrast to the results of a previous study [12].
Therefore, we analyzed the general characteristics of day workers. Table 4 shows that day workers were significantly older (P < 0.001) than shift workers and that male workers, with a higher prevalence of Mets than that in female workers (data not presented). In addition, day workers had a significantly higher distribution of office workers (P < 0.001) than shift workers as well as a higher distribution of workers who worked ≥ 40 hrs/wk. According to the OECD report, Korea's average working hours were 2,163 hrs/year (180 hrs/month) in 2013, which was second among 34 OECD member countries [23]. Although the definitions of long working hours (self-reported working hours) and shift work were not appropriately addressed, a systematic review of 12 prospective cohort and seven cross-sectional studies showed that the number of working hours was associated with disease, including depressive state, anxiety, sleep condition, and coronary heart disease [24]. However, our study observed no association between working hours and Mets.
As shown in Table 3, comparison of ≥ 8 and < 6 hrs/day sleep duration was associated with a 2.133-fold (95% CI: 1.041–4.368) increased prevalence of Mets in female workers. Furthermore, the sleep duration of women was associated with a 2.695-fold (95% CI: 1.252–5.801) increased OR of Mets in 6–8 hrs/day. In 2018, Kim et al. [25] reported that the effects of sleeping duration on Mets differed according to sex. In particular, women's sleeping duration was negatively related to Mets compared to that in men. Compared to < 6 hrs/day, the OR of Mets for sleep duration of 6–8 hrs/day increased by 1.12-fold (adjusted OR: 1.12, 95% CI: 1.05–1.19) in men and the OR of Mets for WC was also increased (1.09, 1.04–1.14) in women. Furthermore, in women, compared to < 6 hrs/day, a sleep duration of > 10 hrs/day was associated with Mets (1.40, 1.24–1.58), increased WC (1.14, 1.02–1.27), increased TG (1.41, 1.25–1.58), decreased HDL-C (1.24, 1.12–1.38), and elevated FBG (1.39, 1.23–1.57). Numerous studies (including ours) have suggested that long hours of sleep are not beneficial to health [2627].
Our study is meaningful in analyzing various risk factors of Mets among a representative population of adult Korean workers aged 19–64 years participating in the 7th KNHANES (2016). However, the KNHANES is not an investigation conducted for the specialized study of working characteristics; therefore, details on working environments such as shift hours, duration, and work intensity are not considered. In order to clarify their precise relationship with disease, additional studies including various variables related to worker environment are required. Also there is a limit to investigating the characteristics of sleep duration and stress perception using health-related factors. Sleep duration was not used as a sensitive measure of worker health as we examined hours only and not sleep quality. Despite these limitations, we sought to identify in depth the health-related factors of workers associated with Mets by calibrating variables that showed significant differences in the nutrient intake of the workers analyzed.
In conclusion, health-related factors (sleep duration, frequency of breakfast) and working type in Korean workers may affect the prevalence of Mets. Based on the results of analyzing the general characteristics of day workers, detailed studies are warranted on diseases among environmental factors related to the health of male workers.
 XML Download