

 PDF
PDF ePub
ePub Citation
 Print
Print


INTRODUCTION
Good nutrition through proper food selection is essential in early childhood since this is the period of growth, and childhood experiences and food preferences affect lifelong health and eating habits [1234]. With increasing intake of added sugar, the World Health Organization (WHO) recommends reducing the free sugar intake to less than 10% of total calories consumed [5]. According to the Korea National Health and Nutritional Survey (KNHANS), sugar intake from processed foods amounts to 10.5% of the total calorie intake, and natural sugar foods such as fruit and milk has a reduced intake, from 24.6 g ('2010) to 21.1 g ('2012) in 3-5 years old children [67]. Major processed food sources contributing to sugar intake in 3–5 years old children were ice cream, dairy products, bakery products, fruit and vegetable beverages, and confectionery products [8]. However, previous study were not evaluated nutrient density of the diet [8910].
Parents are most likely to prepare foods as per their child's requirements. Children are also influenced by the food preferences of parents, peer group, mass media, and socio-economic factors as well as nutritional knowledge [11]. Since children exposed to sweetness in infancy increase their sweets intake as they mature [212], it is necessary to provide an environment that reduces the intake of added sugar. Pre-school children have a short attention span, so they need fun, interesting, and hands-on education. Considering the characteristics of children, selection of an appropriate program imparting educational support on healthy foods is an effective and economic measure to reduce the sugar intake and develop healthy dietary habits [131415161718192021]. In a previous study, although short-term education increased the nutritional knowledge, there were no changes in the dietary behavior and intake [91022]. For children, multiple exposures were more effective than rewards [232425]. This effectiveness of multiple exposure was proven in the studies which the preferences of vegetables was increased by consuming small portions of vegetables for 14 days or vegetable soup for 9 weeks, or by repeated exposure for 15 weeks [222526].
This study therefore aims first, to investigate nutrient density and sugar intake of the diet, second, to identify the major dietary sources of sugar intake in pre-school children after nutrition education for discouraging sugar intake. Subsequently, we determine the effectiveness of the well designed and customized program for 11 weeks in pre-school children.
Go to : 
SUBJECTS AND METHODS
Subjects
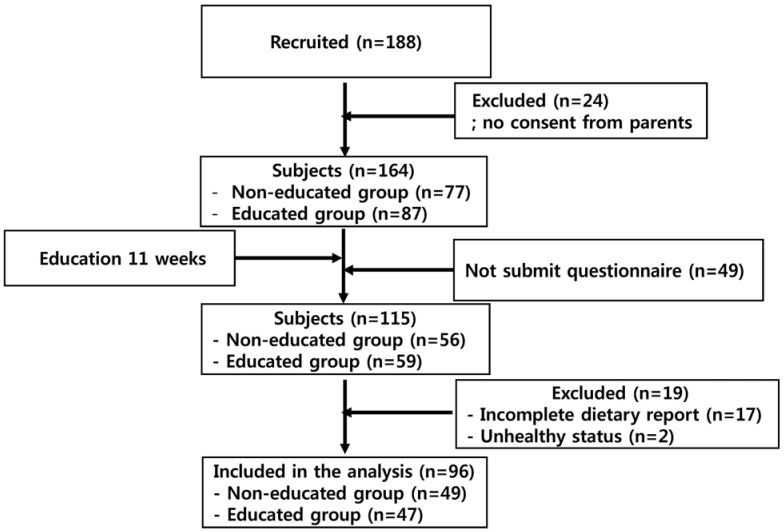
A total of 188 children aged 5 years were recruited in a convenience sampling of 10 pre-schools located in Dobong-gu, Seoul, Korea (Fig. 1). Written informed consent form was obtained from parents of all participating children; 24 children were excluded due to no consent from parents. The enrolled children were subdivided into two groups (educated; non-educated). After 11 weeks education, 68 children were excluded from the study: 49 children did not submit a questionnaire, 17 children submitted incomplete dietary reports, and 2 children had insufficient food intake due to unhealthy status. Final number included in the analysis were 96 children. All interviews and education were conducted by trained personnel, from April to August of 2017. This study was approved by the institutional review board of Duksung women's university (2017-004-004).
Education Programs
The social cognitive education method was adopted and strengthened on healthy sweetness [910]. The nutrition education program was developed based on the contents of ‘the story of the sugar’ developed by the Seoul Metropolitan Government, ‘the story of the new sugar’ and ‘aha! sugar it's!’ developed by Korea Ministry of Food and Drug Safety [9272829]. All education program was organized according to the ‘Nuri-course’ which is the curriculum for pre-school children. Considering the short concentration and comprehension capacity of pre-school children, education was focused on a hands-on education program, and consisted of cooking lab, play, activity, animation, songs, and visual materials (Table 1). The contents of the education program was composed to discourage the major sugar source foods of Korean children aged 3–5 years, through experiences of baked goods, beverages, sweetened milk, yogurt and yogurt products, and ice cream and sherbet [730]. Instead, fresh natural sugar source foods were encouraged to maintain healthy diet habits. In the program, nutritional knowledge was imparted utilizing animations, songs, visual materials, and the ○ · × quiz activities. Problems associated with excessive consumption of sugar were experienced by wearing an obesity experience suit and undertaking tooth decay prevention sticker activities [9].
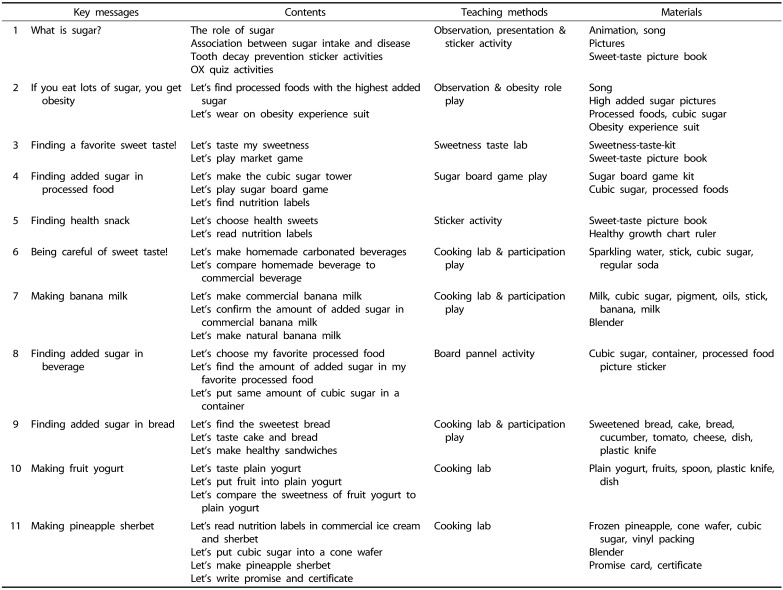
The sensibility on sweetness for children was tested with sweetness-taste-kit developed by the Korea Food and Drug Administration. Parents were informed to manage the proper diets for children at home. Market play and sweet-taste picture books were adopted in order to choose a healthy sweetness [9272829]. By apprising the process of making carbonated beverages through scientific activities, children were informed on the amount of added sugars in carbonated beverages, and the amount of pigment, flavor and added sugar in commercial banana milk [927]. Children were also made aware the amount of added sugar contents of commercial sweetened products by making natural banana milk and putting fruit into plain yogurt through cooking activities, or by comparing healthy sandwich using bread and sweetened bread [30]. Pineapple sherbet was made with frozen pineapple to allow children experience the sweetness of the natural product. In the pilot study, since children did not read the nutrition label when purchasing processed food, this program included specially designed nutrition labeling education [927282930].
Children were made aware of the amount of added sugar in processed foods by making the cubic sugar tower after reading the nutrition label of the processed food, or by making processed food after putting cubic sugar as per the nutrition label indicated [92829]. To extend nutrition education to the family meal, all nutrition education materials and contents were provided to the parents of all children.
General characteristics
The height and weight of pre-school children were directly measured by the researcher. BMI was classified by 2017 Korean National Growth Charts for children and adolescents; underweight was defined as BMI > 5th percentile, overweight was defined as 85th percentile < BMI < 95th percentile, and obesity was defined as BMI > 95th percentile [31].
Nutrition analysis
Dietary intake of nutrients and sugar
Trained interviewers obtained 3 consecutive days (2 weekdays, 1 weekend day) food recalls each child. For foods served at home and restaurant were recorded after parents were taught the adequate amount of food for pre-school children developed by Korea Ministry of Food and Drug Safety (KMFDS) [32]. The picture of food served at the pre-schools was taken by the teacher before and after eating with a digital camera, and the actual intake was used for analysis. Dietary intake of nutrients was analyzed; energy, carbohydrate, sugar, protein, fiber, potassium, iron, zinc, iodine using the CAN Pro 5.0 Web version. Dietary intake of total sugar was analyzed using the database of 940 foods provided by The Rural Development Administration (RDA), 100 processed foods provided by KMFDS, and 94 foods provided by USDA Nutrient Database as the primary database [333435]. Foods not available in the above database (23 domestic, 17 imported) were analyzed with similar items. To examine the nutritional quality of diet, nutrient density was calculated based on 1,000 Kcal.
Intake frequency of sugar source foods
Based on the Korea National Health and Nutrition Examination Food Frequency Questionnaire and Preliminary Studies, the intake of 13 major sugar source foods were surveyed [91636]. The intake frequency of sugar source foods was calculated based on the number of daily servings. Sugar source foods were grouped based on processed food segments of the KFDA: beverages; sweetened bread, rice cakes and cakes (sponge cake, cakes, chocolate pies, sweetened bread, cookies, crackers, tteokbokki); sweetened milk, yogurt and yogurt products (sweetened milk, yoghurt beverage, frozen yogurt); ice cream and sherbet; chocolate; ready-to-eat cereals; seasoned fried chicken.
Classification of total sugar intake
The dietary intake of total sugar was classified based on the percentage of energy consumed from total sugar intake. The total dietary intake of total sugar is classified as less than 10% (low total sugar intake segment; LS), 10 to 20% (adequate total sugar intake segment; AS), and more than 20% (high total sugar intake segment; HS) of total energy intake.
Statistical Analysis
Data were analyzed using the SAS program (Ver.9.4, SAS Institute Inc., Cary, NC, USA). Differences between the educated and the non-educated groups were verified by Chi-square test or T-test. Values in the text are mean ± standard deviations (SD). All statistical analysis was performed with significance level at P < 0.05.
Go to :
RESULTS
General Information
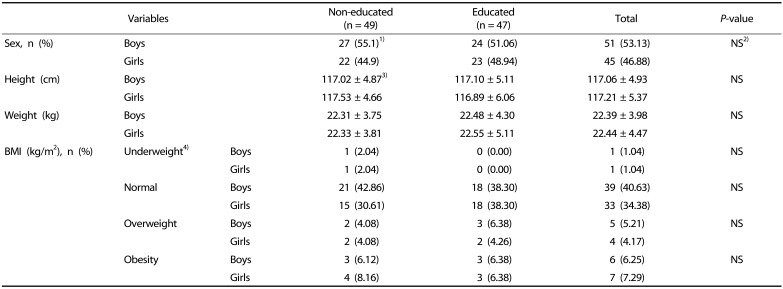
Table 2 shows the general characteristics of the survey subjects. Between the educated group and the non-educated group, there were no differences in sex ratio, height, weight and obesity status assessed by BMI. There were no differences of sex in height, weight and BMI between the two groups.
Nutrient density by nutrition education intervention
Table 3 presents nutrient density of the diet as assessed by nutrition education intervention. Energy intake is presented as the total energy intake, and the intakes of other nutrients including total sugar, vitamins and minerals are presented on the basis of 1,000 kcal. No statistical difference of total energy intake is observed between the educated and the non-educated groups due to large individual differences within each group, which is a common phenomenon of growing children. Compared to the non-educated group, the intakes of protein (P < 0.001), fiber (P < 0.01), potassium (P < 0.05), iron (P < 0.05), zinc (P < 0.05), and iodine (P < 0.001) are significantly higher, and the intakes of carbohydrate (P < 0.01) and total sugar (P < 0.05) were significantly lower in the educated group.
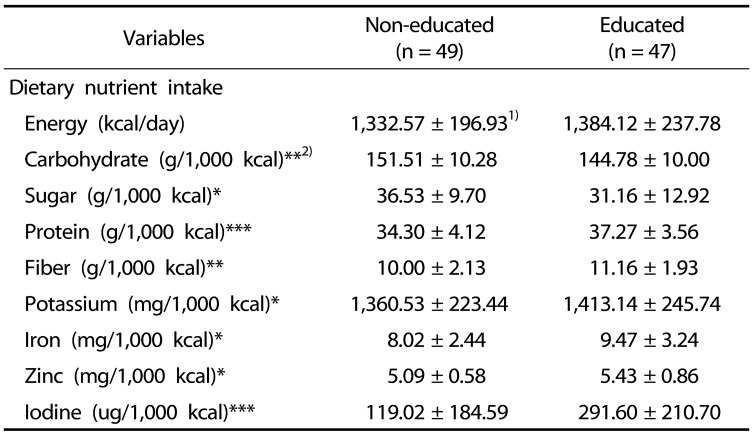
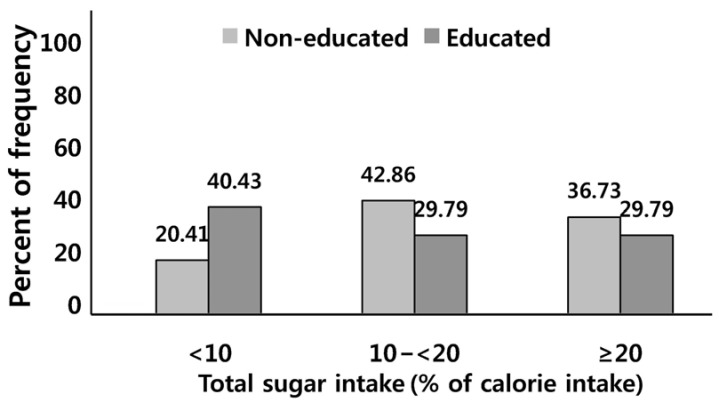
Fig. 2 shows percent distribution of the total sugar intake segment of children by nutrition education intervention. Approximately 1/3 of children had more than total sugar recommendation which is 20% of total calorie in two groups.
Difference in sugar source food by nutrition education intervention
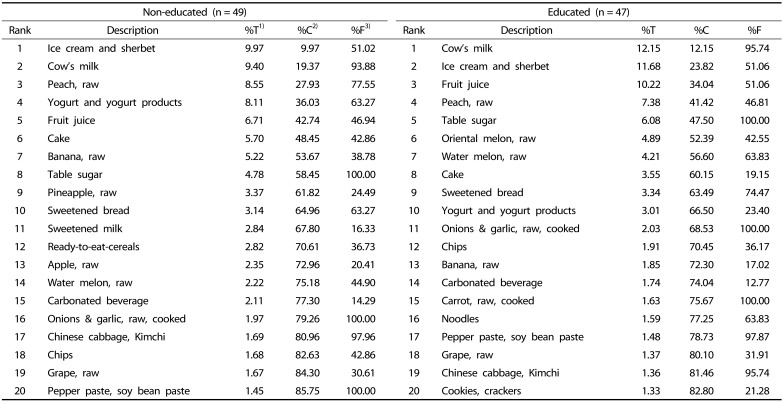
Table 4 presents major food sources of total sugar by nutrition education intervention. The cumulative percent of total sugar intake of top 20 sugar source foods in the educated group (82.80%) was lower than that of the non-educated group (85.75%). Furthermore, the individual contribution of sugar source food differed between the educated group and the non-educated group. Among the top 10 sugar source foods, milk showed the highest contribution of 12.15% of total sugar intake, followed by ice cream and sherbet 11.68%, fruit juice 10.22%, peach 7.38%, table sugar 6.08%, oriental melon 4.89%, water melon 4.21%, cake 3.55%, sweetened bread 3.34%, and yogurt and yogurt products 3.01% in the educated group. In the non-educated group, ice cream showed the highest contribution of 9.97% of total sugar intake, followed by milk 9.40%, peach 8.55%, yogurt and yogurt products 8.11%, fruit juice 6.71%, cake 5.70%, banana 5.22%, table sugar 4.78%, pineapple 3.37% and sweetened bread 3.14%. In the educated group, sweetened milk did not appear in the top 20 rankings. In the case of yogurt and yogurt products, it was ranked fourth in the non-educated group, with an intake of 8.11%, and was ranked tenth in the educated group with an intake of 3.01%. The consumption of total sugar was 14.97% in the educated group and 19.77% in the non-educated group from beverages such as sweetened milk, yogurt and yogurt products, fruit juice, and carbonated beverages. There was no significant difference between the groups with respect to consumption of carbonated beverages and sweetened bread with education intervention.
Difference in sugar source food by sugar intake status
Tables 5 and 6 show the difference in sugar source food by sugar intake status in the non-educated group and the educated group. In case of milk, the intake rates of AS and HS of the educated group were higher than in the non-educated group. Sweetened milk did not appear in the top 20 ranking of sugar source food of the educated group, but contributed to 7.84% in LS and 3.15% in HS of the non-educated group. The contribution of yogurt and yogurt products on sugar source food was 2.96% in LS, 3.03% in AS, and 3.02% in HS of the educated group, and 5.72% in LS, 9.21% in AS and 7.82% HS of the non-educated group, indicating that the relative consumption of yogurt and yogurt products is lower in the educated group. There was no difference as sugar source food between the educated group and the non-educated group with respect to sweetened bread.
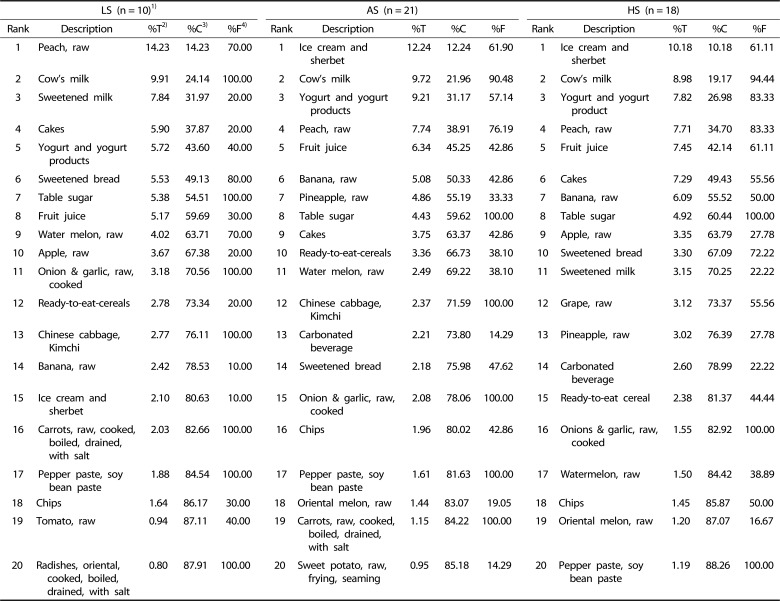
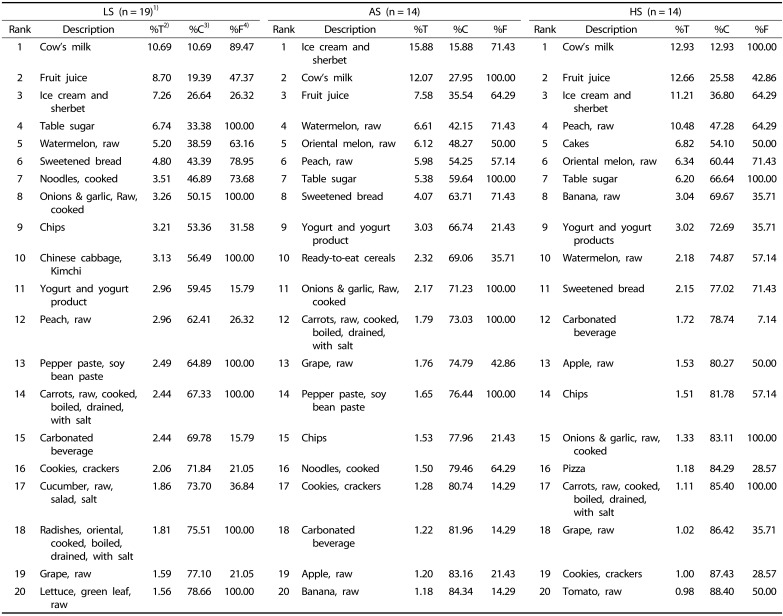
The consumptions of total sugar from beverages such as sweetened milk, yogurt and yogurt products, fruit juice, and carbonated beverages were 17.4% in HS, 11.83% in AS, and 14.1% in LS of the educated group, and 21.02% in HS, 17.76% in AS and 18.73% in LS of the non-educated group, indicating that the contribution of beverages on total sugar intake was lower in the educated group. Of the top 20 sugar food sources, 10 natural fresh foods and 10 processed foods were found in the LS of both groups. In HS, the educated group consumed more varieties of natural fresh food than the non-educated group.
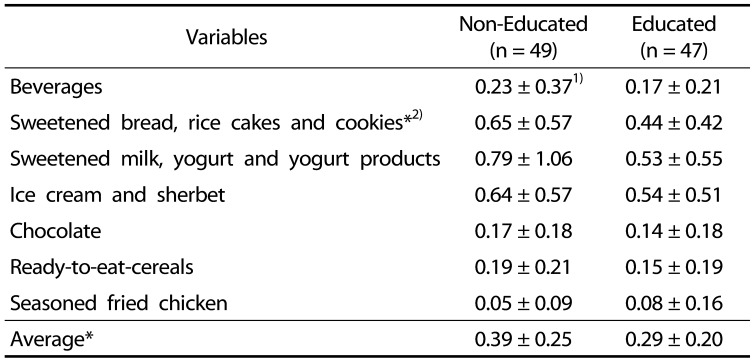
Difference in intake frequency of sweetened processed foods by educational intervention
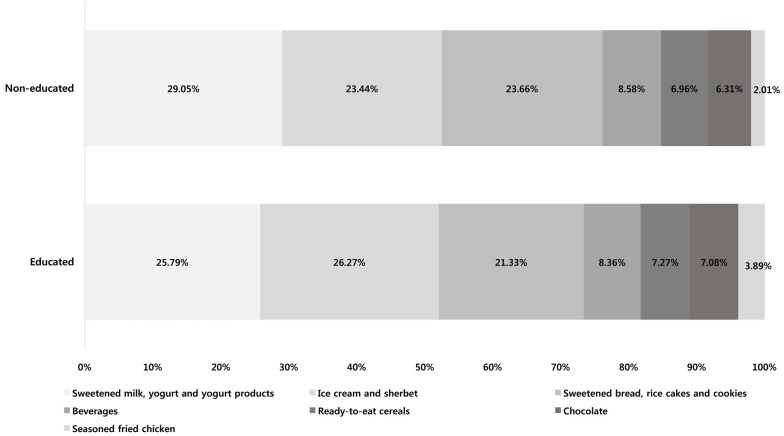
Table 7 presents the intake frequency of sweetened processed foods by educational intervention. The average frequency of consuming sugary foods, and the consumption of sweetened bread, rice cakes and cookies, was significantly lower in the educated group than that in the non-educated group (P < 0.05). As presented in Fig. 3, frequencies in the educated group (higher to lower) were in the order of ice cream and sherbet, sweetened milk, yogurt and yogurt products, sweetened bread, rice cakes and cookies, beverages, ready-to-eat-cereals, chocolate, and seasoned chicken. In the non-educated group, sweetened milk, yogurt and yogurt products, sweetened bread, rice cakes and cookies, ice cream and sherbet, beverages, ready-to-eat-cereals, chocolate, and seasoned chicken were the frequency order. The difference in the frequency of sweetened processed foods appeared in that of ice cream and sherbet, sweetened milk, yogurt and yogurt products, sweetened bread, rice cakes and cookies.
Go to :
DISCUSSION
Overall, nutrition education intervention on discouraging total sugar intake confers nutritional advantages in terms of higher nutrient density of diet and less intake frequency of sweetened processed foods in pre-school children.
Total energy intake shows no statistical difference between the educated group and the non-educated group due to large individual differences within groups, which is a common phenomenon of growing children. To exclude the bias due to the difference of total energy intake and to investigate the diet quality, nutrients, including total sugar, vitamins and minerals, are presented on the basis of 1,000 kcal.
A previous study in 8–13 years Korean children reports that the group whose total sugar intake is high had less protein, iron, and zinc [37]. According to the report of the British National Diet and Nutrition Survey (NDNS), in 4–18 years children having higher added sugar intake, the percentages consuming less than estimated average requirement (EAR) were 28% in iron, 36% in magnesium, 53% in zinc, and 31% in vitamin A [38]. Intakes of these nutrients in the non-educated group of the current study shows a similar pattern, i.e., higher sugar intake and lower intake of protein, iron, and zinc. On the other hand, the intakes of protein (P < 0.001), fiber (P < 0.01), potassium (P < 0.05), iron (P < 0.05), zinc (P < 0.05), and iodine (P < 0.001) were significantly higher, and the intakes of carbohydrate (P < 0.01) and total sugar (P < 0.05) were significantly lower in the educated group. Thus, the educated group in this study consumed nutrient dense diet compared to the non-educated group. However, even the educated group showed an excess intake of iodine 364% when compared with the RNI 80(µg/day 1,000 kcal) for pre-school children [39]. Thus, although those seaweeds are valuable source of fiber, iron, and other minerals in Korean traditional diet, consuming too much seaweed, including kelp, sea tangle, and laver, should be a concerning factor.
The total sugar intake per energy intake was 12.75% in the educated group and 14.52% in the non-educated group, indicating that both groups consumed less total sugar than the WHO recommendation and KDRI [539]. The total sugar intake of the non-educated group was similar to the data of Korea National Health and Nutrition Examination Survey (KNHNES 2008–2011) at 3–5 years of age, while the educated group showed lower intake [78]. Korea is the country whose total sugar intake of children is relatively lower compared to western countries: USA (26%, 4–13 yrs), Canada (26.6%, 1–8 yrs), Austria (23.7%, 4–8 yrs), UK (22.7%, 4–18 yrs), France (20.7%, 3–17 yrs), and Mexico (20%, 4–13 yrs) [4041424344]. Thus, nutrition education on discouraging total sugar intake results in ensured reduction of total sugar intake in pre-school children, although the total sugar intake is not high in their basal diet.
The top 10 total sugar food sources were milk, ice cream and sherbet, fruit juice, peach, sugar, oriental melon, water melon, cake, sweetened bread and yogurt and yogurt products in the educated group, and ice cream and sherbet, milk, peach, yogurt and yogurt products, fruit juice, cake, banana, sugar, pineapple and sweetened bread in the non-educated group. These tendencies are similar to total sugar food sources reported by KNHNES in 3–5 years: milk (14.1%), ice cream and sherbet (7.4%), yogurt and yogurt products (6.7%), breads (6.3%), and fruit juice (5.6%) [78]. In addition, in the top 20 total sugar food sources, the percent of total sugar from beverages (sweetened milk, fruit juice, carbonated beverage and yogurt and yogurt products) were 14.97% in the educated group and 19.77% in the non-educated group. Since beverages are the major sugar source food in western countries [44], the efforts to decrease the contribution of beverage on total sugar intake was an effective measure.
When educating children, the higher the frequency of exposure to sugary food, higher was the sugar intake reported [4546]. Various exposure effects are also seen in this study. The educated group exposed to reduced sugar foods show less total sugar intake. Especially, the activity of sweetened milk, which was composed of children's participation in changing of sweetness, flavor and color of milk, was effective for inducing the children's interest on the information of sweetened processed food. This effect was supported by the result of preference of milk type of educated group. Because sweetened milk was not included in the educated group while it was included in the non-educated group in top 20 sugar food source, although this sweetened milk was the major sugar source food for children other countries including France, Mexico, US and Canada [414447]. However, the activities of ice cream, beverage, yogurt products and sweetened bread, which changed only sweetness, showed no differences between two groups. Therefore, educational methods to reduce sugar intake should be tried in various ways, including multiple exposures, vision, taste and smell. Compared to the non-educated group, there was no difference in the frequency of sweetened processed food in the educated group after 4 weeks education [9]. However, the frequency of consuming sugary foods was significantly lower in the educated group with for 11 weeks in this study. Especially, this frequency was significantly lower when considering sweetened bread, rice cakes and cookies, which are major sugar food sources for children. This discrepancy might be from both the long-term effect of education and the hands-on education program focusing on children in this study. To reduce sugar intake and improve nutritional status of pre-school children, education intervention needs a repeated exposure in long-term, various educational method utilizing vision, taste and smell and connection with the family.
Therefore, it is suggested that nutrition education intervention on discouraging total sugar intake is effective not only in reducing the amount of total sugar and leading to higher nutrient density of diet, but also in reducing the intake frequency of sweetened processed food in pre-school children, if the well designed and customized programs are provided to pre-schools.
The limitation of this study is that it does not reflect seasonal effects, nor does it examine the with-in individual changes in their diet. Also, the socio-economic status of parents was not considered. There was no assessment on added sugar of total diet due to lack of database on added sugar.
Go to :
 XML Download