

 PDF
PDF ePub
ePub Citation
 Print
Print


INTRODUCTION
The importance of nutrition in hospitalized children is obvious. The prevalence of malnutrition in inpatient children has been reported as 6.1–37% not only in developing countries but also in developed countries [1234]. The malnutrition rate in pediatric patients admitted to hospital was also reported to be 12.5–30% in South Korea [56]. According to one Korean study, about a quarter of pediatric inpatients lost body weight during the first week of hospital stay, and surgical patients and those with long-term fasting showed increased risks of weight loss during hospitalization [5]. Malnutrition in hospitalized children can affect clinical courses of the disease and growth, and thus result in poor clinical outcomes.
The concept of nutritional support in hospitalized patients has emerged on the basis of in-hospital malnutrition and its clinical consequences. Nowadays, nutritional support for inpatients has made progress and it is provided systematically through multidisciplinary nutritional support teams (NSTs) in most hospitals. The first step to run and manage the NST effectively and efficiently in each hospital may be proper screening and selection of the patients who are at risk of malnutrition requiring nutritional support during hospitalization. Based on this reason, many studies on nutritional screening tools to evaluate the patients at risk of malnutrition have been actively conducted [78910]. As a result, a variety of nutritional screening tools have been developed and used in practice for adult patients, and many studies have validated and compared those adult screening tools in various types of hospitals, disease status, geographic areas, and age [111213].
Compared with nutritional screening tools for adults, those for pediatric patients were developed and introduced relatively later [14]. Sermet-Gaudelus et al. [15] first published a study on malnutrition risks in pediatric patients and a newly developed nutritional screening tool - the pediatric nutritional risk score (PNRS) for hospitalized children in 2000, the subjective global assessment (SGA) tool which was developed as a nutritional screening and assessment tool for adults was also applied to pediatric surgical patients as published in 2007 [16]. Between 2010 and 2012, three screening tools for pediatric patients were established; the paediatric Yorkhill malnutrition score (PYMS) [17], the screening tools for risk of nutritional status and growth (STRONGkids) [18], and the screening tool for the assessment of malnutrition in pediatrics (STAMP) [19]. In 2016, the simple pediatric nutrition screening tool for pediatric inpatients was additionally published [20]. However, validation studies on these pediatric screening tools are still lacking and no validation studies have been reported in Asian countries [1234], even though each screening tool was developed with different backgrounds. Furthermore, there is no consensus yet regarding which one is the most superior and which screening tool should be used in practice.
Therefore, the aim of this study was to compare the four pediatric nutritional screening tools in evaluating malnutrition risks of pediatric patients newly hospitalized to two tertiary medical centers in South Korea.
SUBJECTS AND METHODS
Subjects
This study was conducted with a retrospective review of electronic medical charts by two pediatric gastroenterologists with nutritional expertise. Pediatric patients under 18 years of age who were newly admitted to general wards of two tertiary hospitals between June 2016 and May 2017 were recruited. Patients admitted to the intensive care units or the closed psychiatric wards were excluded from the study.
Data collection
By using the initial records on basic patient information by the nurses and hospital records by the doctors, demographic, clinical, and anthropometric data at the time of admission was collected in all subjects recruited. Baseline database included age, sex, reasons for admission (diagnosis), recent appetite prior to admission, presence of pain, measured height and weight at admission, and current weight changes.
Anthropometry
Body weight was determined to the nearest 0.1 kg using a calibrated digital scale, and height was measured to the nearest 0.1 cm on a standard height board. Height and weight was converted to height-for-age z-score and weight-for-height z-score using the least mean squares method adjusted for age and gender based on the 2007 Korean National Growth Charts [21]. Wasting was defined as weight-for-height z-score less than −2 at the time of admission, and stunting was defined as height-for-age z-score less than −2 at admission.
Body mass index (BMI) was calculated as weight (kg) divided by height square (m2).
Nutritional screening tools for pediatric patients
For the application of PNRS to screen nutritional risk, diagnosis of underlying disease, the presence of pain, and decreased food intake less than 50% were checked and analyzed [15]. For nutrition screening using STAMP, a diagnosis that has any nutritional implications, recent decrease or poor nutritional intake, and weight and height status using a growth chart were checked and scored for overall risk of malnutrition [19]. For screening by PYMS, BMI below the cutoff value, recent weight loss, reduced intake for at least the past week, and recent admission or condition affecting the child's nutrition for at least the next week were all analyzed [17]. For nutritional screening by STRONGkids, subjective clinical assessment, high risk disease, nutritional intake, and weight loss were all assessed [17].
The scores of PNRS, STAMP, PYMS, and STRONGkids were calculated respectively based on medical records by two pediatric gastroenterologists in each hospital. All individual patients were classified as low (mild) / medium (moderate) / high risk for malnutrition based on the scores of each screening tool.
Ethics
This study was approved by the Institutional Review Board of the Seoul National University Bundang Hospital (IRB No. B-1802-453-104).
Statistics
SPSS version 22.0 (IBM Corp., Armonk, NY, USA) was used for data analyses. All values were expressed as a number (%) or mean ± standard deviation (SD). As clinical significance is not quite similar between low and medium (moderate) risk groups, statistical analysis was basically performed between low and medium (moderate) risk group and high risk group.
Agreement between the two screening tools was compared using Cohen's kappa coefficient. Fleiss's Kappa analysis was applied to evaluate the overall match of all four screening tools.
The sensitivity, specificity, positive predictive value, negative predictive value, and the area under the curve (AUC) of each four screening tool for predicting wasting and stunting status at the time of admission were calculated, respectively.
Statistical significant was defined when the P-value was less than 0.05.
RESULTS
Patient characteristics
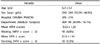
A total of 559 pediatric patients (mean age 6.3 ± 5.5 years, 310 boys and 249 girls) were enrolled from two tertiary hospitals. Demographic and anthropometric data are listed in Table 1. The prevalence of wasting and stunting at admission were 8.8% and 5.2%, respectively (Table 1).
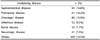
The departments at admission were predominantly medical departments in 469 (83.9%) patients. Underlying diseases of the subjects recruited were mainly gastrointestinal (16.8%), pulmonary (16.3%), and oncologic diseases (15.9%) (Table 2).
Prevalence of malnutrition according to each screening stool
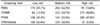
The prevalence of pediatric patients with a high risk of malnutrition was 48.8% and 47.8%, respectively, by applying STAMP and PYMS as a nutritional screening tool, whereas 16.6% and 5.5%, respectively, by using PNRS and STRONGkids (Table 3). Most patients were regarded as low to medium (moderate) risk groups according to PNRS and STRONGkids (83.3% and 94.5%, respectively) (Table 3).
Agreement between screening tools
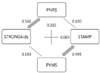
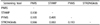
Agreements between each screening tool were evaluated by Cohen's kappa coefficient. PNRS and STRONGkids revealed moderate agreement (kappa = 0.566), and STAMP and PYMS showed moderate agreement (kappa = 0.495). However, PNRS versus STAMP, PNRS versus PYMS, STAMP versus STRONGkids, and PYMS versus STRONGkids revealed weak agreement (all Cohen's kappa value < 0.2) (Fig. 1, Table 4).
Fless's kappa coefficient revealed poor agreement among all four nutritional screening tools (kappa = 0.222, z = 12.8, P < 0.001) in newly hospitalized children.
Diagnostic accuracy of each nutritional screening tool
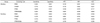
PYMS and STAMP revealed relatively higher sensitivity of 87.8% and 77.6%, respectively, for wasting and 72.4% and 75.9%, respectively, for stunting (Table 5). AUC was also relatively higher with PYMS and STAMP revealing 0.717 and 0.657, respectively, for wasting and 0.628 and 0.643, respectively, for stunting (Table 5).
DISCUSSION
Although pediatric patients are at risk of malnutrition at admission and even during hospitalization, the prevalence of malnutrition has not been precisely investigated due to lack of nutritional screening tools for children. Recently, several nutritional screening tools for hospitalized children were developed with different backgrounds [1234]. However, only a few validation studies have been published to date on the prevalence of malnutrition in pediatric patients using three of these pediatric screening tools i.e. STAMP, PYMS, and STRONGkids [1234]. From the aspect of comparison among pediatric nutritional screening tools, the present study is the first that compared the prevalence of malnutrition in hospitalized children and the diagnostic accuracy of all four pediatric screening tools including PNRS, STAMP, PYMS, and STRONGkids.
These four pediatric screening stools have some aspects in common since all of them include the change in appetite or oral intake and underlying diagnosis or condition that can affect nutritional intake or nutritional status as a part of the main principle items. Although both STAMP [19] and PYMS [17] include anthropometric parameters such as weight, height, or BMI in addition to those two items mentioned above, there are different characteristics because PYMS additionally includes weight loss, while STAMP does not. Similarly, PNRS includes pain [15], while STRONGkids [18] includes subjective observation, even though both PNRS and STRONGkids do not include anthropometric measurements.
When evaluating the prevalence of malnutrition and classifying malnutrition risks of hospitalized children by applying four pediatric nutritional screening tools, our study revealed the lowest proportion of 5.5% as a high risk group by STRONGkids, compared to 48.8% and 47.8% by STAMP and PYMS, respectively. According to a previous study comparing three screening tools of STRONGkids, STAMP, and PYMS in a single hospital, 52.5% and 69.6% of the children were classified as high risk groups by PYMS and STAMP, whereas only 7.8% was classified as high risk group by STRONGkids, similar to our results [4]. A recently reported prospective multi-center study in Europe also showed similar results to our present study with the lowest proportion of high risk groups to be 10% by STRONGkids [3].
In our study, the agreement of STAMP compared to PYMS and PNRS compared to STRONGkids were both high. According to a recent European multicenter study, the risk classification between each pair of nutritional screening tools revealed a similar agreement of 81 to 83% between two screening tools [3]. However, unlike a previous European study [3], STRONGkids compared to PYMS had no agreement in the present study. Furthermore, the agreement among all four pediatric nutritional screening tools by Fleiss's kappa analysis in our study also revealed no agreement.
Severely malnourished groups are significantly associated with wasting and stunting, and tend to have significantly longer hospital duration [16]. In the present study, the diagnostic accuracy of four pediatric screening tools were evaluated to screen nutritional risks of newly hospitalized children, and the sensitivity of PYMS and STAMP for wasting (weight for height z score ≤ −2) was relatively higher than PNRS and STRONGkids with 87.8% and 77.6%, respectively, and the sensitivity of PYMS and STAMP for stunting (height for age z score ≤ −2) were 72.4% and 75.9%, respectively. Similarly, in a recent Iranian study, weight for height z-score significantly correlated with PYMS and weight for age z-scores correlated with both STAMP and PYMS [4]. A recent European multicenter study also revealed that PYMS and STAMP recognized low BMI better [3]. Comparing the main principle items of PYMS and STAMP, there are two items related to anthropometry (BMI and recent weight loss) out of four principle items in PYMS, whereas only one item is related to anthropometry of four items in STAMP. For this reason, PYMS and STAMP could be closely related to wasting and stunting at admission. Therefore, PYMS and STAMP may be good indicators of wasting and stunting, suggesting malnutrition of pediatric patients.
As we mentioned before, each screening tool has its own characteristics. Considering the backgrounds of the development of each nutritional tool, the differences in patient group, coverage by health insurance, indication of hospitalization, and the differences in the national health policy may be additional reasons for the differences among these screening tools. This can be well-understood through the application of nutritional screening tools in specific settings. A UK study comparing modified STAMP and the PYMS tool in a single tertiary children's hospital involving 300 patients (median age 38 months) in an acute pediatric setting showed poor sensitivity for wasting or stunting, and the agreement between the two tools was also low; thus, this study concluded that modified STAMP and PYMS tools were difficult to use as a nutritional screening tool in the acute setting [22].
The present study has some limitations as a retrospective study. First, the initial data on food intake and appetite change was obtained from the initial information from nursing evaluation. Second, the item of subjective clinical assessment for STRONGkids was deduced through a thorough retrospective review of medical records on the patients' physical examination. Third, the validation of this study was mainly based on anthropometric parameters indicative of wasting and stunting, and the subjective global assessment was not evaluated for validation. Nevertheless, the fact that one pediatric nutrition specialist each in two hospitals reviewed the medical records and has obtained all hospital data is considered to be beneficial to obtaining homogeneous data.
In conclusion, from the results of our study, PNRS versus STRONGkids and STAMP versus PYMS revealed moderate agreement in evaluating nutritional risks for hospitalization children at the time of admission, even though all of these four pediatric screening tools showed poor agreement. Furthermore, in the present study, both PYMS and STAMP showed relatively higher diagnostic accuracy compared to PNRS or STRONGkids in evaluating nutritional status of hospitalized children. Different pediatric nutritional screening tools may have considerably different results in evaluating nutritional risks in newly admitted pediatric patients. Therefore, nutritional screening tools should be selected appropriately according to the situation of each hospital on the basis of understanding of the differences in configuring items of each nutritional screening tool.
 XML Download