

 PDF
PDF ePub
ePub Citation
 Print
Print


Seoyoung Park1 , Dongmin Lee2, Jaeseok Jeong3, Junghoon Moon4
, Dongmin Lee2, Jaeseok Jeong3, Junghoon Moon4
Abstract
Objectives
This research was conducted to identify the consumers' food choice factors that affect the consumers' replacement of soft drinks with carbonated water.
Methods
The present study used secondary data from a consumer panel survey conducted by the Rural Development Administration of Korea, and the data included the panel members' purchase records based on their monthly spending receipts. The survey asked the participants about their food choice factors and their personal responsibility for their health. This survey included independent variables for the consumers' food purchase factors. As a dependent variable, two types of groups were defined. The replacement group included those people who increased their purchase of carbonated water and decreased their purchase of soft drinks. The non-replacement group included those people who did not change their purchase patterns or they increased their purchase of soft drinks and they decreased their purchase of carbonated water. Logistic regression analysis was conducted to determine the consumers' food choice factors that were associated with replacing soft drinks with carbonated water.
Results
The replacement group was significantly associated with (1) a younger age (OR=0.953), (2) being a housewife (OR=2.03), (3) higher income (OR=1.001) and (4) less concern about price (OR=0.819) when purchasing food. This group also showed (5) higher enjoyment (OR=1.328) when choosing food and (6) they took greater responsibly for their personal health (OR=1.233).
Conclusions
This research is the first study to mainly focus on soft drinks and carbonated water. The result of this research showed that young, health-conscious consumers with a higher income and who are more interested in food have more possibilities to replace soft drinks with carbonated water. These research findings may be applied to consumers who have characteristics that are similar to the young health-conscious consumers and the results can help to suggest ways to reduce sugar intake and improve public health. However, this research has a limitation due to the application of secondary data. Therefore, a future study is needed to develop detailed survey questions about food choice factors and to extend these factors to all beverages, including soft drinks made with sugar substitutes, so as to reflect the growth of alternative industries that use artificial sweeteners or different types of sugar to make commercially available drinks.
Figures and Tables
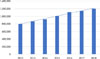 | Fig. 1Annual sales of total soft drinks in Korea (Unit: KRW 100 million) [37]
|
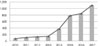 | Fig. 2Annual sales of carbonated water in Korea (Unit: KRW 100 million) [26]
|
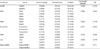
Table 1
General characteristics of subjects stratified according to replacement status
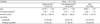
n, number; SD, standard deviation
Values are presented in mean ± SD or n (%)
1) Who increased purchase of carbonated water and decreased purchase of soft drink.
2) Who did not change a purchase pattern or who increased purchase of soft drink and decreased carbonated water.
3) Number of family member
4) Average monthly household income (Unit: KRW 10 thousand)
![]()

Acknowledgments
This work was carried out with the Support of “Cooperative Research Program for Agriculture Science and Technology Development (Project No. PJ01139001)” Rural Development Administration, Republic of Korea.
References
1. World Health Organization. WHO guide to identifying the economic consequences of disease and injury. Geneva: World Health Organization;2009. p. 1–100.
2. Meier T, Senftleben K, Deumelandt P, Christen O, Riedel K, Langer M. Healthcare costs associated with an adequate intake of sugars, salt and saturated fat in Germany: A health econometrical analysis. PLoS One. 2015; 10(9):e0135990.

3. Lee YC. An analysis of the current status of medical utilization for chronic diseases in Korea: Focused on medical expenses. Korea Health Industry Development Institute;2015. 11. Report No. 203.
4. Oh K, Lee H, Hu S, Shin Y, Oh J, Hwang K. A study on the dietary pattern and intake of potentially hazardous nutrients among Korean adults. National Institute of Food and Drug Safety Evaluation;2017. 12. Report No. TRKO201800035695.
5. Ministry of Food and Drug Safety. 1st Action plan for sugars reduction [internet]. Ministry of Food and Drug Safety;2016. cited 2019 May 16. Available from: https://www.mfds.go.kr/.
6. World Health Organization. Healthy diet [internet]. World Health Organization;2018. updated 2018 Oct 23. cited 2019 Jul 31. Available from: https://www.who.int/news-room/fact-sheets/detail/healthy-diet.
7. World Health Organization. Taxes on sugary drinks: Why do it?[internet]. World Health Organization;2017. cited 2019 May 31. Available from: https://apps.who.int/iris/handle/10665/260253.
8. Food and Drug Administration. Guidance for industry: Food labeling guide [internet]. Food and Drug Administration;2013. updated 2013 Jan. cited 2019 May 31. Available from: https://www.fda.gov/regulatory-information/search-fda-guidancedocuments/guidance-industry-food-labeling-guide.
9. Fletcher JM, Frisvold DE, Tefft N. The effects of soft drink taxes on child and adolescent consumption and weight outcomes. J Public Econ. 2010; 94(11):967–974.
10. Block JP, Chandra A, McManus KD, Willett WC. Point-ofpurchase price and education intervention to reduce consumption of sugary soft drinks. Am J Public Health. 2010; 100(8):1427–1433.
11. Fletcher JM, Frisvold D, Tefft N. Can soft drink taxes reduce population weight? Contemp Econ Policy. 2010; 28(1):23–35.
12. Genschow O, Reutner L, Wänke M. The color red reduces snack food and soft drink intake. Appetite. 2012; 58(2):699–702.
13. Billich N, Blake MR, Backholer K, Cobcroft M, Li V, Peeters A. The effect of sugar-sweetened beverage front-of-pack labels on drink selection, health knowledge and awareness: An online randomised controlled trial. Appetite. 2018; 128:233–241.
14. Swithers SE. Not-so-healthy sugar substitutes? Curr Opin Behav Sci. 2016; 9:106–110.
15. Husøy T, Mangschou B, Fotland TØ, Kolset SO, Jakobsen HN, Tømmerberg I. Reducing added sugar intake in Norway by replacing sugar sweetened beverages with beverages containing intense sweeteners - a risk benefit assessment. Food Chem Toxicol. 2008; 46(9):3099–3105.
16. Griffioen-Roose S, Smeets PA, Weijzen PL, van Rijn I, van den Bosch I, de Graaf C. Effect of replacing sugar with non-caloric sweeteners in beverages on the reward value after repeated exposure. PLoS One. 2013; 8(11):e81924.
17. Elfhag K, Tynelius P, Rasmussen F. Sugar-sweetened and artificially sweetened soft drinks in association to restrained, external and emotional eating. Physiol Behav. 2007; 91(2-3):191–195.
18. Zheng M, Rangan A, Olsen NJ, Andersen LB, Wedderkopp N, Kristensen P. Substituting sugar-sweetened beverages with water or milk is inversely associated with body fatness development from childhood to adolescence. Nutrition. 2015; 31(1):38–44.
19. Korea Agro-Fisheries&Food Trade Corporation. 2016 Processed food segment market report: Carbonated water. Korea Agro-Fisheries&Food Trade Corporation;2016. 12. Report No. 11-1543000-001380-01.
20. Jeong JM. US drink market, killing two birds with one stone: taste and health [internet]. Kotra;2016. updated 2016 May 09. cited 2019 May 31. Available from: https://news.kotra.or.kr/user/globalBbs/kotranews/782/globalBbsDataView.do?setIdx=243&dataIdx=149898.
21. International Bottled Water Association. 2018 IBWA progress report [internet]. International Bottled Water Association;2019. updated 2019 Jan 04. cited 2019 May 31. Available from: https://www.bottledwater.org/newsroom/ibwa-annual-report.
22. Kotra. US bottled water trend [internet]. Kotra;2019. updated 2019 May 29. cited 2019 Jun 03. Available from: http://news.kotra.or.kr/user/globalBbs/kotranews/782/globalBbsDataView.do?setIdx=243&dataIdx=175083.
23. Randall E, Sanjur D. Food preferences-their conceptualization and relationship to consumption. Ecol Food Nutr. 1981; 11(3):151–161.
24. Shepherd D. Dietary salt intake. Nutr Food Sci. 1985; 85(5):10–11.
25. Ministry of Food and Drug Safety. Korean food standards codex[internet]. Ministry of Food and Drug Safety;2019. updated 2019 Mar 08. cited 2019 May 31. Available from: https://www.foodsafetykorea.go.kr/portal/safefoodlife/food/foodRvlv/foodRvlv.do.
26. Kim I, Byun J. A study on the influence of 20’s consumer’s lifestyle on purchase intention of carbonated water. Korean J Hosp Tour. 2018; 27(6):205–223.
27. Steptoe A, Pollard TM, Wardle J. Development of a measure of the motives underlying the selection of food: the food choice questionnaire. Appetite. 1995; 25(3):267–284.
28. Solheim R, Lawless HT. Consumer purchase probability affected by attitude towards low-fat foods, liking, private body consciousness and information on fat and price. Food Qual Prefer. 1996; 7(2):137–143.
29. Clark JE. Taste and flavour: their importance in food choice and acceptance. Proc Nutr Soc. 1998; 57(4):639–643.
30. Ong LM, De Haes JC, Hoos AM, Lammes FB. Doctor-patient communication: A review of the literature. Soc Sci Med. 1995; 40(7):903–918.
31. Brashers E, Haas M, Klingle S, Neidig L. Collective AIDS activism and individuals' perceived self-advocacy in physician-patient communication. Hum Commun Res. 2000; 26(3):372–402.
32. Dutta-Bergman MJ. Primary sources of health information: comparisons in the domain of health attitudes, health cognitions, and health behaviors. Health Commun. 2004; 16(3):273–288.
33. Kwon O. Linking health risk information seeking and health behavioral intentions. Korean J Consum Advert Psychol. 2017; 18(2):293–313.
34. Lee S, Son H, Lee D, Kang H. The influence of e-health literacy, subjective health status, and health information seeking behavior on the internet on health promoting behavior. Korean Soc Wellness. 2017; 12(4):55–67.
35. Basu A, Dutta MJ. The relationship between health information seeking and community participation: the roles of health information orientation and efficacy. Health Commun. 2008; 23(1):70–79.
36. Korea Agro-Fisheries&Food Trade Corporation. 2017 Processed food segment market report: Sugar. Korea Agro-Fisheries&Food Trade Corporation;2017. 12. Report No. 11-1543000-002048-01.
37. NielsenKorea. Soft drinks retail sales [internet]. aT Food Information Statistics System;2018. cited 2019 May 31. Available from: http://www.atfis.or.kr/sales/M002020000/search.do?searchItem=CD00000575&searchDivision=CD00000601&searchCompany=2&searchYear=2018&searchQuarter=T&x=79&y=13.
 XML Download