

 PDF
PDF ePub
ePub Citation
 Print
Print


INTRODUCTION
An adequate nutrient intake along with diverse food consumption in preschool children is known to have significant impact on healthy growth and development. In addition, dietary habits formed in this period will persist into adulthood [1]. Therefore, evaluating diets of young children is essential to measure their nutritional health status and improve health in childhood and adulthood. Particularly, identifying foods that contribute to energy and nutrient intakes and their between-person variations could describe the overall dietary practice of the population. In addition, understanding food consumption patterns among preschool children is a prerequisite for the development of dietary assessment tools such as a food frequency questionnaire (FFQ) [2] and the establishment of food-based dietary guidelines for this specific age group.
Several previous studies have reported major food sources contributing to energy and nutrient intakes among preschool children in Western and Asian regions. Regardless of region, milk is the most important contributor to energy and nutrient intake in this age group [3456789]. Dairy products such as cheese, infant formulas, and yogurt additionally contribute to energy and nutrient intake of preschool children [45679]. Bread, meat, sugar-sweetened beverages, cake, and sweet desserts have been frequently observed as contributors to energy and nutrient intakes in Western countries [34579] whereas young children in Asian countries obtain large amounts of energy and nutrients from rice, cereals, tubers, and noodles that are main staple foods in Asia [6810].
To investigate dietary risk factors for some health outcomes, dietary assessment tools should be prepared to identify dietary difference among subjects. Thus, analysis on specific foods that contribute to between-person variations in nutrient intake has been frequently performed to select food items for inclusion in the FFQ [21112]. To develop food list of FFQ for children aged 3–11 years, a Japanese study [2] has identified food items that contribute to between-person variations in energy, protein, fat, and sodium intakes. They found that steamed white rice explained the highest percentage of between-person variations in energy and protein intakes. Milk and miso soup were also major contributors to between-person variations in nutrient intakes [2]. However, few studies have identified food items that explain differences in energy and nutrient intakes between individuals among young children.
Due to challenges in the assessment of dietary intake among young children, limited information on young children's diets is available compared to information for other age groups. Previous studies have explained that collecting dietary data from young children is demanding since this age group lacks the ability to report their diet. In addition, they tend to eat irregularly and their dietary intake change rapidly as they grow [1314]. Due to these limitations, little is known about major food sources of nutrients intake and how this contributes to between-person variations in nutrient intake among young children. In Korea, only a few studies have investigated diets of preschool children.
As food consumption patterns vary across gender, age, ethnicity, and country [1516], determining foods that contribute to nutrient intake and between-person variations in a specific population is necessary to accurately assess diets and tailor effective dietary recommendations. Therefore, the aim of this study was to evaluate the contribution of specific foods to absolute nutrient intake and between-person variations in nutrient intake among Korean preschool children using data from the 2009–2013 Korea National Health and Nutrition Examination Surveys (KNHANES).
SUBJECTS AND METHODS
Data and study subjects
For this study, a total of 2,766 preschool children aged 1–5 years who had 24-h dietary recall data in the 2009-2013 KNHANES were included. The KNHANES is a nationally representative, cross-sectional survey conducted by the Korea Centers for Disease Control and Prevention. It comprised the following three surveys: a health interview survey, a health examination survey, and a nutrition survey. Detailed information on the method and procedures of KNHANES is available elsewhere [17]. The Institutional Review Board (IRB) of the Korea Centers for Disease Control and Prevention approved the KNHANES survey protocol (2009-01CON-03-2C, 2010-02CON-21-C, 2011-02CON-06-C, 2012-01EXP-01-2C, and 2013-07CON-03-4C). Written informed consent was obtained from each child's parents or guardian.
Sociodemographic and dietary variables
Sociodemographic variables were obtained from the health interview survey. Residential areas were divided into rural, city, and metropolitan area. Monthly household income was grouped into five categories: < 1,300,000 won, 1,310,000–2,800,000 won, 2,810,000–3,900,000 won, 3,910,000-5,200,000 won, and ≥ 5,210,000 won. Dietary intake data were obtained by a single 24-h dietary recall of the nutrition survey. Total energy and nutrient intakes were calculated for each subject based on a Korean Food Composition Table [18]. Categorical variables such as sex, residential area, and household income are presented as percentages with standard errors (SE) while continuous variables such as age and nutrient intake are shown as mean ± standard error (SE).
Contributions of specific foods to absolute nutrient intake
Data on specific foods intakes were obtained through 24-h dietary recall. Food intakes were calculated based on the 3rd food code of KNHANES, a reclassification code that integrated with same food sources based on the 1st food code of KNHANES. For example, three kinds of 1st food code such as raw onion, dried onion, and cooked onion were given the same 3rd food code. Amounts of food intakes using the 3rd food code were derived by the KNHANES survey team considering water content of each food. Food codes consumed by less than 0.5% of study subjects were excluded from the analysis.
Contributions of specific foods to absolute nutrient intake were evaluated based on the percentage of total nutrient intake from each food. The top 10 food items contributing to absolute intakes of energy and nutrient were presented by age group. In addition, the number of foods items that accounted for 90% and 80% of absolute intake of each nutrient was suggested, respectively.
Contributions of specific foods to between-person variations in nutrient intake
To assess the contribution of specific foods to between-person variations in nutrient intake, stepwise multiple regressions were performed. In the stepwise multiple regression, total nutrient intake from all foods was included as a dependent variable while nutrient intake provided by each food was included as an independent variable. Cumulative R2 was used to assess the contribution of foods to variance in nutrient intake. The top 10 food items ranked according to R2 values were listed by age group. The number of food items with R2 values up to 0.90 and 0.80 for each nutrient was presented, respectively. Data were analyzed using Statistical Analysis System (SAS) program version 9.3 (SAS Institute, Inc., Cary, NC, USA).
RESULTS
General characteristics of study participants
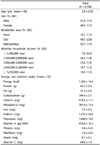
Characteristics of study participants are presented in Table 1. The mean age of study subjects was 3.0 years and 51.6% of participants were boys. Children living in city and metropolitan area accounted for 40.5% and 42.7% of participants, respectively. Participants' mean energy intake was 1,224 kcal.
Contribution of specific foods to absolute nutrient intake
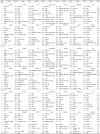
Major food sources of nutrient intakes by age group are shown in Table 2. White rice accounted for 31% of energy intake which was the highest, followed by milk (10.2%), bread (3.5%), cookies and biscuits (2.6%), egg (2.6%), and pork (2.5%). White rice and milk were the main food sources of protein, carbohydrate, phosphorus, iron, potassium, thiamin, riboflavin, and niacin. The percentage of fat contributed by milk was 21.3%, which was the highest, followed by pork (7.4%), soybean oil (6.2%), and egg (5.3%). Milk accounted for 45.9% of calcium intake. Other dairy products including yogurt, cheese, and ice cream also contributed to calcium intake. Regarding sodium intake, salt (17.6%), soy sauce (10.2%), and kimchi (6.6) were major contributors. Foods that provided more than 10% of vitamin A intake included laver (14.3%), milk (14.1%), and carrot (11.1%). Mandarine orange and strawberry provided 17.0% and 11.5% of vitamin C intake, respectively. By age group, milk and modified milk powder were shown as major contributors of nutrients among children aged 1–2 years whereas white rice and milk were main food sources among those aged 3–5 years. Total contribution explained by 10 food items for each nutrient was lower in 3–5 years compared to 1–2 years except for sodium.
Contribution of specific foods to between-person variations in nutrient intake
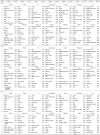
Table 3 shows top 10 foods contributing to between-person variations in energy and nutrient intakes by age group. The proportion of variability in energy and nutrient intakes explained by 10 food items ranged from 61% for potassium to 93% for calcium. For macronutrient intakes based on the stepwise regression model, the 10 food items accounted for 70–75% of between-person variations. White rice accounted for 25% and 40% of total variability in total energy and carbohydrate intakes, respectively. About 39% of variation for calcium intake was explained by milk while 40% of variation for phosphorous intake was explained by cheese. In younger children aged 1–2 years, modified milk powder also accounted for between-person variations in energy and nutrient intakes. Among children aged 3–5 years, cookies and biscuits were ranked as the major food source of between-person variations for energy and carbohydrate intakes.
Number of foods accounting for absolute nutrient intakes and between-person variations in nutrient intake
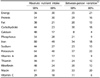
Table 4 presents the number of foods needed to explain at least 90% and 80% of absolute nutrient intakes and between-person variations for total energy and selected nutrients. The number of foods explaining 90% of absolute amounts of nutrient intakes varied from 28 items for vitamin A to 80 items for iron. For most nutrients, fewer foods were needed to explain 80% of absolute intakes compared to 90% of intakes. The number of food items required to explain 90% of betweenperson variations ranged from 8 (calcium) to 37 (potassium) depending on nutrients. The number of food items accounted for 80% of between-person variations was lower than that for 90%. Most nutrients required less than 20 food items to explain 80% of between-person variations except for energy, potassium, and niacin.
DISCUSSION
In this study, we ascertained specific foods that contributed to absolute intakes of energy and nutrients. We also identified foods which explained between-person variations in energy and nutrient intakes among Korean preschoolers. White rice and milk were major contributors to energy and nutrient intakes. The top 10 food items selected accounted for 40–73% of absolute intakes depending on the nutrient. White rice accounted for 25% and 40% of total variability in total energy and carbohydrate intakes, respectively. The top 10 foods contributing to between-person variations in nutrient intake were similar to food items that mainly contributed to absolute nutrient intake. The number of foods explaining 90% of absolute amounts of nutrient intakes varied from 28 for vitamin A to 80 for iron. For potassium, the highest number of foods was needed to explain between-person variations whereas the lowest number of foods was required to explain variations for calcium.
In our study population, two most important food sources of energy and nutrient intakes were white rice and milk. As rice is the main staple food in Asian countries, young children in China [8] also show high rice consumption as the major food contributor to energy and nutrient intakes. Thai National Health Examination Survey has reported that grains and starchy products are major contributors to energy and carbohydrate among 1–5-year-old children [6]. White rice is the main contributor to energy, carbohydrate, protein, phosphorus, potassium, and iron in the entire Korean population according to a report of Korea Health Statistics in 2016 [19]. In preschoolers from Western studies, cereals, bread, and pasta are commonly observed as major food sources of energy and carbohydrate [45].
Milk provided large proportion of energy and nutrients in preschoolers in the present study, consistent with other previous studies in Western countries [479] and Asia [6,8]. Among younger children aged 1–2 years in this study, modified milk powder also contributed to energy and nutrient intakes. Milk has been found to be the most important food source of energy and nutrient intakes until the age of 2 years [478]. Among US toddlers aged 12–24 months in the 2005–2012 NHANES, milk was ranked as the first food source of energy, protein, fat, carbohydrate, vitamin A, and potassium [7].
In the current study, foods rich in micronutrients were ranked as top 10 food sources. For example, milk and dairy products accounted for more than 60% of calcium intake while fruits were main food contributors to vitamin C intake. Among 696 Flemish preschoolers aged 2.5–6.5 years, milk, sweetened milk drinks, and cheese accounted for 59% of calcium intake [20] while sugared milk drinks, fried potatoes, milk, and fruit juices were main potassium sources [21]. In a sample of Australian preschool children with mean age of 3.5 years, key contributors to potassium intake were milk, yogurt, tropical fruit, and potatoes [2223]. Fruits and vegetables were main sources of vitamin C intake in young children aged 10–48 months in the Netherlands [5].
Energy-dense but low-nutrient food items such as sugar sweetened beverages, sweet bread, cakes, cookies, biscuits, and sweet desserts also provided substantial amounts of energy and fat among young children [34524]. Based on data from 2010–2011 Irish National Preschool Nutrition Survey, the proportion of energy intake from cakes, biscuits, and sweet desserts increased with age [24]. In addition, this dietary habit was observed in school-aged children and adolescents [2526]. These findings might be related to increased prevalence of childhood obesity in Western countries [27]. Identifying principal source of energy and nutrient among young children is necessary to provide effective nutritional strategies for the prevention and management of childhood obesity.
One more concern for some young children' diets was higher cheese consumption. Cheese was included in the top 10 food sources for fat and sodium intakes in this study. It was also highly ranked in food lists for fat and sodium variations (the first on fat and the third on sodium food lists). Fat and sodium are major dietary components that are nationally monitored and controlled to prevent non-communicable chronic diseases. On the other hand, cheese together with other dairy products was a major source for calcium of important nutrient for growing children. Caregivers' attention to adequate consumption of cheese is needed to prevent over-nutrition for fat or sodium. Low sodium products or replacement with healthy unsaturated fat sources also need to be considered.
In this study, the top 10 food items explained about 61–93% of between-person variances in energy and nutrient intakes. White rice accounted for a large portion of variability of energy and carbohydrate intake while milk was the major contributor to variation in intakes of calcium, potassium, and riboflavin among Korean young children. The calculation of between-person variation in nutrient intake was used for the selection of foods to be included in the process of developing FFQ [21112]. Similar to our finding, a previous study on the development of FFQ for Japanese children has identified that white rice is the most predictive food of between-person variations in energy and protein intakes and milk is also a major contributor to variation in energy, protein, and fat [2].
We found that for some nutrients, there were differences between major variation foods and major food sources. For example, soybean oil, cheese, instant noodles (ramen), and cake were listed in the top 10 foods of between-person variations in energy intake. However, they were not in the top 10 food sources of energy intake. In terms of carbohydrate, instant noodles, noodles, sweet potato, and cake were observed as between-person variation foods, although these food items were not major food sources. In addition, white rice was relatively a less important food in micronutrients except niacin in explaining between-person variability.
Depending on nutrients, the number of foods required to explain source of energy and nutrients or between-person variations varied. According to our data, 90% of absolute intake was estimated with relatively small number of food items (less than 30 items) for vitamin A and vitamin C while large number of food items were necessary for iron (80 items) and potassium (64 items) due to various food sources. Fewer foods were needed to account for a proportion of between-person variance in intake than those needed to explain the same proportion of study subjects' total intake. Most nutrients required less than 20 food items to account for 80% of between-person variations. In the case of total fat, the top 10 foods in our study explained much larger proportions of absolute intake and between-person variations compared to the top 10 foods observed in a Korean study on adults [28]. This finding implies that young children show lower levels of dietary diversity than adult population. In addition, this study showed that children aged 1–2 years had lower diversity in terms of food intake compared to those aged 3–5 years.
This study has several limitations. Dietary data obtained from a single 24-h dietary recall may not represent the usual intake of energy and nutrients. In addition, reporting on young children's diets by parents or caregivers could lead to under- or over-estimation of dietary intakes. Our analysis did not consider the consumption of breast milk or dietary supplements due to the lack of database. Despite these limitations, to the best of our knowledge, this is the first study to provide information on food consumption patterns influencing energy and nutrient intakes among preschool aged children in Korea. Our findings could be used to develop dietary assessment tools, including a food list for FFQ and establish food-based dietary guidelines for this specific age group. In addition, the current study might be helpful to suggest effective dietary strategies for the prevention of childhood obesity based on understanding of food intake patterns of preschoolers.
In conclusion, this study reported specific foods associated with energy and nutrient intakes as well as between-person variations in these intakes among young Korean children. As food consumption patterns vary according to age, sex, race/ethnicity, or country, our findings could help identify food items that are important for diets of Korean preschoolers. Understanding current food consumption related energy and nutrients in young children is needed to establish effective dietary guidelines and apply appropriate intervention.
 XML Download