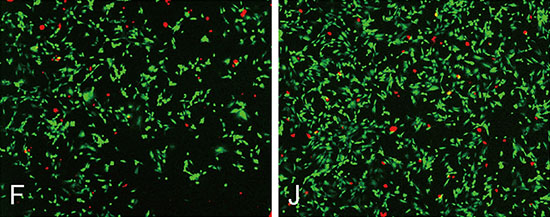
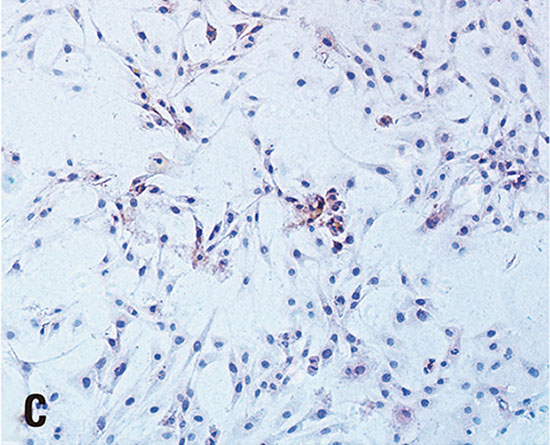
We regret to state that incorrect images were uploaded in Fig. 3F, Fig. 3J, and Fig. 7C. The authors apologize for these errors. Correct images are as follows.

Fig. 3. Cell viability was determined by fluorescein diacetate-propidium iodide staining, in which viable cells were stained green and dead cells were stained red. (A–D) Staining of primary osteoblasts treated with ZXHA-TC at concentrations of 0 µg/mL, 6.25×10⁻³ µg/mL, 6.25×10⁻² µg/mL, and 6.25×10⁻¹ µg/mL at 2 days. (E–H) Staining of primary osteoblasts treated with ZXHA-TC at concentrations of 0 µg/mL, 6.25×10⁻³ µg/mL, 6.25×10⁻² µg/mL, and 6.25×10⁻¹ µg/mL at 4 days. (I–L) Staining of primary osteoblasts treated with ZXHA-TC at concentrations of 0 µg/mL, 6.25×10⁻³ µg/mL, 6.25×10⁻² µg/mL, and 6.25×10⁻¹ µg/mL at 6 days. (M) Statistical analysis of the data from the staining pictures from A–L (n=3). As time elapsed, more and more dead cells were found in each group. Comparatively, more viable cells were found in the ZXHA-TC–treated groups, which indicated the positive effect on the primary osteoblasts. Scale bar=200 µm.

Fig. 7. Time-course of ALP activity and ALP staining of primary osteoblasts at different concentrations (0 µg/mL, 6.25×10⁻³ µg/mL, 6.25×10⁻² µg/mL, and 6.25×10⁻¹ µg/mL) of ZXHA-TC are exhibited. (A) Relative ALP activity (units/100 mL) was expressed as mean±2 SD, and the activity in 6.25×10⁻² µg/mL was significantly higher than other groups. ALP activity in the ZXHA-TC–treated groups increased from 2 to 4 days and decreased slightly from 4 to 6 days. However, the activity in the control increased over time. The bars with different letters at the same time are significantly different from each other (p<0.05; n=3), and those with similar letters indicate no significant difference. (B–E) Staining of primary osteoblasts treated with ZXHA-TC at concentrations of 0 µg/mL, 6.25×10⁻³ µg/mL, 6.25×10⁻² µg/mL, and 6.25×10⁻¹ µg/mL at 2 days. (F–I) Staining of primary osteoblasts treated with ZXHA-TC at concentrations of 0 µg/mL, 6.25×10⁻³ µg/mL, 6.25×10⁻² µg/mL, and 6.25×10⁻¹ µg/mL at 4 days. (J–M) Staining of primary osteoblasts treated with ZXHA-TC at concentrations of 0 µg/mL, 6.25×10⁻³ µg/mL, 6.25×10⁻² µg/mL, and 6.25×10⁻¹ µg/mL at 6 days. ALP staining in the ZXHA-TC–treated groups was strengthened from 2 to 4 days and was weakened slightly from 4 to 6 days, and the concentration of 6.25×10⁻² µg/mL performed best, which was in accordance the ALP activity results. Scale bar=200 µm. ALP, alkaline phosphatase.


 PDF
PDF ePub
ePub Citation
 Print
Print


 XML Download