

 PDF
PDF ePub
ePub Citation
 Print
Print


INTRODUCTION
No one can deny the importance of nutrition in any stages of life, especially during pregnancy. According to fetal origin's hypothesis, maternal nutrition during pregnancy has long-term effects on fetus health maternal nutritional deficiencies [1] and factors that lead to a healthy pregnancy include overall health, appropriate weight gain, physical activity during pregnancy, intake of various foods, mineral supplements and vitamins [2]. Maternal nutrition is the main determinant of fetal development, birth weight and disease of the infant, as well as the women's health and reproductive capacity. Anthropometric indicators are a simple, reliable and low-cost method for assessment of mothers' nutritional status [3].
The effects of maternal nutrition on some complications such as gestational diabetes mellitus (GDM) [4], pre-eclampsia, intrauterine growth limitation [5], low birth weight (LBW) [67], and small for gestational age (SGA) [8] has been presented in various studies. Some investigations have shown nutritional deficiencies [910] or excessive feeding [11] are associated with preterm birth. Furthermore, dietary antioxidant intake at pre-pregnancy stage was correlated to GDM [12].
Dietary pattern approach provides more comprehensive knowledge about nutrition and disease [13]. However, a dietary pattern is population-specific and can be influenced by socio-cultural factors [14] and food availability [151617]. Two separate analyses have reported the dietary patterns of pregnant women and frequency of eating during pregnancy may be related to preterm birth. Those who had eaten less than 3 main meals and 2 snacks daily have been shown to have a 30% higher risk of preterm birth in comparison with women who had used more food frequencies. Animal studies also have shown that 12–14 hours fasting during late pregnancy stimulates preterm birth. Short-term maternal deprivation also up-regulated the corticotropin-releasing hormone (CRH) hormone and messenger RNA in a variety of mice brain [10].
Observing an association between pre-pregnancy body mass index and pregnancy outcomes in western countries has been reported [18]. The global epidemic of obesity is a factor affecting women' age of fertility and leading to the adverse outcomes of pregnancy and birth. The purpose of this study was to identify dietary patterns and their relations with pregnancy outcomes including GDM, anemia, LBW, preterm, macrosomia, among the pre-pregnancy and early pregnancy stages.
MATERIALS AND METHODS
Subjects
This cohort study was implemented in 150 pregnant women in the first trimester of pregnancy admitted to the health centers Selseleh County, Lorestan Province, Iran (between April 22, 2017 and March 1, 2018). It was approved by the Research and Ethics Committee of Isfahan University of Medical Sciences (IRB No. 1396.3.248).
The inclusion criteria were: being in the first trimester of pregnancy and age between 20–40 years. Subjects with chronic diseases such as hypertension, heart and renal disease [192021], other types of diabetes; and adherence to special diet were excluded. A signed consent was prepared from each volunteer and details of the research were explained.
Maternal demographic details, medical history, pregnancy history, and anthropometric measurements were obtained from the mother at the baseline visit using a structured questionnaire and interview. Data regarding age, parity, history of diabetes, and hypertension were obtained by interview.
Maternal height was obtained at the first visit, and weight was measured by a calibrated scale at each visit.
Dietary intakes were gathered by a validated 168-items semi-quantitative food frequency questionnaire (FFQ) for the last 6 months period [22]. The reliability and validity of this questionnaire had been confirmed by previous studies [2324]. Data from FFQ were ultimately converted to grams using household measures for analysis. Gestational diabetes was diagnosed based on American Diabetes Association (ADA) criteria [25] (fasting ≥ 95 mg/dL [5.3 mmol/L]; 1 hour ≥ 180 mg/dL [10.0 mmol/L]; 2 hours ≥ 155 mg/dL [8.6 mmol/L]; 3 hours ≥ 140 mg/dL [7.8 mmol/L]) for 2 or more of oral glucose tolerance test (OGTT), GDM was defined.
Newborn characteristics
Newborn characteristics, including sex, gestational age at birth, weight, height, and head circumference were recorded at the time of delivery.
Statistical analysis
Factor analysis with varimax rotation was applied to distinguish major dietary patterns. Factor loading matrix values greater than 0.3 were considered for determining the principal items of each dietary pattern [31]. One-way analysis of variance (ANOVA) and Pearson's χ2 tests were selected to determine significant differences for quantitative and categorical variables, respectively. Finding the best predictor for dietary patterns was examined through linear regression analysis. The odds ratio (OR) was adjusted for maternal age, disease history, catching diseases, and energy intake. The high fiber dietary pattern was assumed as a reference pattern in this model. All analysis was done with SPSS ver. 24 (SPSS Inc., Chicago, IL, USA) and p < 0.05 was considered as the level of significance.
RESULTS
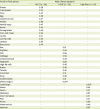
We identified three major dietary patterns of study populations, as presented in Table 1. The key factors accounted for 16.6% of the variance in food group intakes. High Carbohydrate-Lower Fat (HCLF; n = 34) dietary pattern consisted of fried potato, egg, cooked carrots, pickles, noodle soup, beans, pomegranates, corn and maize, lentils, low-fat milk, lettuce, and raw carrots. The second dietary pattern, High Carbohydrate-Higher Fat (HCHF; n = 55) included pea, soybean, fish, cabbage, cooked spinach, vegetables, high-fat milk, butter, tomatoes, cucumbers, cooked beans, cooked barley, vegetable soup (containing onion, extra virgin olive oil, green cabbage, chicken broth, and carrot), diluted yogurt, and persimmons. Cantaloupe, melon, peach, nectarine, green tomatoes, plums, watermelons, pears, and apricots were also the main constituents of a high fiber dietary pattern (n = 61).
Table 1
Food grouping used in the dietary pattern analyses
![]()
Table 2 shows the general characteristics of the mothers. The χ2 test and ANOVA did not show any significant difference between job, age, height and weight of the mothers and among dietary patterns (p > 0.05).
Table 2
Maternal characteristics and pregnancy outcomes according to dietary patterns (n = 150)

Values are presented as number (%) or mean ± standard deviation.
HCLF, High Carbohydrate-Lower Fat; HCHF, High Carbohydrate-Higher Fat; GDM, gestational diabetes mellitus; ANOVA, analysis of variance.
*Percentage of participants in the pattern, relative to the total number of participants; †The results were interpreted at a 95% confidence level. χ2 test for qualitative and one-way ANOVA for quantitative variables were used; ‡p < 0.05 considered as significant.
![]()
Relationship between maternal dietary patterns and maternal pregnancy outcomes including GDM and anemia are presented in Table 2.
The percentage of GDM in participants with the high fiber pattern was significantly lower than the other dietary patterns (0.7% vs. 6%, p < 0.05).
Table 3 shows the general characteristics of the newborns, the χ2 test and ANOVA did not show any significant difference between subgroups of gender (of the neonates) and maternal dietary patterns (p > 0.05). However, frequency of fetal macrosomia (n = 19) was significantly different between patterns (p = 0.02).
Table 3
Relationship between maternal dietary patterns and neonatal outcomes (n = 150)

Values are presented as number (%) or mean ± standard deviation.
HCLF, High Carbohydrate-Lower Fat; HCHF, High Carbohydrate-Higher Fat; ANOVA, analysis of variance; LBM, low birth weight.
*Percentage of participants in the pattern, relative to the total number of participants; †The results were interpreted at a 95% confidence level. χ2 test for qualitative and one-way ANOVA for quantitative variables were used; ‡p < 0.05 considered as significant.
![]()
As seen in Table 4, none of the neonates' weight, height and head circumference predicted maternal energy intake (R2 = 0.028, p > 0.05).
Table 4
Regression coefficients (ß) of the relationship between maternal energy intake and the neonates' weight, height, and head circumference

| Variable | β | t | p value* | R2 |
|---|---|---|---|---|
| Neonates' weight | −0.29 | −1.96 | 0.059 | 0.028 |
| Neonates' height | −6.14 | −0.263 | 0.79 | |
| Neonates' head circumference | 15.50 | 0.40 | 0.68 |
![]()
Finally, we designed an adjusted model using mothers' age, disease history, catching diseases, and energy intake and considered the high fiber pattern as reference category (Table 5); those in the HCLF pattern were more likely to have GDM, either in crude (OR, 12.8; confidence interval [CI],1.47–24.54) or adjusted model (OR, 15.08; CI, 1.5–26.4).
Table 5
Estimating OR and 95% CI of the crude and adjusted models for observed maternal and neonatal outcomes in terms of identified dietary patterns

OR, odds ratio; CI, confidence interval; HCLF, High Carbohydrate-Lower Fat; HCHF, High Carbohydrate-Higher Fat; GDM, gestational diabetes mellitus; LBM, low birth weight.
*Adjusted for mothers' age, disease history, catching diseases, and energy intake.
![]()
In addition, adherence to HCLF or HCHF pattern had no significant effect on anemia and neonatal outcomes (preterm, macrosomia, LBW), both in crude and adjusted model (Table 5).
Pregnancy is independent of pre-pregnancy weight. The Norwegian Directorate of Health recommended that women with a normal pre-pregnancy weight gain 11.5–16 kg and obese women gain 5–9 kg during pregnancy; so, these actions decrease the risks of diseases, deaths and health problems which may threaten both mothers and infants. Excessive weight gain of mothers is also an independent predictor of childhood obesity (20).
Although several observational studies have demonstrated a relationship between specific dietary patterns and maternal/neonatal outcomes, the conclusions are ambiguous and varied. The purpose of this cohort study was to identify dietary patterns and their relations with GDM, anemia, and neonatal status (LBW, preterm, macrosomia, anthropometric indices) in a sample of pregnant women.
DISCUSSION
In the present study, we identified three major dietary patterns using 168 items FFQ and factor analysis method and then assessed the association between them and GDM, anemia, mothers' anthropometric indices and neonatal status (LBW, preterm, macrosomia, anthropometric indices) in 150 pregnant women. Subjects adhering to two unhealthy (HCLF and HCHF) and one healthy (high fiber) pattern showed significant mean differences regarding GDM and fetal macrosomia, but it was not statistically significant for anemia, sociodemographic and anthropometric measurements; even after controlling for mothers' age, history of diseases, catching diseases and energy intake.
According to our study, high fiber pattern was related to lower GDM rates, but a significantly higher number of macrosomia was seen among neonates in this pattern. The reason is not clear, however, in one recent study conducted by Cheng et al., maternal soluble fiber diet consumption improved growth performance in piglets [32]. Perhaps over-effectiveness of maternal dietary fiber consumption results in macrosomia, so more investigations are needed.
A study conducted by Tobias et al. [33] in 2012 assessed that dietary pattern during pregnancy were negatively associated with the risk of gestational diabetes after adjustment of several variables. They concluded that adherence to a healthy dietary pattern before pregnancy is significantly associated with a lower risk of GDM. Obviously, the present study indicated a significant difference between three dietary patterns across the GDM.
Zhang et al. [34]—in a cohort study—identified 2 dietary patterns including “prudent” dietary pattern with high intake of fruits, vegetables, poultry and fish, and “Western” dietary pattern with high consumption of red meat, processed meat, refined grains, sweets and pizza. Their findings showed that the maternal dietary pattern before pregnancy can affect the risk of progression of GDM, and diet rich in red and processed meat is associated with a significantly greater risk of GDM.
Liu et al. [18] conducted a retrospective population-based cohort study of 5,047 singleton nulliparous pregnancies with the aim of identifying the effect of the pre-pregnancy body mass index on undesirable pregnancy outcomes in the north of China. They showed that the risk of outcomes such as pre-eclampsia, GDM, and large for gestational age newborns is significantly larger in overweight and obese than in normal weight women. However, in contrast to our results, the prevalence of newborns that were anemic or SGA was significantly higher in the low-weight group [18].
Normal weight during pregnancy and its effects on maternal and neonatal outcomes is an area of interest for many researchers. In a prospective cohort study in Norway on 56,101 pregnant women, Haugen et al. [35] reported that pregnant mothers' weight gain above the recommended level of the American Institute of Medicine significantly increase the risk of pregnancy blood pressure, neonates' high birth weight, and preeclampsia and for women of normal weight and overweight, the risk of adverse outcomes for neonates increased in general. However, in our study, we did not discover any association between anthropometric indices and maternal and neonatal outcomes.
Most of the studies that were conducted on assessment of mothers' nutritional status during pregnancy were based on anthropometric and energy intake criteria and had scarcely dealt with the dietary patterns [36]. Majority of them indicated that maternal weight gain during pregnancy is a predictor of the birth weight of neonate [37]. Results of a cohort study among Norwegian women (n = 66,000) and children revealed that in the early stages of pregnancy, adherence to a healthy dietary pattern (high intakes of vegetable, fruit, fat, water, and whole grains) and a “traditional” dietary pattern (potatoes and fish as a key element) was associated with a significantly lower risk of preterm delivery. Compliance with healthy patterns during pregnancy (fruits, vegetables, poultry, and breakfast grains) or an intermediate dietary pattern (low-fat dairy, fruit, and red meat) was associated with reduction in the chances of SGA infants in comparison with western pattern (high-fat dairy, refined grains and processed meat) [15].
In another study designed by Grieger et al. [1] of 309 Australian pregnant women, relations between maternal dietary patterns 12 months before pregnancy and fetal development and preterm delivery was investigated. First, three dietary patterns were discovered: 1) high protein/fruit (fish, meat, chicken, fruit and some whole grains); 2) high fat/sugar (potato chips, refined grains); and 3) vegetarian (vegetables, legumes and whole grains). They observed a strong correlation between the high protein/fruit dietary pattern and intake of omega-3 long-chain fatty acid levels, proteins, cholesterol, zinc, iron, and sodium. High fat/sugar diet was associated with a significant increase in alpha-linolenic acid, saturated fat, total fat, energy, carbohydrates, and monounsaturated fatty acids. The strongest correlation was observed in the vegetarian dietary pattern for fiber intake and it had a moderate association with dietary folate and vitamin A. High protein/fruit pattern was also associated with a reduction in the preterm birth rate, while high fat/sugar pattern had an inverse correlation. None of these dietary patterns had a relationship with LBW and SGA birth [1]. Correspondingly, in our study, high fiber pattern was related to lower GDM rates, but a significantly higher number of macrosomia was seen among neonates in this pattern.
Researchers believe, among the anthropometric indices of infants at birth, weight and head circumference are more likely to be affected by maternal nutrition during pregnancy [838], However, a relationship between maternal nutritional patterns and the infant's anthropometric indices was not detected in our research and this may be due to the fact that we examined the maternal dietary patterns before and during pregnancy. Infants' height at birth is influenced less by the maternal dietary pattern compared to genetic and ethnic factors [35].
There are some limitations in the current study. The sample size was small and our study did not provide additional information about serum micronutrient concentrations. The intake of iron supplements by pregnant women from the 16th week of pregnancy was an area of bias, and we could not eliminate this effect. Filling 168-item FFQ and anthropometric measurements was prone to recall and measurement bias, respectively. In addition, they were time-consuming and boring for participants; however, we tried to control this challenge with relaxation methods and subjects were carefully interviewed by a skilled interviewer.
 XML Download