

 PDF
PDF ePub
ePub Citation
 Print
Print


INTRODUCTION
Patients with chronic kidney disease have progressive impairment of renal function and end stage renal disease (ESRD) patients must undergo renal replacement therapy (hemodialysis, peritoneal dialysis, and kidney transplantation). The prevalence of ESRD patients is increasing worldwide; this increases morbidity and mortality, including cardiovascular complications. Approximately 74% of the Korean ESRD patients manage daily life with the support of hemodialysis. Among patients with ESRD, the proportions of patients on dialysis for less than 1 year (D1), 1–5 years (D2), and above 5 years (D3) are 29%, 50%, and 21%, respectively [12]. Hemodialysis can remove a majority of waste products in a short time period. However, useful nutrients are also lost from the body with this process; uremia is accompanied by symptoms such as anorexia, nausea, and food absorption disorders [3].
Dietary management is essential for maintaining a dialytic stability stable dialysis. Such patients require sufficient calorie and protein intakes and adequate amounts of salt, sodium, potassium, phosphorus, and water [4]. Implementation of diet therapy improves survival rates in hemodialysis patients and leads to better dialysis adequacy, but can cause psychological stress in patients. In practice, many difficulties are associated with changing individual eating habits, such as the lack of family support, change in taste, and the lack of knowledge [56]. Nutritional status is also known to play an important role in long-term survival of hemodialysis patients [78].
In patients with end-stage renal disease, protein-energy malnutrition varies from 10% to 70%; in approximately 25% of hemodialysis patients, energy intake is less than 75% of the recommended dietary energy intake [910]. Hemodialysis patients are malnourished but are clinically characterized by mild symptoms and good nutritional status; clinical symptoms can only be detected after malnutrition becomes severe in the future [11]. Nutritional status is related to the quality of life of the individual, and therefore, quick and accurate identification of nutritional status in the patients is very important to implement appropriate nutritional management [12]. However, nutritional status of hemodialysis patients has rarely been studied in detail. In the present study, we investigated the nutritional status of hemodialysis patients in Korea. Even Kidney Disease Outcomes Quality Initiative 2008 has guidelines on nutrition counseling for patients who started dialysis but there is no management standard for dialysis duration. The effect of dialysis duration on nutrition status needs to be analyzed.
The purpose of this study was to investigate the differences in nutritional status and nutrient intake according to hemodialysis duration. With this study, we aimed to help improve nutrition education and counseling methods.
MATERIALS AND METHODS
Study subjects
This study was performed in patients on maintenance hemodialysis (3 times per week) who visited the artificial kidney unit of Soonchunhyang University Bucheon Hospital from March 2011 to September 2015. A total of 145 patients who agreed to the purpose and contents of the study were included. Patients were divided into 3 groups according to duration of hemodialysis: D1, 58 patients; D2, 45 patients; and D3, 42 patients. This study was a retrospective study on dietary survey and data did not the case of the mandatory approval period. So, approval of the Institutional Review Board committee in Soonchunhyang University Hospital was exempted.
Study variables
In general, subjects were examined for age, sex, and body mass index (BMI) calculated using anthropometry. Comorbidities were obtained by calculating the Charlson comorbidity index (CCI). The patients' nutritional status was assessed by a clinical dietitian using a subjective global assessment method. Nutritional determinations were divided into weight change, dietary intake change, gastrointestinal symptoms, functional impairment, comorbidities, and fat and muscle wasting part and scored in each part. A nutritional status was classified as well-nourished, moderate to mild protein-energy wasting (PEW) and severe PEW. In order to evaluate nutrient intake, 24-hour recall method was conducted and analyzed using the computer-aided nutritional analysis program (CAN-Pro 4.0; Korean Nutrition Society, Seoul, Korea). Adherence to diet management and education demand related to the patients' usual diet were investigated. The questions were based on previous research articles and were reviewed by the researchers [1314]. The questions were: ‘Have you ever received nutritional education or counseling?’, ‘Do you think that diet could play a role in maintaining stable dialysis?,’ ‘Are you controlling your diet now?,’ ‘Why do you control your diet?,’ ‘What is most difficult in diet management?,’ and ‘Do you want nutritional education and professional nutrition management?’
Statistics analysis
SPSS 18.0 programs (SPSS Inc., Chicago, IL, USA) was used for the statistical analysis to identify differences among the 3 groups, means and standard deviations were analyzed by 1-way analysis of variance and frequency was analyzed by χ2 test. All results were considered statistically significant at p < 0.05.
RESULTS
Baseline characteristics
Mean age of the subjects was 62.5 years. Distribution of BMI was significantly difference between groups.. Mean CCI was significantly higher in group D3 than in group D1. Nutritional deficiencies were detected in 31.1% of the patients in group D1, 48.9% of the patients in group D2, and 47.6% of the patients in group D3. The D3 group showed high rates of severe malnutrition, but these rates were not significantly different among the 3 groups (Table 1).
Table 1
Subjects' characteristics according to hemodialysis duration
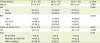
Data represented as mean ± standard deviation and number (%).
The p value by ANOVA test (continuous variables) or χ2 test (categorical variables).
D1, less 1 year; D2, 1–5 years; D3, above 5 years; BMI, body mass index; eGFR, estimated glomerular filtration rate; CCI, Charlson comorbidity index; SGA, subjective global assessment; PEW, protein-energy wasting; ANOVA, analysis of variance.
*There exists the significant difference between D1 and D3 groups.
![]()
Analysis of nutritional status
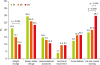
Factors associated with malnutrition were compared among the 3 groups and the overall score was calculated as a percentage of the nutritional assessment sub-section. The association between nutritional status and weight change, dietary intake change, and gastrointestinal symptoms were higher in the D1 group. In the D3 group, nutritional status was more strongly associated with functional impairment, comorbidities, and fat and muscle wasting. There were significant differences in weight change and fat and muscle wasting among groups (Figure 1).
Comparison of nutrient intakes
Table 2 shows the comparison of nutrient intakes among the 3 groups. Protein, iron, sodium, and vitamin C intakes were significantly different among the 3 groups. Protein, iron, and vitamin C intakes were significantly lower in the D3 group than in the D1 group. Sodium intake was significantly higher in the D3 group than in the D2 group. The energy intakes per body weight were 30.8 kcal in the D1 group, 29.2 kcal in the D2 group, and 27.4 kcal in the D3 group. Protein intake was the lowest in the D3 group (0.89 kcal) while protein intakes of D1 and D2 were 1.01 kcal and 1.09 kcal, respectively (Table 2).
Table 2
Nutrient intakes according to hemodialysis duration
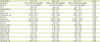
Data represented as mean ± standard deviation and number (%). The p value by ANOVA test (continuous variables) or χ2 test (categorical variables).
D1, less 1 year; D2, 1–5 years; D3, above 5 years; BW, body weight; RE, retinol equivalent; NE, niacin equivalent; ANOVA, analysis of variance.
*There exists a significant difference between groups D1 and D3; †There exists a significant difference between groups D2 and D3.
![]()
Difficulty in the dietary management
Table 3 shows the results of the subjects' normal dietary adjustment. More than 70% of subjects previously received nutrition education. The D3 group showed a significantly lower agreement to the role of diet in maintaining stable dialysis and lower rate of patients currently controlling their current diet compared to the other 2 groups. Regarding the question about the reason for controlled eating, the D1 and D2 groups showed the highest response rates for electrolyte control whereas the D3 group showed the highest response rate for blood glucose control; there were significant differences among the 3 groups. The most difficult dietary factor to control was restricting salt while cooking. The second most difficult factor for the D1 group was that everything had to be controlled, the D2 group found restricting foods high in potassium was difficult, and the D3 group perceived food preparation and the economic difficulties hindered diet management. The D3 group ranked the lowest in terms of demands for continuous nutrition education and management, but the differences were not significant (Table 3).
Table 3
Adherence of diet management and education demand according to hemodialysis duration
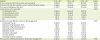
The results of 1), 2), and 3) number in the 3 groups are the percentages that answered “yes” to the question. Data are presented as number (%). The p value by χ2 test (categorical variables).
D1, less 1 year; D2, 1–5 years; D3, above 5 years.
![]()
DISCUSSION
The purpose of this study was to investigate dietary intakes and compliance with dietary management during dialysis to improve dietary management in hemodialysis patients. All study subjects had normal BMI. But underweight ratio in the D3 group was higher than that in other 2 groups. Malnutrition rate was not significantly different, but we found that malnutrition rates increased with increasing hemodialysis duration. This result was higher than the rate reported by Kwon et al. [15].
On analyzing factors associated with malnutrition, we found that changes in weight and dietary intakes were common in the D1 and D2 groups, but fat and muscle metabolism was common in the D3 group. There was no statistical significance but it is expected that there was a difference in the number of subjects, so continuous analysis is needed. It has been reported that worsening nutritional status is associated with a longer dialysis period, and the resulting malnutrition directly affects prognoses of dialysis patients, increases dialysis-associated prevalence and mortality rates, and lowers the quality of the life [16]. Therefore, the nutritional status of hemodialysis patients should be observed closely on a periodic basis. Prognostic factors for mortality in dialysis patients include nutritional status, age, adequacy of dialysis, and presence of co-morbidities; many dialysis patients also have chronic diseases such as hypertension or diabetes. The CCI is scored according to the age and the presence of accompanying diseases, such as cardiovascular, cerebrovascular, lung, and gastrointestinal diseases and diabetes mellitus [17]. In this study, comorbid diseases were more common in the D3 group than in the other 2 groups; therefore, prolonged hemodialysis required more medical treatment.
We analyzed nutrient intake status of the subjects. The energy requirement in dialysis patients is 30–35 kcal per ideal body weight, and protein requirement is 1.2 g per ideal body weight [18]. In all 3 groups, calorie and protein intakes were insufficient compared to the dietary intakes recommended for dialysis patients. Protein, iron, and vitamin C intakes were significantly lower in the D3 group than in the other 2 groups. In addition, calcium, vitamin A, vitamin B1, vitamin B6, niacin, vitamin C, and folic acid were consumed inadequately compared with the intake levels recommended by the dietary guidelines for Korean [19].
In all 3 groups, the rate of nutrition education was higher than 70%; however, the current dietary control rates decreased significantly with increasing dialysis duration. In addition, at the beginning of dialysis, patients complained of the difficulty in controlling low-salt diets or of the burden of eating control itself; however, the rates of oneself cooking and economic difficulties increased with increasing dialysis duration. At the beginning of dialysis, the emphasis is on salt and electrolyte control, and after 5 years, the diet control is loosened and the salt intake is increased. The intake of sodium in this study was higher than that reported by Kim et al. [5]. There were not many papers related to this study and it was difficult to compare the results.
The major causes of malnutrition in dialysis patients are low frequency of intake of 3 meals, inadequate nutrient intake, changes in taste, and limitations with respect to consuming many food items. Such prolonged treatment is known to cause burdens and psychological problems [20].
This study has limitations. Our findings did not reflect dietary adjustments according to accompanying complications, or dialysis adequacy. However, this study was performed on patients who were treated for various time periods; thus, it was meaningful to examine the causes for impaired nutritional status considering various aspects of dialysis treatment. Our results suggest that management methods for hemodialysis patients should be chosen according to hemodialysis duration and level of nutrition education, even though proper nutrition intervention is necessary during the treatment.
 XML Download