Abstract
Objectives
Methods
Results
Conclusions
Figures and Tables
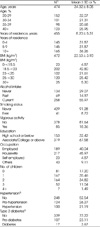
Table 1
Characteristics of the participants

Abbreviations: SD, standard deviations; BMI, body mass index
1) Number of participants did not sum to 474 for a few variables because some participants did not provide information on those variables.
2) Prehypertension was defined as 120<=SBP<140 or 80<=DBP<90 mmHg and hypertension was defined as SBP>= 140 or DBP>=90 mmHg or if participants reported to have hypertension or take medication.
3) Pre-diabetes was defined as 5.6%<= HbA1c <6.5% or 100<= glucose <126 mg/dL and diabetes was defined as HbA1c >=6.5% or glucose >=126 mg/dL or if participants reported to have diabetes or take medication.
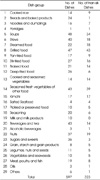
Table 2
Number of participants who consumed Korean, common or Filipino foods and number of food items consumed

1) The proportion of participants who consumed Korean, common or Filipino foods out of a total of 474 participants
2) The proportion of each food item consumed out of a total of 597 items from Korean, common, and Filipino foods consumed in this population. Food items that participants consumed more than once were counted once rather than multiple times.
Table 6
Characteristics according to ratio of Han-sik1)

Abbreviations: SD, standard deviations; BMI, body mass index
1) Ratio of Han-sik, the level of Han-sik intake was calculated by dividing the number of Korean foods consumed by the number of all foods consumed per day. Food items that participants consumed more than once per day were counted multiple times as it is, rather than once.
2) ANOVA or Kruskal-Wallis test was used for continuous variables and chi-square test was used for categorical variables.
3) Tukey post-hoc test was used. Each comparison for two categories showed a significant difference (p value<0.05)
4) Tukey post-hoc test was used. Each comparison for two categories showed a significant difference (p value<0.05) except Q3 vs. Q2 (p value=0.06) and Q4 vs. Q3 (p value=0.54)
5) A few participants had missing data.
Table 7
Characteristics according to ratio of Filipino foods1)

Abbreviations: SD, standard deviations; BMI, body mass index
1) Ratio of Filipino foods, the level of Filipino foods intake was by dividing the number of Filipino foods consumed by number of all foods consumed per day. Food items that participants consumed more than once per day were counted multiple times as it is, rather than once.
2) ANOVA or Kruskal-Wallis test was used for continuous variables and chi-square test was used for categorical variables.
3) Tukey post-hoc test was used. Each comparison for two categories showed a significant difference (p value<0.05).
4) Tukey post-hoc test was used. Each comparison for two categories showed a significant difference (p value<0.05).
5) Tukey post-hoc test was used. Comparison for mean or above vs. non-consumers showed a significant difference (p value<0.05) but the other two comparisons did not show a significant difference.
6) A few participants had missing data.
Table 8
Least-squares means (95% confidence intervals) of years of residence and years of living together with husband according to ratio of Han-sik

1) Median values in each quartile of ratio of Han-sik were 33.33%, 50.00%, 66.67%, and 81.82%, respectively.
2) The number of participants did not sum to 474 because a few participants did not provide information.
3) Model was adjusted for age (years, continuous), energy (kcal/d, continuous), education (high school or below, associate/college or above) and BMI (<18.5, 18.5–<23, 23–<25, ≥25 kg/m2)
Table 9
Odds ratios (95% confidence intervals) of socioeconomic status according to ratio of Han-sik

1) Median values in each quartile of ratio of Han-sik were 33.33%, 50.00%, 66.67%, and 81.82%, respectively.
2) In the logistic regression models, participants who graduated from associate/college or above were regarded as an event.
3) Model was adjusted for age (years, continuous), energy (kcal/d, continuous), BMI (<18.5, 18.5–<23, 23–<25, ≥25 kg/m2), and total annual family income (₩20,000,000 or below, above ₩20,000,000)
4) In the logistic regression models, participants whose total annual family income was ₩20,000,000 or below were regarded as an event.
5) Model was adjusted for age (years, continuous), energy (kcal/d, continuous), BMI (<18.5, 18.5–<23, 23–<25, ≥25 kg/m2), and education (high school or below, associate/college or above)
6) In the logistic regression models, participants who cohabitated with parents-in-law were regarded as an event.
7) In the logistic regression models, participants who had high linguistic competence were regarded as an event.


 PDF
PDF ePub
ePub Citation
 Print
Print


 XML Download