Journal List > J Nutr Health > v.51(5) > 1106773

Kwon, Lee, Kim, Park, Lim, Kim, and Kim: Effects of an educational program for improving the dietary quality of older adults at risk for dysphagia in South Korea∗

Abstract

Purpose

Changes in eating habits and malnutrition due to dysphagia are important health problems for older adults. This study investigated the effects of an educational program aimed at improving diet quality in community-dwelling older adults at risk for dysphagia in South Korea. Methods: We assessed 27 individuals in the experimental group and 26 individuals in the control group between September and October 2015. All participants were aged 65 years or older and were at risk for dysphagia. A combined diet and exercise program was applied to the experimental group (n=27) for six weeks. We examined changes in participants' eating habits and their knowledge and attitudes concerning dysphagia risk. The nutrition intake of all participants was measured before and after the intervention using 24-hr dietary recall. Results: There was a significant increase in knowledge of dysphagia risk in the experimental group, with scores increasing from 3.7 to 7.1, out of 10 points (p<0.001). There were also significant improvements in eating habits after the intervention in the experimental group, with scores increasing from 21.9 to 28.3, out of 36 points (p<0.001). The attitude score of participants in the experimental group increased significantly, from 15.2 to 16.7, out of 20 points (p=0.016). Conclusion: Developing educational programs can help older adults living in the community lead a healthier lifestyle and improve their ability to manage their diet.

References

1. Statistics Korea. Report of older adults statistics in 2017. Daejeon: Statistics Korea;2017.
2. Miura H, Kariyasu M, Yamasaki K, Arai Y. Evaluation of chewing and swallowing disorders among frail community-dwelling elderly individuals. J Oral Rehabil. 2007; 34(6):422–427.
crossref
3. Roy N, Stemple J, Merrill RM, Thomas L. Dysphagia in the elderly: preliminary evidence of prevalence, risk factors, and socioemotional effects. Ann Otol Rhinol Laryngol. 2007; 116(11):858–865.
crossref
4. Chen PH, Golub JS, Hapner ER, Johns MM 3rd. Prevalence of perceived dysphagia and quality-of-life impairment in a geriatric population. Dysphagia. 2009; 24(1):1–6.
5. Holland G, Jayasekeran V, Pendleton N, Horan M, Jones M, Hamdy S. Prevalence and symptom profiling of oropharyngeal dysphagia in a community dwelling of an elderly population: a self-reporting questionnaire survey. Dis Esophagus. 2011; 24(7):476–480.
crossref
6. Ministry of Health and Welfare, Korea Centers for Disease Control and Prevention. Korea Health Statistics 2012: Korea National Health and Nutrition Examination Survey (KNHANES V-3). Cheongju: Korea Centers for Disease Control and Prevention;2013.
7. Won YS, Kim JH, Kim SK. Relationship of subjective oral health status to subjective oral symptoms for the elderly in some Seoul area. J Dent Hyg Sci. 2009; 9(4):375–380.
8. Lee SM, Cho EP, Hwang YS, Kang BW. The change of oral function before and after practicing program for oral function improving. J Dent Hyg Sci. 2011; 11(6):497–503.
9. Yun OJ, Lee YH. The effect of singing intervention for women elderly with dysphagia risk. Korean J Adult Nurs. 2012; 24(4):380–389.
crossref
10. Bang HL, Park YH. The effect of an exercise-based swallowing training program for nursing home residents with stroke. J Muscle Joint Health. 2014; 21(2):85–96.
crossref
11. Fukada J, Kamakura Y, Manzai T, Kitaike T. Development of dysphagia risk screening system for elderly persons. Jpn J Dysphagia Rehabil. 2006; 10(1):31–42.
12. Choi YH. Relationship between number of residual teeth and masticatory function [dissertation]. Cheonnan: Dankook university;2008.
13. Kang JH, Park RY, Lee SJ, Kim JY, Yoon SR, Jung KI. The effect of bedside exercise program on stroke patients with dysphagia. Ann Rehabil Med. 2012; 36(4):512–520.
crossref
14. Turley R, Cohen S. Impact of voice and swallowing problems in the elderly. Otolaryngol Head Neck Surg. 2009; 140(1):33–36.
crossref
15. Cohen J. Statistical power analysis for the behavioral sciences. Cambridge (MA): Academic press;2013.
16. Kim YJ, Choi YH, Kim JY, Lee HK. The effect of orophysical exercise for the elderly on oral function and nutrient intake. J Korean Acad Oral Health. 2011; 35(4):414–422.
17. Sura L, Madhavan A, Carnaby G, Crary MA. Dysphagia in the elderly: management and nutritional considerations. Clin Interv Aging. 2012; 7:287–298.
18. Yang SO, Jeong G, Kim SJ, Kim K, Lee SH, Saung S, Baik S. The effects of oral function improving exercise on the UWS, oral function and OHIP in elderly. J Korean Public Health Nurs. 2012; 26(3):478–490.
crossref
19. Ministry of Health and Welfare. Demonstration project of hub-health centers' health promotion programs for elderly people. Seoul: Ministry of Health and Welfare;2007.

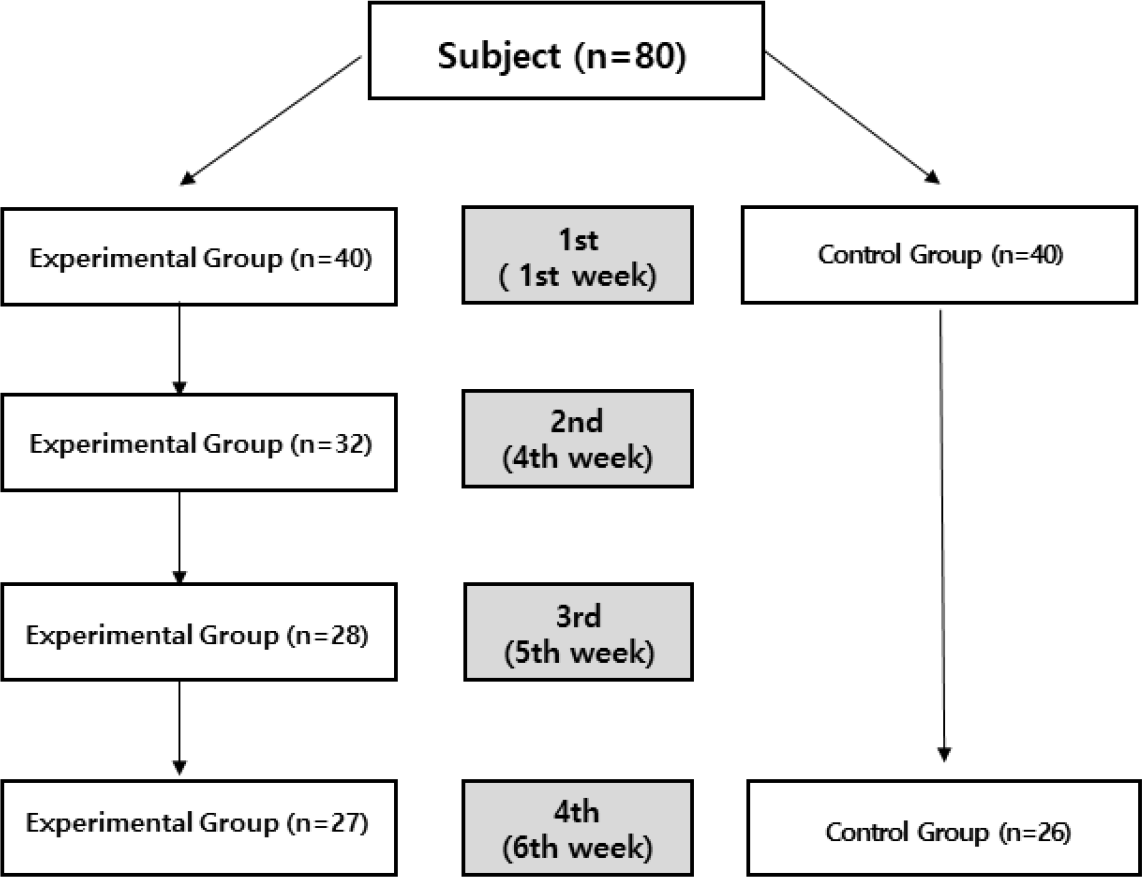
Fig. 1.
Number of participants in the educational program
jnh-51-445f1.tif
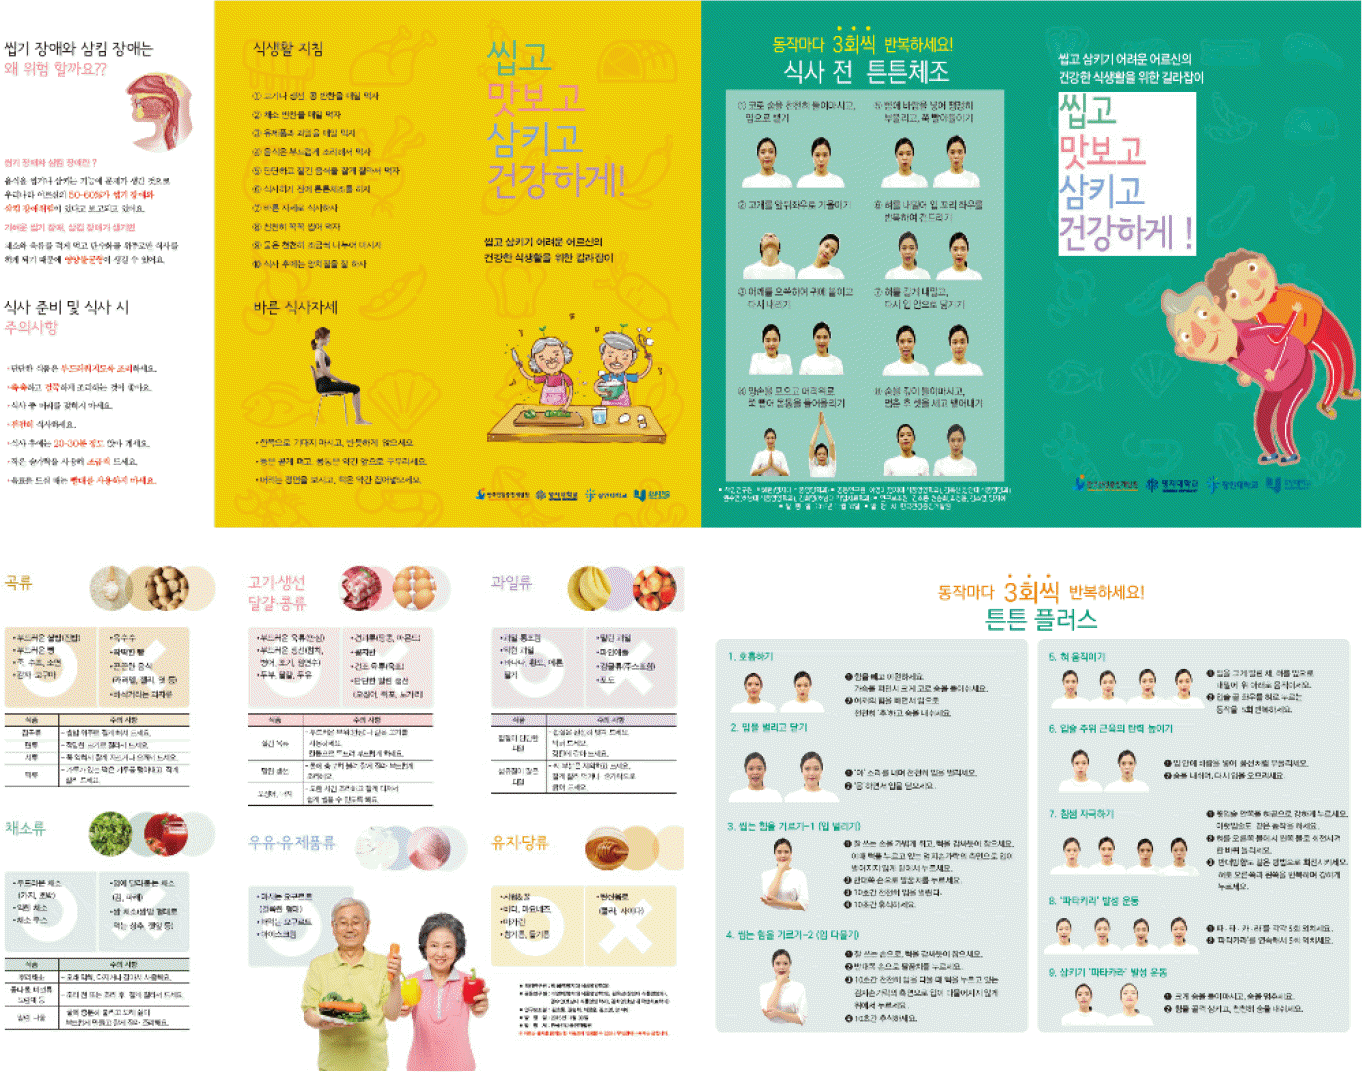
Fig. 2.
Contents of the educational program for improving the dietary quality: Dietary guide and exercise guide
jnh-51-445f2.tif
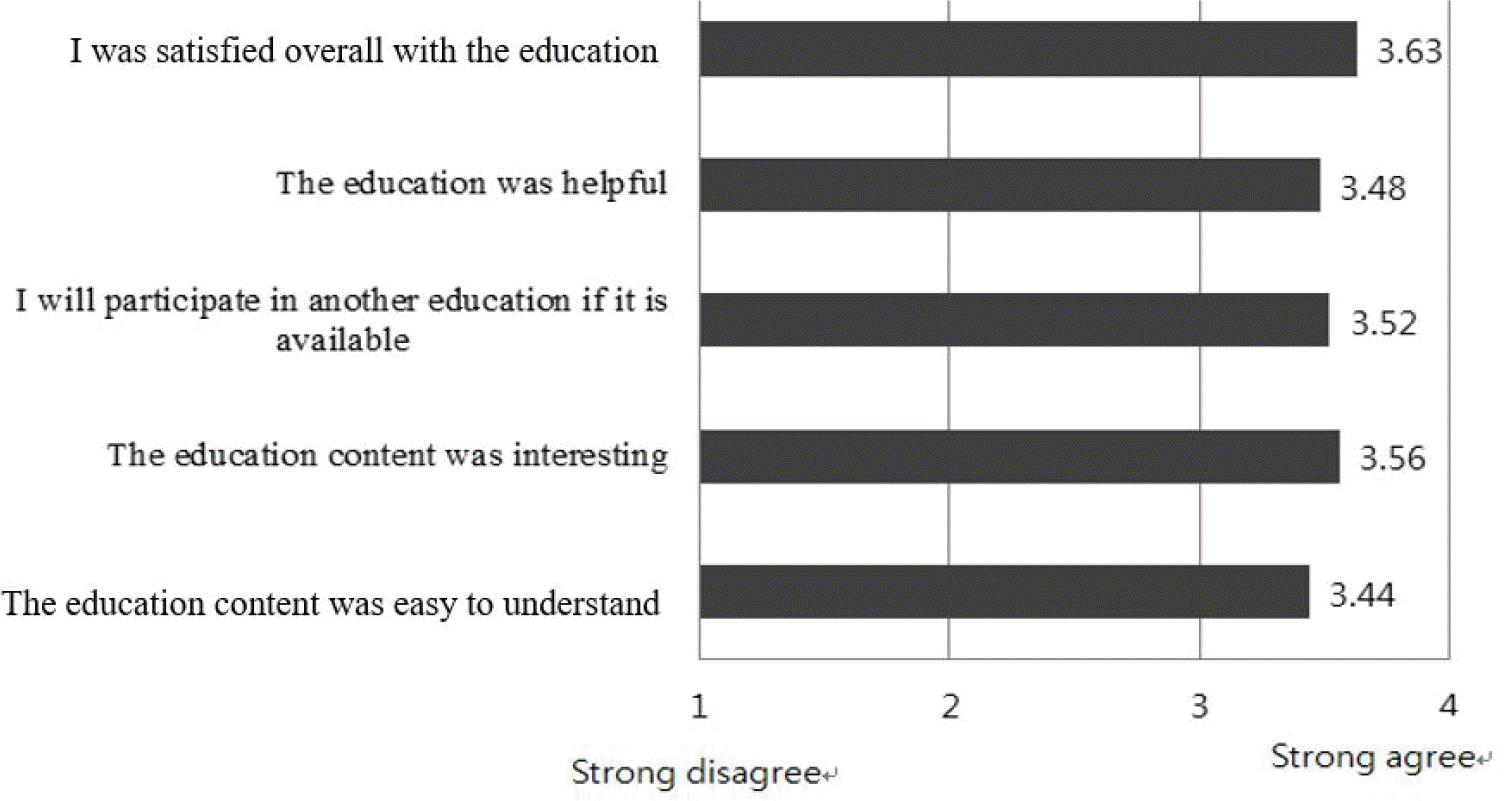
Fig. 3.
Satisfaction of participants with the educational program (n = 27)
jnh-51-445f3.tif
Table 1.
Schedule of the educational program for improving the dietary quality
Time Main contents Details
1st (1st week) • Test operation outlines • Test operation and total contents explanation
• Exercise guide • Right posture at a meal
  • ‘Health Stretching' and ‘Health Plus Stretching'
2nd (4th week) • The review of ‘Health Stretching' • ‘Health Stretching' and ‘Health Plus Stretching'
• Dietary life guide • Dietary life guide
– Food guide • How to drink water and beverage safely
– Cooking guide • How to eat bread and rice cake
3rd (5th week) • The review of ‘Health Stretching' • ‘Health Stretching' and ‘Health Plus Stretching'
• Dietary life guide • How to cook grains
– Cooking guide • How to cook meat/fish/egg/beans
– Menus guide • How to cook vegetables
4th (6th week) • Dietary life guide • ‘Health Stretching' and ‘Health Plus Stretching'
• Overall review • How to cook fruits
• How to cook milk and dairy products

• Standard menus for the aged who have the difficulty of chewing and swallowing

Table 2.
General character of the respondents before program (n (%) or mean ± SD)
Character Experimental group (n = 27) Control group (n = 26) t-value1)
Gender      
Men 11 (40.7) 14 (53.8) 0.913
Women 16 (59.3) 12 (46.2)
Age
65 ∼ 74 5 (18.5) 14 (53.8) 7.188∗∗
≥ 75 22 (81.5) 12 (46.2)
Average 78.5 ± 4.5 75.0 ± 5.6 21.274∗
Perceived health status
Very bad 1 (3.7) 3 (11.5) 16.695∗∗
Bad 12 (44.4) 1 (3.8)
Fair 10 (37.0) 10 (38.5)
Good 3 (11.1) 12 (46.2)
Very good 1 (3.7) 0 (0.0)
Average 2.7 ± 0.9 3.2 ± 1.0 –2.059∗
Height (m) 1.6 ± 0.1 1.6 ± 0.1 –2.145∗
Weight (kg) 58.5 ± 11.8 63.2 ± 10.2 –1.536
BMI (kg/m²)
Underweight (< 18.5) 2 (7.4) 0 (0.0) 5.151
Normal (18.5 ∼ 22.9) 14 (51.9) 12 (46.2)
Overweight (23 ∼ 24.9) 6 (22.2) 5 (19.2)
Obese I (25 ∼ 29.9) 4 (14.8) 9 (34.6)
Obese II (30 ∼ 39.9) 1 (3.7) 0 (0.0)
Average 23.2 ± 3.4 23.8 ± 2.9 –0.693
1) by χ2-test or Student's t-test

p < 0.05, ∗∗ p < 0.01

Table 3.
The knowledge1) change between before and after the educational program1) (n (%) or mean ± SD)
Items Experimental group Control group
  (n = 27)     (n = 26)  
Before After p3) Before After p3)
You can prevent choking if you slightly bend your heads 11 (40.7) 25 (92.6) 0.001∗∗ 6 (23.1) 7 (26.9) 1.000
while eating            
It is helpful to lie down for 30 minutes when you get choked while eating 6 (22.2) 20 (74.1) 0.001∗∗ 13 (50.0) 11 (42.3) 0.774
It is better to eat cooked rice in water or soup when you 1 (3.7) 12 (44.4) 0.003∗∗ 2 (7.7) 1 (3.8) 1.000
are having difficulties with swallowing            
It is better to abstain from meat if you are having 11 (40.7) 16 (59.3) 0.267 14 (53.8) 8 (30.8) 0.109
difficulties with chewing and swallowing            
Drinking water while eating is helpful to prevent choking 7 (25.9) 18 (66.7) 0.003∗∗ 6 (23.1) 8 (30.8) 0.754
Difficulty in chewing and swallowing can lead to deficiency 9 (33.3) 19 (70.4) 0.013∗ 7 (26.9) 10 (38.5) 0.453
of vitamin intake            
It is better to eat hard-boiled rice rather than soft-boiled 16 (59.3) 17 (63.0) 1.000 22 (84.6) 22 (84.6) 1.000
rice if you are having difficulties with chewing and swallowing
It is better to eat clear soup rather than thick soup if you 15 (55.6) 20 (74.1) 0.227 7 (26.9) 5 (19.2) 0.687
are having difficulties with chewing and swallowing.            
When eating hard vegetables like carrots, you'd better eat 20 (74.1) 26 (96.3) 0.070 23 (88.5) 24 (92.3) 1.000
them after cooking            
It is better to drink yogurt and eat it with a spoon if you are having difficulties with swallowing 5 (18.5) 19 (70.4) 0.001∗∗ 5 (19.2) 6 (23.1) 1.000
Total (10 points)2) 3.7 ± 2.0 7.1 ± 1.8 < 0.001∗∗∗ 4.0 ± 1.5 3.9 ± 1.4 0.729

1) Percentage of respondents who correctly answered questions of nutrition knowledge 2) 0 point = incorrect or I do not know, 1 poin = correct 3) p-value by McNemar test and paired t-tests ∗ p < 0.05, ∗∗ p < 0.01, ∗∗∗ p < 0.001

Table 4.
The change of eating habits related to chewing and swallowing between before and after the educational program1) (mean ± SD)
Items Experimental group Control group
  (n = 27)     (n = 26)  
Before After t-value2) Before After t-value2)
I ate vegetables every day 2.33 ± 0.92 2.70 ± 0.54 –2.431∗ 2.85 ± 0.46 2.81 ± 0.57 0.254
I ate fruits every day 2.04 ± 1.06 2.37 ± 0.84 –2.082∗ 2.00 ± 0.98 2.08 ± 1.06 –0.570
I ate meat, fish, beans and so on as side dishes 1.59 ± 0.84 1.85 ± 0.82 –1.192 2.08 ± 0.85 2.15 ± 0.88 –0.337
every day            
I ate dairy products like milk or yogurt every day 1.37 ± 1.08 1.52 ± 1.12 –0.700 1.85 ± 1.19 1.62 ± 1.30 1.140
I ate three meals a day regularly 2.63 ± 0.79 2.89 ± 0.42 –1.568 2.27 ± 1.04 2.42 ± 0.99 –1.280
I had a balanced diet 1.89 ± 1.22 2.67 ± 0.68 –3.083∗∗ 1.96 ± 1.04 1.88 ± 1.14 0.420
I did warm-ups (mouth and tongue exercises) 0.30 ± 0.78 2.19 ± 1.21 –7.174∗∗∗ 0.54 ± 1.03 0.50 ± 1.11 0.328
before having a meal            
I had my meal with a correct posture 1.78 ± 1.25 2.37 ± 0.97 –2.126∗ 2.62 ± 0.75 2.27 ± 1.04 1.671
I ate slowly, chewing my food well 1.63 ± 1.25 2.48 ± 0.98 –3.426∗∗ 2.08 ± 1.16 1.92 ± 1.32 0.610
I was seated for about 30 minutes after meals 1.93 ± 1.21 2.19 ± 1.04 –0.908 1.54 ± 1.27 1.73 ± 1.22 –0.655
I cooked the hard and tough food until it was 1.56 ± 1.16 2.41 ± 0.84 –3.349∗∗ 1.31 ± 1.32 1.81 ± 1.33 –1.612
soft            
I brushed my teeth after meals 2.81 ± 0.48 2.70 ± 0.61 0.901 2.46 ± 0.95 2.23 ± 1.14 1.063
Total (36 points) 21.85 ± 5.75 28.33 ± 5.22 –5.530∗∗∗ 23.54 ± 4.84 23.42 ± 5.03 0.127
1) 0 = never, 1 = sometimes (2 ∼ 3 times per week ), 2 = usually (3 ∼ 5 times per week), 3 = a always (6 ∼ 7 time es per week) 2 2) by paired
t-test

p < 0.05, ∗∗ p < 0.01, ∗∗∗ p < 0.001

Table 5.
The change of the attitude related to chewing and swallowing between before and after the educational program1) (mean ± SD)
Items Experimental group Control group
  (n = 27)     (n = 26)  
Before After t-value2) Before After t-value2)
I will try not to eat food difficult to chew and 3.15 ± 0.60 3.15 ± 0.86 0.000 3.04 ± 0.77 2.96 ± 0.66 0.527
swallow            
I will try to increase my ability to chew and 3.30 ± 0.61 3.52 ± 0.75 –1.803 3.15 ± 0.68 3.04 ± 0.66 1.000
swallow            
I will seek expert advice when I have a problem with chewing and swallowing 2.89 ± 0.80 3.41 ± 0.80 –2.762∗ 2.73 ± 0.92 2.73 ± 0.67 0.000
I will change the cooking method when I have a problem with chewing and swallowing 3.15 ± 0.66 3.44 ± 0.70 –1.986 2.85 ± 0.73 2.85 ± 0.78 0.000
To chew and swallow better, I will exercise 2.70 ± 0.87 3.22 ± 0.80 –2.762∗ 2.50 ± 0.91 2.38 ± 0.85 0.570
before I eat a meal            
Total (20 points) 15.19 ± 2.70 16.74 ± 2.74 3.678∗ 14.27 ± 3.23 13.96 ± 2.63 0.617

1) 1 = strongly disagree, 2 = disagree, 3 = agree, 4 = strongly agree 2) by paired t-test ∗ p < 0.05

Table 6.
The change of dietary consumption between before and after educational program1) (mean ± SD)
Nutrients Experimental group Control group
  (n = 27)     (n = 26)  
Before After t-value2) Before After t-value2)
Energy (kcal) 1,347.76 ± 550.90 1,227.00 ± 511.61 0.960 1,513.67 ± 635.39 1,644.80 ± 522.99 –1.104
Protein (g) 53.73 ± 28.33 44.24 ± 17.29 1.820 62.54 ± 31.45 64.19 ± 26.10 –0.295
Fat (g) 22.50 ± 18.99 22.10 ± 18.29 0.099 34.76 ± 28.64 31.44 ± 14.73 0.593
Carbohydrate (g) 232.26 ± 102.58 220.51 ± 94.11 0.517 233.64 ± 69.62 277.94 ± 81.37 –2.659∗
Calcium (mg) 388.86 ± 233.82 350.13 ± 179.26 0.803 575.00 ± 391.49 505.52 ± 297.03 0.759
Iron (mg) 13.37 ± 7.28 14.36 ± 7.41 –0.530 14.74 ± 6.91 16.87 ± 7.53 0.759
Sodium (mg) 3,268.75 ± 2,056.21 2,532.86 ± 1,108.29 1.640 4,121.39 ± 1,844.19 3,779.48 ± 1,984.22 0.988
Potassium (mg) 2,201.01 ± 1,237.25 2,308.15 ± 958.38 –0.438 2,665.66 ± 1,064.47 3,068.94 ± 1,279.80 –1.679
Vitamin A (μgRE) 638.30 ± 572.15 969.33 ± 808.34 –1.973 672.78 ± 568.67 989.59 ± 556.71 –2.006
Thiamine (mg) 0.94 ± 0.49 0.94 ± 0.69 0.011 1.06 ± 0.40 0.99 ± 0.39 0.696
Riboflavin (mg) 0.86 ± 0.62 0.90 ± 0.61 –0.280 1.07 ± 0.46 1.15 ± 0.47 –0.712
Niacin (mg) 12.66 ± 8.26 10.02 ± 5.55 1.426 13.21 ± 6.44 13.03 ± 5.52 0.130
Vitamin C (mg) 68.65 ± 49.60 71.59 ± 37.81 –0.272 76.77 ± 45.44 122.91 ± 68.40 –2.720

1) by paired t-test ∗ p < 0.05

TOOLS
Similar articles