

 PDF
PDF ePub
ePub Citation
 Print
Print


 , Jinhee Kim2, Seunghee Kye1
Abstract
Purpose
Methods
Results
Figures and Tables
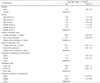
Table 1
Socio-demographic characteristics by sugar-sweetened beverages intake among Korean adolescents participating in the KYRBS, 20171)
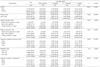
1) KYRBS, Korea Youth Risk Behavior Web-based Survey 2) Total sugar-sweetened beverages (SSB) include soda, energy drinks, sweetened tea, fruit-flavored drinks, coffee drinks, sports drink and determined by question during the past 7 days. 3) Differences across categories for each variables were examined Rao-Scott chi-square test.
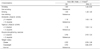
Table 2
Health behaviors by sugar-sweetened beverages intake among Korean adolescents participating in the KYRBS, 20171)
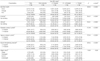
1) KYRBS, Korea Youth Risk Behavior Web-based Survey 2) Total sugar-sweetened beverages (SSB) include soda, energy drinks, sweetened tea, fruit-flavored drinks, coffee drinks, sports drink and determined by question during the past 7 days. 3) Differences across categories for each variable were examined Rao-Scott chi-square test. 4) Smoked at least once in the past 30 days. 5) Drank at least 1 shot of alcohol on one or more days in the past 30 days. 6) Performed physical activities that caused the heart rate to increase or the subject to be short-winded for at least 60 min a day during the past 7 days. 7) Performed strenuous physical activities that caused the subject to be completely short-winded or the body to sweat for at least 20 min a day during the past 7 days. 8) Performed muscle-strengthening exercise then exercise during the past 7 days. 9) Weight status was defined as follows; Obese: ≥ 95th percentile, Overweight: 85 ~ 94th percentile, Normal: 5 ~ 84th percentile, Underweight: < 5th percentile, based on reference data.
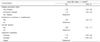
Table 3
Psychological variables by sugar-sweetened beverages intake among Korean adolescents participating in the KYRBS, 20171)
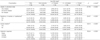
1) KYRBS, Korea Youth Risk Behavior Web-based Survey 2) Total sugar-sweetened beverages (SSB) include soda, energy drinks, sweetened tea, fruit-flavored drinks, coffee drinks, sports drink and determined by question during the past 7 days. 3) Differences across categories for each variables were examined Rao-Scott chi-square test. 4) Experienced sadness or hopelessness that interfered with daily living, which persisted for 2 weeks straight during the past 12 months 5) Had serious thoughts of suicide in the past 12 months.
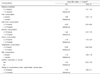
Table 4
Dietary habits by sugar-sweetened beverages intake among Korean adolescents participating in the KYRBS, 20171)
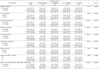
1) KYRBS, Korea Youth Risk Behavior Web-based Survey 2) Total sugar-sweetened beverages (SSB) include soda, energy drinks, sweetened tea, fruit-flavored drinks, coffee drinks, sports drink and determined by question during the past 7 days. 3) Differences across categories for each variables were examined Rao-Scott chi-square test.
Table 5
Logistic regression analysis of socio-demographic charactristrics associated with sugar-sweetened beverages intake among Korean adolescents participating in the KYRBS, 20171)
1) KYRBS, Korea Youth Risk Behavior Web-based Survey 2) Total sugar-sweetened beverages (SSB) include soda, energy drinks, sweetened tea, fruit-flavored drinks, coffee drinks, sports drink and determined by question during the past 7 days.
Adjusted for weight status.
For logistic regression analyses, total SSB intake was dichotomized into < 1 time/d vs. ≥ 1 times/d.
Table 6
Logistic regression analysis of health behavioral characteristics associated with sugar-sweetened beverages intake among Korean adolescents participating in the KYRBS, 20171)
1) KYRBS, Korea Youth Risk Behavior Web-based Survey 2) Total sugar-sweetened beverages (SSB) include soda, energy drinks, sweetened tea, fruit-flavored drinks, coffee drinks, sports drink and determined by question during the past 7 days.
Adjusted for gender, age, parents education level, household economic status, residential area.
For logistic regression analyses, total SSB intake was dichotomized into < 1 time/d vs. ≥ 1 times/d.
Table 7
Logistic regression analysis of psychological characteristics associated with sugar-sweetened beverages intake among Korean adolescents participating in the KYRBS, 20171)
1) KYRBS, Korea Youth Risk Behavior Web-based Survey 2) Total sugar-sweetened beverages (SSB) includes soda, energy drinks, sweetened tea, fruit-flavored drinks, coffee drinks, sports drink and determined by question during the past 7 days.
Adjusted for gender, age, parents education level, household economic status, residential area, weight status.
For logistic regression analyses, total SSB intake was dichotomized into < 1 time/d vs. ≥ 1 times/d.
Table 8
Logistic regression analysis of dietary habits associated with sugar-sweetened beverages intake among Korean adolescents participating in the KYRBS, 20171)
1) KYRBS, Korea Youth Risk Behavior Web-based Survey 2) Total SSB includes soda, energy drinks, sweetened tea, fruit-flavored drinks, coffee drinks, sports drink and determined by question during the past 7 days.
Adjusted for gender, age, parents education level, household economic status, residential area, weight status.
For logistic regression analyses, total SSB intake was dichotomized into < 1 time/d vs. ≥ 1 times/d.
 XML Download