Journal List > Nutr Res Pract > v.12(5) > 1101736

Park, Jung, Kim, and Lee: High dairy products intake reduces osteoporosis risk in Korean postmenopausal women: A 4 year follow-up study

Abstract

BACKGROUND/OBJECTIVES

The aim of this study was to identify the effect of dairy products, milk and yogurt on osteoporosis incidence among Korean postmenopausal women using prospective cohort data.

MATERIALS/METHODS

Between 2001 and 2003, 10,038 participants were recruited in rural and urban areas for a baseline examination of a community-based cohort study. Of those, 1,573 postmenopausal women (aged 40–69 years at baseline) were eligible for the present study. Intakes of dairy products, milk, and yogurt were assessed using a validated semi-quantitative food frequency questionnaire. The speed of sound at the radius and tibia were measured using a quantitative ultrasound device and osteoporosis was defined based on the WHO criteria (T-score ≤ −2.5).

RESULTS

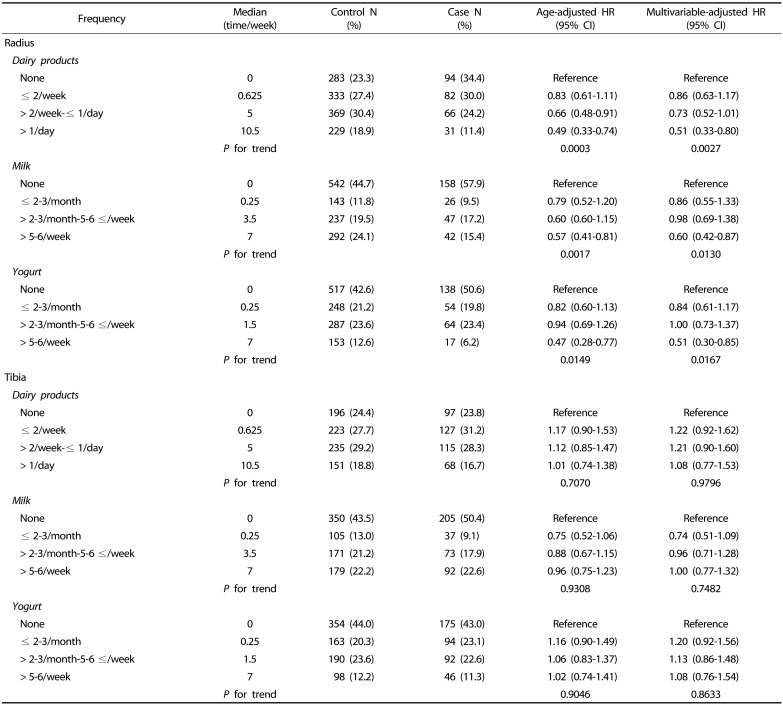
During the 4-years follow-up study, the cumulative incidence of osteoporosis was 18.4% (273 cases) in the radius and 33.6% (407 cases) in the tibia. The subjects with higher frequency of dairy product consumption showed a decreased risk of radius osteoporosis after adjusting for potential confounders [hazard ratio (HR) = 0.51, 95% confidence interval (CI): 0.33–0.80 for >1 time/day vs. non consumer; P for trend = 0.0027]. Similarly, high frequency of milk and yogurt consumption had a protective effect on radius osteoporosis risk [milk: HR = 0.60, 95% CI: 0.42–0.87 for > 5–6 times/week vs. non consumer (P for trend = 0.0130), yogurt: HR = 0.51, 95% CI: 0.30–0.85 for > 5–6 times/week vs. non consumer (P for trend = 0.0167)]. However, high dairy products consumption was not related with tibia osteoporosis.

CONCLUSIONS

This study suggests that daily intake of dairy products could potentially reduce radius osteoporosis incidence among Korean postmenopausal women.

INTRODUCTION

Osteoporosis is an important concern for clinical and public health because it increases bone fragility and the consequent risk of fracture [1]. Due to the change in population demographics, estimates anticipated a double number of individuals with osteoporosis in the next 20 years [2]. In the aspect of bone mineral density (BMD), milk and dairy products which are a good source of both protein and calcium, are known to have plenty of benefits [3]. However, there is controversy over the protective effect of dairy products on osteoporotic fractures. A pooling study reported that the intake of 300 mg/day calcium (the equivalent of one glass of milk) decreased hip fracture risk in postmenopausal women [4]. A meta-analysis revealed that low milk intake was not associated with increased risk of osteoporotic fracture or of hip fracture [5]. On the other hand, a Swedish cohort study reported that consumption of three or more glasses of milk per day increased hip fracture risk in middle aged and elderly women [6]. Population-based studies reported that high consumption of dairy products reduced osteoporosis risk among postmenopausal women [78]. The Western diet is rich in dairy products such as cheese and yogurt. The average intake of calcium for Swedish cohort subjects who drank less than one glass of milk was 1,000 mg. Therefore, it is difficult to directly compare this result with studies conducted in Asian countries which consume relatively fewer milk and dairy products.
Korean meals mainly include rice, vegetables, fermented foods, and very few dairy products. The calcium and dairy product intake among 50–64 year old women was 479.6 mg and 23.20 g, respectively, and it was only 60.0% of the recommended dietary allowance of calcium (800 mg/day) [9]. Also, the prevalence of osteoporosis among Korean women aged 50 years and older was higher than those of American women of comparable age (34.9% in Korea vs. 15.4% in the USA) [1011]. Therefore, it is necessary to examine the association of dairy product intake with osteoporosis in countries that consume low milk and dairy products such as in Asian countries.
To the best of our knowledge, only a few cross-sectional studies were conducted to explore the association between dairy products consumption and osteoporosis in Korean postmenopausal women [12,13141516]. Nevertheless, these cross-sectional studies have the limitation of proving the causal relationship between dairy products and osteoporosis. Therefore, the purpose of this study was to examine the relationship between dairy product consumption and osteoporosis in Korean postmenopausal women using prospective cohort data.

SUBJECTS AND METHODS

Participants and study design

The participants were selected from a community-based cohort of the Korean Genome and Epidemiology Study. The study design has been described in detail previously [17]. In brief, the cohort initially included 10,038 participants aged 40–69 years. Baseline examinations were performed between 2001 and 2003, and follow-up examinations are conducted biennially. The total follow up rates of participants were 85.7% and 74.9% respectively, at the 2 and 4-year follow-up examinations. Participants included residents of a rural area (Ansung) and an industrialized area (Ansan). Of the 10,038 baseline participants, 2,317 postmenopausal women completed the food frequency questionnaire at the baseline survey. The speed of sound (SOS, m/s) at their radius or tibia had been measured at the baseline survey, primarily follow up survey (2-years) or secondary follow-up survey (4-years). A total of 744 participants were excluded for following reasons: no dietary data (n = 93); those who reported daily energy intake was lower or higher than 2 standard deviations (SD) (< 419.2 kcal; n = 5 or > 3,341.1 kcal; n = 111) [18]; early menopause before 40 years of age (n = 194); bilateral ovariectomy (n = 25); on thyroid drug use (n = 93); on hormone therapy (n = 26); or on insulin therapy (n = 23); osteoporosis subjects at both sites at baseline survey (n = 103), no quantitative ultrasound (QUS) data at baseline (n = 52), or no follow up data (n = 19). Finally, we used the data of 1,573 subjects for the analysis (1,487 subjects had normal values for the radius, whereas 1,212 subjects had normal values for the tibia. Among them, 1,126 subjects had normal values at both sites). Informed consent was obtained from all study participants. The data was provided with bioresources from the National Biobank of Korea, the Centers for Disease Control and Prevention, Republic of Korea (4845-301, 4851-302 and -307). The study protocol was approved by the Eulji University institutional review board (EUIRB2015-33).

Dietary intake assessment

Dietary intake was assessed by the use of a validated 103 food-item, semi-quantitative food frequency questionnaire (SQFFQ) which administered at the baseline survey. The procedure used to design the SQFFQ is described in detail elsewhere [19]. The frequency of servings was classified into nine categories (never or seldom, once a month, 2–3 times a month, 1–2 times a week, 3–4 times a week, 5–6 times a week, once a day, twice a day, and three times or more a day). The portion size of each food item was classified into three categories (small, medium, and large). This SQFFQ has been validated using 12-day diet record data in the Korean population. The correlation of two methods ranged between 0.23 (vitamin A) and 0.64 (carbohydrate). The median for all nutrients was 0.39 [20]. Nutrient intakes were calculated for each participant using the food composition tables of the Korean Nutrition Society [21]. This FFQ contains dairy foods as follows: milk, yogurt, cheese, and ice cream. Dairy product intake was calculated as the combined intake of milk and yogurt.

Health examination and bone mineral contents measurements

Height and weight were measured by trained staff using a scale and a wall-mounted extensometer to the nearest 0.1 cm and 0.1 kg, respectively. Body mass index (BMI) was calculated as the weight in kilograms (kg)/squared of height in meters (m2). Sound velocity, usually expressed in meters per second and termed SOS, was measured using the QUS at the distal radius and the mid-tibia (Omnisense 7000s, Sunlight Medical Ltd. Israel). The measurement sites were the distal radius and the mid-tibia of the non-dominant arm and leg, respectively. The measurement was performed three times, and their average was taken as the final value as described previously [2223]. QUS provides the T-score value of each measurement site [24]. Hans et al. [25] reported that the optimal discrimination threshold of T-score was −2.5 when using Omnisense. Therefore, we defined osteoporosis as T-score ≤ −2.5 following the World Health Organization criteria [26]. The osteoporosis incidence defined individuals who were not diagnosed with osteoporosis at the baseline but subsequently became osteoporotic in the follow-up study.

Covariates

General characteristics, socioeconomic status, and lifestyle data were collected by an interviewer-administered questionnaire. Data regarding baseline age, age at menopause and residential area [Ansung (rural) or Ansan (urban)] were collected. Educational level was categorized as graduate elementary school, middle school, high school, or college or higher degree. Income status data were collected as amount per month and categorized as < $500, $ 500–$1,500 and ≥ $ 1,500. As for health behavior, smoking was categorized as non/ex-smoker or current smoker due to the small number of ex-smoker. Drinking information was collected then categorized as non/ex-drinker or current drinker due to the small number of ex-drinker. Exercise was categorized as yes or no.

Statistical analysis

Descriptive statistics such as mean values and standard error were used to summarize continuous variables, and frequencies were expressed as percentages. Categorical variables were tested by the Chi-square test and continuous variables were tested by the t-test. Hazard ratios (HRs) and 95% confidence intervals (CIs) for osteoporosis incidence risk associated with frequencies of dairy products, milk, and yogurt were estimated using the Cox proportional hazards regression model. The study was initiated in June 2001, and the participants were followed-up until November 2006. The entry time was the data at recruitment and the exit time was defined as the date at osteoporosis diagnosis or date of attended first or second follow-up survey. Person-years were calculated from the date of baseline examination to the date of an event or loss to follow up. The multivariate models adjusted for age, BMI, residual area, education level, income status, smoking, drinking, physicals activity, and total energy intake. To assess whether there was any linear association between milk, yogurt or dairy product intake and osteoporosis, tests for linear trend were performed by treating the median value of each exposure intake category as a continuous variable. The mean differences in SOS values in the radius and tibia according to the intake frequencies of dairy products, milk and yogurt were analyzed using analysis of covariance (ANCOVA). Age-adjusted values of baseline and 2nd follow up SOS and age and baseline SOS adjusted % change were used for ANCOVA. Statistical significance was accepted at P < 0.05 in the two-tailed test. All analyses were performed using SAS 9.4 (SAS Institute Inc., Cary, NC, USA).

RESULTS

General characteristics

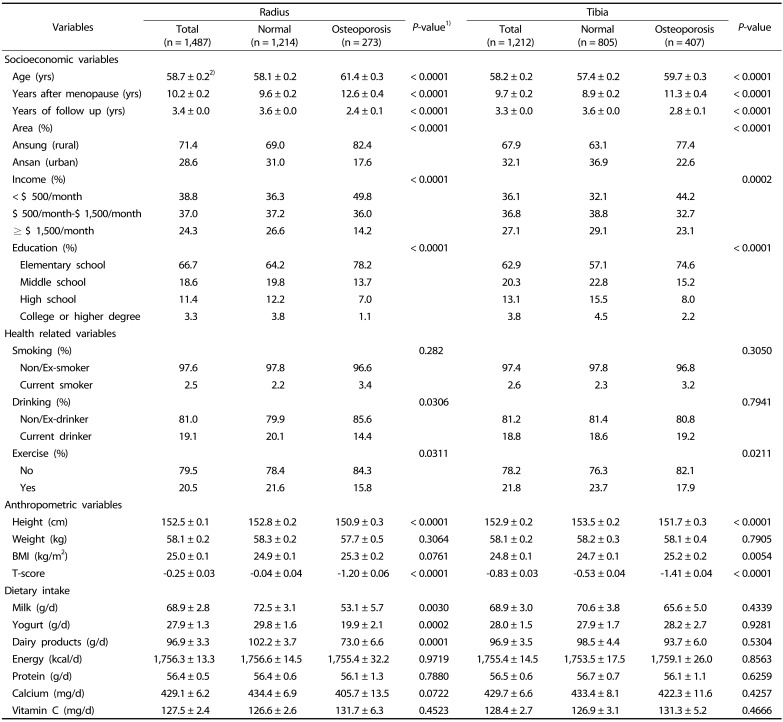
During the 4-year of follow-up, we had identified 273 newly diagnosed osteoporosis cases (54/1,000 person-years) in the radius and 407 (101/1,000 person-years) in the tibia. The median follow up years was 3.4 years (range 1.5–4.5 years) of radius incidence and 3.3 years (range 1.4–4.3 years) of tibia incidence. The general characteristics of the study population according to radius and tibia osteoporosis status are presented in Table 1. Women in the osteoporosis group were more likely to be older than those in the normal group. The osteoporosis group was more likely to have higher BMI, less education, lower household income, and lived more in a rural area. Health-related variables such as smoking and physical activity did not differ between the two groups. The radius osteoporosis group had a significantly lower intake of milk, yogurt, and dairy products than the normal group.

Risk of osteoporosis by dairy products, milk, and yogurt

Table 2 shows the age-adjusted and multivariate-adjusted HR of having osteoporosis of the radius and tibia according to the frequency of dairy products, milk, and yogurt. We found that frequent consumption of dairy products was associated with a lower incidence of radius osteoporosis (HR = 0.51, 95% CI: 0.33–0.80 for 1 time/day vs. non-consumer; P for trend = 0.0027). Similarly, frequent consumption of milk and yogurt reduced the risk of radius osteoporosis (milk: HR = 0.60, 95% CI: 0.42–0.87 for >5–6 times/week vs. non-consumer; P for trend = 0.0130, yogurt: HR = 0.51, 95% CI = 0.30–0.85 for >5–6 times/week vs. non-consumer; P for trend = 0.0167). However, the consumption of dairy products, milk, and yogurt showed no reduction in osteoporosis risk in the tibia.

SOS values and % change of SOS values

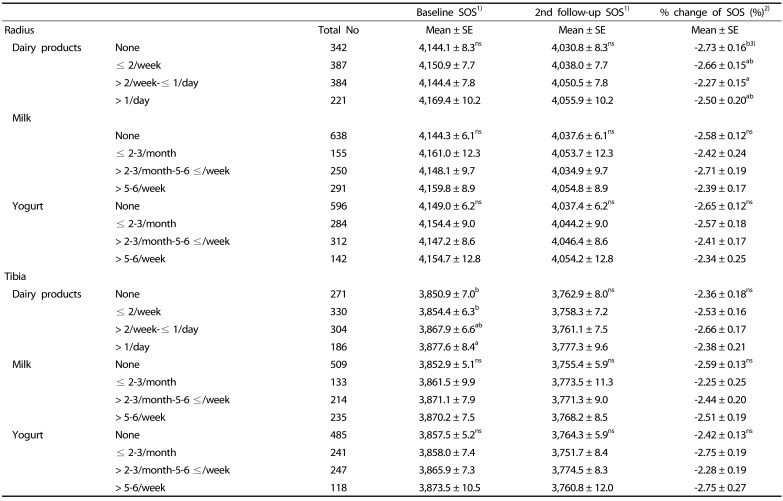
The SOS values and the % change in SOS values according to dairy products, milk, and yogurt intake frequencies are reported in Table 3. The SOS value in the second follow up, and % change in SOS did not show any differences according to dairy product intake frequency. However, subjects in the highest frequency (>1 / day) of the dairy product group had a higher tibia SOS value than those in the other groups (3,877.6 ± 8.4 m/sec at the baseline, 3,777.3 ± 9.6 m/sec at the second follow up).

DISCUSSION

This prospective study was conducted to identify the effect of dairy products, milk and yogurt on osteoporosis risk in Korean postmenopausal women. Generally, several nutrients and dietary components such as calcium, vitamin D, protein and dairy products are known to promote the development of peak bone mass [2728]. Also, adequate calcium intake through milk and dairy products is an important protective factor against bone resorption [29] and bioactive components present in milk and dairy products may play an essential role in bone metabolism [30].
In the present study, dairy products, milk and yogurt intakes had a positive effect only on the radius not on the tibia. The Finnish study reported that high calcium intake was positively associated with non-weight bearing radius but not with weight bearing tibia in young and elderly women [31]. Another study also suggested a positive association between calcium intake and the width and estimated bone strength in the radius [32]. It seemed that non-weight bearing radius benefitted from high intake of calcium, whereas the weight bearing bone benefited from physical activity. In our study population, physical activity had no effect on radius or tibia osteoporosis (data not shown).
Although, the intakes of milk and dairy products did not show a preventive effect on tibia osteoporosis, the SOS value of the tibia was higher with the highest frequency in the dairy products group. Durosier-Izart et al. [8] reported the dairy protein intakes were positively associated with the distal radius and tibia, predicted bone failure load and stiffness in healthy postmenopausal women. In order to obtain a significant osteoporosis risk of the tibia, more subjects, a longer follow-up period, with higher dairy intake levels as compared with this study are needed.
In Korea, several cross-sectional studies reported that high intake of dairy products prevents osteoporosis or osteopenia in Korea [1213141516]. The postmenopausal women who consumed dairy products more than once a day have a lower risk of osteopenia than those who consume 2–3 times a month (OR = 0.73; 95% CI: 0.57–0.94) [13]. The higher frequency of dairy products is associated with low prevalence of osteoporosis in postmenopausal women (Q1 vs. Q4, OR = 0.40; 95% CI: 0.21–0.75) [12]. The osteoporosis risk was 0.71 (95% CI: 0.53–0.96) in those who consumed milk or dairy products > 1 portion/day, compared with those who had zero intakes of milk or dairy products in the 2008–2009 Korean National Health and Nutrition Examination Survey [14]. The osteoporosis risk for milk intake frequency (≥ 1 serving/day) compared to intake frequency less than one serving/day was 0.36 (95% CI: 0.21–0.62) in middle-aged Korean women [15].
Nevertheless, the relationship between dietary milk intake and bone fracture is a controversial issue. In a Swedish cohort study, women who consumed more than three glasses of milk a day reported a 1.6 fold increased risk of hip fracture compared to women who consumed less than a glass of milk a day [6]. On the other hand, the original Framingham cohort participants with medium (> 1 and < 7 servings/week) or higher (≥ 7 servings/week) milk intake compared with those with low (≤ 1 serving/week) intake had 40% lower risk of hip fracture (P = 0.061) [33]. In a 10-year follow up Chinese cohort study, the calcium intake < 400 mg/day was one of the independent risk factors of osteoporotic fractures in postmenopausal women [34].
This study has several strengths. First, it was planned to examine the causal relationship between dairy products and osteoporosis incidence risk using prospective cohort data in postmenopausal women. Second, the dairy products and milk consumptions were estimated using a validated SQFFQ. This SQFFQ collected dietary consumption for more than 1 year, therefore, reflecting more towards long-term dietary effect than the 24-hr recall method.
Also, this current study has several limitations. First, the follow-up period was 4 years, which is relatively short because bone characteristics cannot be measured until the next follow up study. Second, we measured the SOS value rather than the bone mineral density, and therefore the results were not directly compared using dual-energy X-ray absorptiometry (DEXA). As prior studies revealed a high correlation between QUS and DEXA values for radius and tibia [3536]. Therefore, QUS values might be acceptable for the present study.
In conclusion, the present findings suggest that daily intake of dairy products may prevent the risk of radius osteoporosis in Korean menopausal women. Thus, it is necessary to propose a practical guideline to increase the consumption of milk and dairy products to suppress the osteoporosis risk in postmenopausal women.

Notes

This study was supported by Korea Food Research Institute (E0150302-04), Republic of Korea and “Cooperative Research Program for Agriculture Science and Technology Development (Project No. PJ0138102018)“, Rural Development Administration, Republic of Korea.

CONFLICT OF INTEREST: The authors declare no potential conflicts of interests.

References

1. Cummings SR, Melton LJ. Epidemiology and outcomes of osteoporotic fractures. Lancet. 2002; 359:1761–1767. PMID: 12049882.
crossref
2. Coughlan T, Dockery F. Osteoporosis and fracture risk in older people. Clin Med (Lond). 2014; 14:187–191. PMID: 24715132.
crossref
3. Rizzoli R. Dairy products, yogurts, and bone health. Am J Clin Nutr. 2014; 99:1256S–1262S. PMID: 24695889.
crossref
4. Cumming RG, Nevitt MC. Calcium for prevention of osteoporotic fractures in postmenopausal women. J Bone Miner Res. 1997; 12:1321–1329. PMID: 9286747.
crossref
5. Kanis JA, Johansson H, Oden A, De Laet C, Johnell O, Eisman JA, Mc Closkey E, Mellstrom D, Pols H, Reeve J, Silman A, Tenenhouse A. A meta-analysis of milk intake and fracture risk: low utility for case finding. Osteoporos Int. 2005; 16:799–804. PMID: 15502959.
crossref
6. Michaëlsson K, Wolk A, Langenskiöld S, Basu S, Warensjö Lemming E, Melhus H, Byberg L. Milk intake and risk of mortality and fractures in women and men: cohort studies. BMJ. 2014; 349:g6015. PMID: 25352269.
crossref
7. Włodarek D, Głąbska D, Kołota A, Adamczyk P, Czekajło A, Grzeszczak W, Drozdzowska B, Pluskiewicz W. Calcium intake and osteoporosis: the influence of calcium intake from dairy products on hip bone mineral density and fracture incidence - a populationbased study in women over 55 years of age. Public Health Nutr. 2014; 17:383–389. PMID: 23217270.
crossref
8. Durosier-Izart C, Biver E, Merminod F, van Rietbergen B, Chevalley T, Herrmann FR, Ferrari SL, Rizzoli R. Peripheral skeleton bone strength is positively correlated with total and dairy protein intakes in healthy postmenopausal women. Am J Clin Nutr. 2017; 105:513–525. PMID: 28077378.
crossref
9. Korea Health Industry Development Institute (KHIDI). National Food & Nutrition Statistics 2013: based on 2013 Korea National Health and Nutrition Examination Survey [Internet]. Cheongju: Korea Health Industry Development Institute;2015. cited 2018 January 10. Available from: https://www.khidi.or.kr/.
10. Ministry of Health and Welfare, Korea Centers for Disease Control and Prevention. Korea Health Statistics 2010: Korean National Health & Nutrition Examination Survey. Seoul: Korea Centers for Disease Control and Prevention;2010.
11. Wright NC, Looker AC, Saag KG, Curtis JR, Delzell ES, Randall S, Dawson-Hughes B. The recent prevalence of osteoporosis and low bone mass in the United States based on bone mineral density at the femoral neck or lumbar spine. J Bone Miner Res. 2014; 29:2520–2526. PMID: 24771492.
crossref
12. Lim YS, Lee SW, Tserendejid Z, Jeong SY, Go G, Park HR. Prevalence of osteoporosis according to nutrient and food group intake levels in Korean postmenopausal women: using the 2010 Korea National Health and Nutrition Examination Survey Data. Nutr Res Pract. 2015; 9:539–546. PMID: 26425285.
crossref
13. Shin A, Lim S, Sung J, Myung S, Kim J. Dietary habit and bone mineral density in Korean postmenopausal women. Osteoporos Int. 2010; 21:947–955. PMID: 19727908.
crossref
14. Hong H, Kim EK, Lee JS. Effects of calcium intake, milk and dairy product intake, and blood vitamin D level on osteoporosis risk in Korean adults: analysis of the 2008 and 2009 Korea National Health and Nutrition Examination Survey. Nutr Res Pract. 2013; 7:409–417. PMID: 24133621.
crossref
15. Baek SW, Lee HO, Kim HJ, Won ES, Ha YS, Shin YK, Om AS. Relationship between intake of milk and milk products and bone health by sex and age-group in Koreans using data from the Korea National Health and Nutrition Examination Survey 2008~2011. J Korean Soc Food Sci Nutr. 2017; 46:513–522.
16. Seo HB, Choi YS. Sex- and age group-specific associations between intakes of dairy foods and pulses and bone health in Koreans aged 50 years and older: based on 2008~2011 Korea National Health and Nutrition Examination Survey. J Nutr Health. 2016; 49:165–178.
crossref
17. Kim Y, Han BG. KoGES group. Cohort profile: The Korean Genome and Epidemiology Study (KoGES) consortium. Int J Epidemiol. 2017; 46:e20. PMID: 27085081.
crossref
18. McCrory MA, McCrory MA, Hajduk CL, Roberts SB. Procedures for screening out inaccurate reports of dietary energy intake. Public Health Nutr. 2002; 5:873–882. PMID: 12633510.
crossref
19. Ahn Y, Lee JE, Cho NH, Shin C, Park C, Oh BS, Kimm K. Validation and calibration of semi-quantitative food frequency questionnaire: with participants of the Korean Health and Genome Study. Korean J Community Nutr. 2004; 9:173–182.
20. Ahn Y, Kwon E, Shim JE, Park MK, Joo Y, Kimm K, Park C, Kim DH. Validation and reproducibility of food frequency questionnaire for Korean genome epidemiologic study. Eur J Clin Nutr. 2007; 61:1435–1441. PMID: 17299477.
crossref
21. The Korean Nutrition Society. Recommended Dietary Allowances for Koreans. 7th revision. Seoul: The Korean Nutrition Society;2000.
22. Damilakis J, Papadokostakis G, Vrahoriti H, Tsagaraki I, Perisinakis K, Hadjipavlou A, Gourtsoyiannis N. Ultrasound velocity through the cortex of phalanges, radius, and tibia in normal and osteoporotic postmenopausal women using a new multisite quantitative ultrasound device. Invest Radiol. 2003; 38:207–211. PMID: 12649644.
crossref
23. Chong KH, Poh BK, Jamil NA, Kamaruddin NA, Deurenberg P. Radial quantitative ultrasound and dual energy x-ray absorptiometry: intermethod agreement for bone status assessment in children. Biomed Res Int. 2015; 2015:232876. PMID: 25922831.
crossref
24. Pisani P, Renna MD, Conversano F, Casciaro E, Muratore M, Quarta E, Paola MD, Casciaro S. Screening and early diagnosis of osteoporosis through x-ray and ultrasound based techniques. World J Radiol. 2013; 5:398–410. PMID: 24349644.
25. Hans D, Genton L, Allaoua S, Pichard C, Slosman DO. Hip fracture discrimination study: QUS of the radius and the calcaneum. J Clin Densitom. 2003; 6:163–172. PMID: 12794239.
26. Assessment of fracture risk and its application to screening for postmenopausal osteoporosis. Report of a WHO Study Group. World Health Organ Tech Rep Ser. 1994; 843:1–129. PMID: 7941614.
27. Cashman KD. Diet, nutrition, and bone health. J Nutr. 2007; 137:2507S–2512S. PMID: 17951494.
crossref
28. Weaver CM. The role of nutrition on optimizing peak bone mass. Asia Pac J Clin Nutr. 2008; 17(Suppl 1):135–137. PMID: 18296321.
29. Renner E. Dairy calcium, bone metabolism, and prevention of osteoporosis. J Dairy Sci. 1994; 77:3498–3505. PMID: 7699131.
crossref
30. Caroli A, Poli A, Ricotta D, Banfi G, Cocchi D. Invited review: dairy intake and bone health: a viewpoint from the state of the art. J Dairy Sci. 2011; 94:5249–5262. PMID: 22032348.
crossref
31. Uusi-Rasi K, Sievänen H, Pasanen M, Oja P, Vuori I. Associations of calcium intake and physical activity with bone density and size in premenopausal and postmenopausal women: a peripheral quantitative computed tomography study. J Bone Miner Res. 2002; 17:544–552. PMID: 11874246.
crossref
32. Uusi-Rasi K, Sievänen H, Vuori I, Pasanen M, Heinonen A, Oja P. Associations of physical activity and calcium intake with bone mass and size in healthy women at different ages. J Bone Miner Res. 1998; 13:133–142. PMID: 9443799.
crossref
33. Sahni S, Mangano KM, Tucker KL, Kiel DP, Casey VA, Hannan MT. Protective association of milk intake on the risk of hip fracture: results from the Framingham Original Cohort. J Bone Miner Res. 2014; 29:1756–1762. PMID: 24760749.
crossref
34. Kung AW, Lee KK, Ho AY, Tang G, Luk KD. Ten-year risk of osteoporotic fractures in postmenopausal Chinese women according to clinical risk factors and BMD T-scores: a prospective study. J Bone Miner Res. 2007; 22:1080–1087. PMID: 17371165.
crossref
35. Chen T, Chen PJ, Fung CS, Lin CJ, Yao WJ. Quantitative assessment of osteoporosis from the tibia shaft by ultrasound techniques. Med Eng Phys. 2004; 26:141–145. PMID: 15036181.
crossref
36. Hung VW, Qin L, Au SK, Choy WY, Leung KS, Leung PC, Cheng JC. Correlations of calcaneal QUS with pQCT measurements at distal tibia and non-weight-bearing distal radius. J Bone Miner Metab. 2004; 22:486–490. PMID: 15316870.
crossref
Table 1

Baseline characteristics according to radius and tibia osteoporosis among Korean postmenopausal women

nrp-12-436-i001

BMI: body mass index

1)t-test was used continuous variables and χ2 test for categorical variables.

2)Means ± SE

Table 2

Age-adjusted and multivariable-adjusted HRs and 95% CIs for osteoporosis according to the intake frequency of dairy products, milk and yogurt using semi-quantitative food frequency questionnaire in Korean postmenopausal women

nrp-12-436-i002

HR, hazard ratio; CI, confidence interval.

Multivariate models were adjusted for age (continuous), body mass index (continuous), residual area (rural, urban), education level (elementary school, middle school, high school, college or higher degree), income status (< $ 500/month, $ 500/month–$ 1,500/month, ≥ $ 1,500/month), smoking (non/ex-smoker, current smoker), drinking (non/ex-drinker, current drinker), exercise (yes, no), and total energy intake (continuous).

Table 3

Value of bone speed of sound (SOS, m/sec) according to the intake frequency of dairy products, milk and yogurt intake using a semi-quantitative food frequency questionnaire in Korean postmenopausal women

nrp-12-436-i003

SOS, speed of sound; ANCOVA, analysis of covariance.

1)Mean values are significantly different according to the frequency of dairy products, milk and yogurt intake by ANCOVA adjusted for age.

2)Mean values are significantly different according to the frequency of dairy products, milk and yogurt intake by ANCOVA adjusted for age and baseline bone SOS.

3)Different superscripts within a column are significantly different from Duncan's multiple range test (P < 0.05).

TOOLS
Similar articles