

 PDF
PDF ePub
ePub Citation
 Print
Print


INTRODUCTION
In 2014, 462 million adults worldwide were categorized as underweight, while 1.9 billion were considered overweight, and more than 600 million obese. In addition, one of the nutritional deficiencies, iron-deficiency anemia was reported in 264 million pregnant women [1]. From 1975 to 2014, an analysis of adult body mass index (BMI) trends in more than 200 countries revealed a decrease in the underweight population from 13.8% for men and 14.6% for women in 1975 to 8.8% for men and 9.7% for women in 2014. However, the trend in obesity from 1975 increased from 3.2% in men and 6.4% in women to 10.8% and 14.9%, respectively, in 2014. The resultant increase in the rate of obesity was more significant than the reduction in rate of the underweight population, which was evident in developing countries [2]. As the economic structure of developing countries changed from agricultural to the industrial base, there was rapid evolution in the urbanization and modernization of lifestyle, and nutrition transition altered rapidly due to physical activity and diet. However, undernutrition is still prevalent and obesity became rampant due to over-nutrition [34]. This phenomenon of malnutrition and nutritional overcrowding is called the ‘double burden of malnutrition (DBM)’ in a country, community, and home, which is a problem faced worldwide [5].
In addition, the spread of non-communicable diseases (NCDs) became a global problem, and Indonesia also suffered from a double burden in the healthcare sector, such as obesity, thereby adversely affecting the national economy and productivity [6]. This nutritional burden is an important drawback in developing and middle-income countries. Usfar et al. [3] indicated that the rapid onset of obesity leaves a gap in primarily policies, which remain largely focused on tackling undernutrition. Indonesia is a developing country that has changed its economy from an agricultural base to an industrial base, and this economic change has resulted in a decrease in the physical activity and a change in diet of the population. Therefore, the prevalent disease trend altered from infectious disease to metabolic disease [78].
The Indonesia Health Profile 2013 [6] states that the nutritional status of adults over 18 years of age can be determined by the prevalence of malnutrition based on indicators of BMI. Reports indicate that the nutritional status of adults aged over 18 years is dominated by obesity, although underweight incidences were still quite high. The Basic Health Research (RISKESDAS) 2013 showed that the prevalence of obesity in the adult group was 26.23%, whereas underweight adults accounted for 11.09%. The prevalence of obesity adult men was 19.7% and adult women was 32.0%, increasing up to 18.1% from 2007 (13.9%) [9]. The average overweight ratio was relatively high in both men and women in the age group 35–49 years, about one-third of the women and one-fifth of men in this age group were diagnosed as overweight [6].
Shrimpton & Rokx (2013) conducted a study on DBM in Indonesia spanning more than 15 years, including data from 1993, 1997, 2000, and 2007 published by the Indonesia Family Life Survey. They found that the proportion of thin men and women (BMI < 18.5 kg/m2) considerably decreased over the years, whereas the proportion of fat men and women (BMI > 25 kg/m2) had almost doubled [10]. The National Household Health Survey (SURKESNAS) in Indonesia reported cardiovascular disease to be the leading cause of death in Indonesia [11], and the 2010 National Health Survey in Indonesia found that such total deaths from NCDs accounted for 71% of the total mortality rate [10].
Diet is the fundamental element affecting the health status. Personal diet is influenced by various factors such as age, occupation, education and economic level, family status and residence [12]. Indonesia is the fourth most populous country in the world, with more than 250 million people. It has diverse cultures with different races and religions [13]. Therefore, Indonesian cuisine varies greatly by region and has experienced many different effects [14]. Although the food consumed varies from region to region, the staple diet includes steamed rice, surrounded by vegetables and soup, and side dishes of meat or fish. According to the Ministry of Health (Indonesia) [15], it is recommended that people should eat various foods and consume all the staple food, side dishes, vegetables, fruits, and water for every meal. Also, high protein should be consumed regularly. Furthermore, the Ministry of Health also recommends enough intake of fruits and vegetables for various vitamins, minerals and dietary fiber, and suggests an adult daily fruit intake of 400–600 g based on WHO recommendations [16].
In reality, many Indonesian cultures did not recognize overweight was a social problem, but in fact was presented a high social status. Also, there was little awareness regarding DBM among government policymakers [3]. The present study was therefore conducted to investigate DBM with regards to the coexistence of malnutrition and over-nutrition in Indonesian adults. This study confirms the existence of DBM and investigates the dietary factors related to the DBM in Indonesian adults.
SUBJECTS AND METHODS
Study subjects
This study was conducted after receiving the approval of PNU IRB/2017_71_HR from the Pusan National University institutional review board. Malang, the survey area, is the second largest and most populous city in East Java [17]. Malang has experienced rapid economic growth of 5.61% in 2016 [18]. This rapid economic growth is due to changes in the structure of the industry from agriculture such as farming of cane and vegetables to tourism, trade, and Small and medium enterprises [1819]. The residents seemed to go through rapid changes in dietary intakes. Therefore, it is thought that this area is suitable for this research topic of DBM.
A total of 140 adults in Malang were assessed using a questionnaire. Researchers noticed the research poster called for participants in various places such as the village hall, the market, and the company. And they explained the contents of this study and conducted the research with consent. The survey was conducted from July 17 to August 14, 2017. The questionnaire included details of gender, age, tribes, education level, occupation, and monthly income of the subjects.
Anthropometric measurement
For accurate data, the following anthropometric status were measured: height (Seca 213 portable height measure, Seca gmbh & Co. kg, Hamburg, Germany), body weight [Omron body composition monitor HBF-214-W, Krell precision (Yangzhou) Co., Ltd., China], and waist and hip circumference (Seca 203 ergonomic circumference measuring tape with extra waist-to-hip ratio, Seca gmbh & Co. kg, Hamburg, Germany). BMI was classified as ‘underweight (BMI < 18.5 kg/m2)’, ‘normal weight (18.5 ≤ BMI < 23.0 kg/m2)’, ‘overweight (23.0 ≤ BMI < 25.0 kg/m2)’, and ‘obesity (25.0 kg/m2 ≤ BMI)’ as recommended for the Asia-Pacific region of the WHO [20]. The waist circumference was determined to be obesity over 90 cm for men and over 80 cm for women, as per the Asian standards of the International Diabetes Federation [21]. The waist-to-hip ratio (WHR) were considered to be obesity 0.90 for men and 0.85 for women, as per the guidelines for South Asians [22]. In addition, waist-to-height (WHtR) was classified by obesity 0.51 or more for men and 0.53 or more for women, as per the guidelines for Asians [2324].
Dietary intakes assessment
To assess the states of dietary intake, we used the 24-hours recall method. ‘Meal balance’ [food group score (FGS)], ‘dietary diversity’ (total number of foods consumed during one day), and ‘meal frequency’ (number of meals consumed per day) were evaluated. Based on previous studies [252627], the balanced nutrition guideline of the Ministry of Health (Indonesia) [28], and the 2010 research report of Susiloretni & Sunarto [15], the food groups consumed by the subjects were divided into six groups: staple food, animal foods, milks, legumes, vegetables, and fruits. Based on the recommended amount of energy by varying age groups [15], the each FGS score of the six food group rated on a scale of 0–10 points respectively. If subject intakes food like staple food, animal food, and legumes by ‘one serving size of recommended intake ± 10%’, then we counted 10 points. But if they eat ‘one serving size of recommended intake 200% more’ or ‘nothing’, then we assigned 0 points. Concerning the fruit, vegetable, and milk groups, if subject intakes food ‘one serving size of recommended intake ± 10%’, we counted 10 points. But if they did not have any intake, we assigned 0 point. And if intakes on a scale of 0 to 10 points were got proportional score [2528]. ‘Dietary diversity’ was the sum number of all the foods consumed during the day, and 1 point was added to each new diversity of food consumed [26]. All foods made with other recipes were counted as one food if the ingredients used were the same. The evaluation of ‘meal frequency’ was counted by the number of meals consumed in a day.
Health status
To assess the individual health status, hemoglobin concentration (BeneCheck, General Life Biotechnology Co., Ltd., New Taipei, Taiwan), blood pressure (Omron automatic blood pressure monitor HEM-7121, Omron Healthcare manufacturing Vietnam Co., Ltd., Vietnam), blood glucose (ACCU-CHEK ACTIVE blood glucose monitor, Korea Roche Diagnostics Co., Mannheim, Germany), and total cholesterol (BeneCheck 2in1, General Life Biotechnology Co., Ltd., New Taipei, Taiwan) were measured. Anemia was defined as hemoglobin concentration less than 13 g/dL for men and 12 g/dL for women, as recommended by WHO [293031]. Blood pressure was diagnosed based on the Asia-Pacific region standards of WHO, and was classified as pre-hypertension (120 ≤ systolic blood pressure (SBP) < 140 or 80 ≤ diastolic blood pressure (DBP) < 90 mmHg) and hypertension (140 mmHg ≤ SBP or 90 mmHg ≤ DBP) [32]. Subjects were divided into two groups based on their blood glucose concentration: ‘fasting blood glucose (FBG)’ and ‘postprandial blood glucose (PBG)’, depending on whether the fasting state was maintained for 12 hours during the measurement of blood glucose. Fasting blood glucose and postprandial blood glucose concentrations were diagnosed based on the definition released by International diabetes federation and WHO as pre-diabetes (100–126 mg/dL, 200–240 mg/dL) and diabetes (126 ≤ mg/dL, 240 ≤ mg/dL) [13]. Total cholesterol concentration was diagnosed and classified based on the definition released by National Heart Lung and Blood Institute (NHLBI) as pre-hypercholesterolemia (200-240 mg/dL) and hypercholesterolemia (240 ≤ mg/dL) [33].
Categories of DBM and chronic diseases
DBM is characterized by the coexistence of undernutrition along with overweight, obesity or diet-related NCDs, within individuals, households and populations, and across the lifecourse [136]. According to the WHO, it occurs at the individual level through the simultaneous development of two or more types of malnutrition - for example, obesity with nutritional anemia or any vitamin/mineral deficiencies or insufficiencies [1]. In this study, it categorized by the presence of overweight/obesity by BMI and iron-deficiency anemia. And the chronic diseases were included abdominal obesity, hypertension, diabetes, hypercholesterolemia.
Statistical analysis
All data in this study were analyzed using the IBM SPSS Statistics 22.0 program (SPSS Inc., Chicago, IL, USA). The data were analyzed by frequency analysis, independent t-test, one-way analysis of variance, chi-square test, logistic regression analysis, multiple regression analysis. P values of less than 0.05 indicated statistical significance. The general characteristics of the subjects, dietary intakes, and health status were expressed as mean ± SD or number (%).
RESULTS
General characteristics
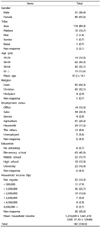
The general characteristics and socio-economic status of the subjects are presented in Table 1. A total of 140 subjects included 51 men and 89 women, with an average age of 47.2 years. Of these, 84.3% belonged to the Java tribe and 10.7% to the Madura tribe. The religions encompassed ‘Muslim’ 64.3%, ‘Christianity’ 32.1% and ‘Hinduism’ 2.9%. Agriculture was the most occupation (29.3%), followed by commerce (24.3%) such as merchants and street vendors. Most (45.0%) of both genders were elementary school graduates. The average monthly income of the subjects was 1,218,699 Rupiah (Rp). Considering that the US $ 1 is 13,327 Rp based on the Central Bank of Indonesia in 2017 [34], this amounted to about US $ 91.45.
Anthropometric status assessment
The anthropometric status of the subjects are presented in Table 2. The average height, weight, and BMI of men were 160.08 cm, 62.62 kg, and 25.45 kg/m2, respectively, and of the women were 148.74 cm, 58.09 kg, and 26.21 kg/m2, respectively. Overweight and obesity men were 27.5%, and 31.4%, respectively, and women were 22.5% and 57.3%, respectively. The waist circumference of men and women were 84 cm and 81.39 cm, respectively. The hip circumference of men and women were 96.04 cm and 98.04 cm, respectively. There was no significant difference by gender in waist circumference. However, mean waist circumference of women was in obesity (81.39 cm), compared with being normal in men. WHR was 0.88 for men and 0.83 for women (P < 0.001). In particular, the WHtR, adjusted for gender and race differences in WHR, was 0.53 for men and 0.55 for women, both men and women were obese.
Dietary intake status
The resulting of the analysis of ‘meal balance,’ ‘dietary diversity,’ and ‘meal frequency’ are presented in Table 3. According to the amount of food recommended by the Ministry of Health (Indonesia), the total score of meal balance were 18.69/60.00 points for men and 20.43/60.00 points for women. Both of them are very poor. Furthermore, the scores obtained from staple food and legumes were 7.73 and 4.22, respectively, whereas the scores for milk (0.25) and fruits (0.51) were very low. The average score for dietary diversity through the sum of the number of foods consumed during the day was meager (< 5). Meal frequency score through the number of meals consumed during the day was 2.56, indicating a lack of meal frequency.
Assessment and comparison based on age revealed meal balance score to be significantly lower in animal foods and higher in milk in the ‘≥ 65 years’ group than those of other age groups (Table 4, P < 0.05). The dietary diversity score was significantly lower in the ‘≥ 65 years’ group than in other age groups (19–29, 50–64 years, P < 0.05).
Health status
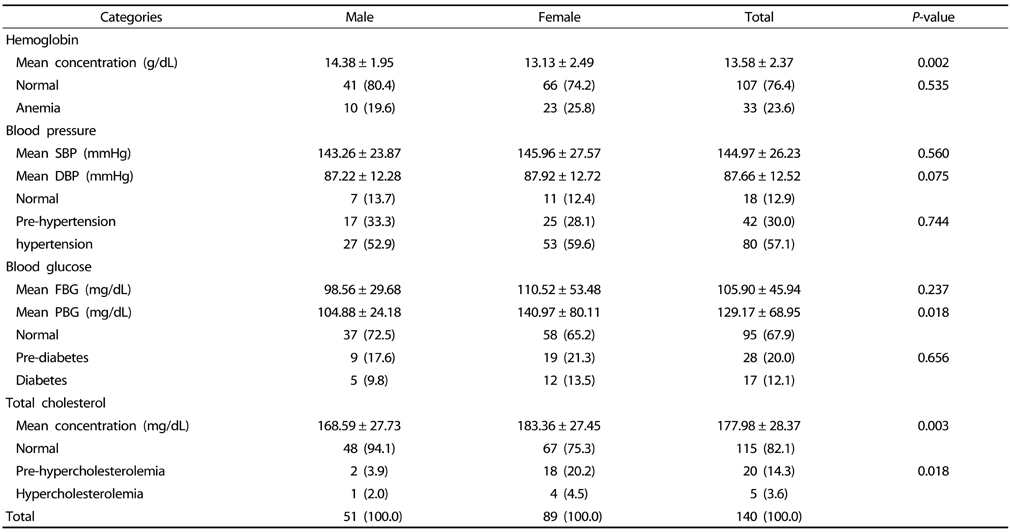
Health status of the subjects are shown in Table 5. Mean hemoglobin concentration of the subjects was 14.38 g/dL for men and 13.13 g/dL for women (P < 0.01). The occurrence of anemia was high among the subjects (23.6%). Mean blood pressure of subjects was 144.97/87.66 mmHg, and rate of hypertension was 57.1%. Mean blood glucose concentration was 105.90 mg/dL (FBG), 129.17 mg/dL (PBG), and rate of diabetes was 12.1%. Total cholesterol concentration was 168.59 mg/dL for men and 183.36 mg/dL for women, the mean concentration of women was significantly higher than men (P < 0.01). The rate of hypercholesterolemia was 3.6%.
DBM
Table 6 shows the prevalence of DBM by gender. Of the subjects, DBM was 16.4%. The proportion of women with DBM was significantly higher than that of men (P < 0.05).
Table 7 shows the odds ratio for DBM according to dietary intake status by logistic regression analysis. The odds ratio for DBM significantly increased by 1.323 times (95% CI, 1.041–1.680), according to vegetable intake in meal balance and decreased by 0.481 times (95% CI, 0.264–0.876), according to dietary diversity.
Chronic diseases
Table 8 shows the number of chronic diseases by gender, body type, and dietary intake status. The number of chronic diseases had significant differences between men and women (P < 0.01). The prevalence of chronic diseases was high in obesity subjects (P < 0.001). However, there was no significant difference between fair and poor with dietary intake. In particular, the women had more than three chronic diseases were 27.0%, that was higher 6.9 times than men (P < 0.01). The subjects who had three or more chronic diseases in overweight were 2.7 times higher than the normal group and were 4.5 times in obesity higher than the normal group (P < 0.001).
Table 9 shows the dietary factors affecting chronic diseases. Dietary diversity inversely changed to SBP (β = −0.284, P < 0.05), and presented a proportion of the variance by R2 = 0.078.
DISCUSSION
The purpose of this study was to investigate the existence of DBM and to find out how it was related to dietary intake status in Malang, Indonesia. Our study indicated that adults suffer from poor nutritional intakes and DBM of the coexistance malnutrition iron-deficiency anemia and overweight/obesity, and showed a high rate of chronic diseases.
In this study, the women with anemia were 25.8%. When compared to 32.8% of WHO's global anemia rate of women of reproductive age in 2016 [1], it was higher than our results. Our results of anemia were an average of all subjects, considering not only women of reproductive age but also including elderly women. It appears that the rate of anemia in Indonesia seems to vary greatly depending on the region or time. In other areas, the anemia rate was 8% in Medan, the capital of North Sumatra province, 65% in Lombok, an island in West Nusa Tenggara province, and Yogyakarta, the capital on the Java island [3536].
The RISKESDAS showed that the prevalence of malnutrition was stable, while the incidence of overweight has increased over the past few years [3738]. Judging the nutritional status of adults over 18 years old in Indonesia based on the BMI index in 2013, 11.09% of the population were underweight while 11.48% were overweight and 14.76% obesity; this indicates an increasing problem of obesity [7]. The results of this study showed that overweight and obesity populations were higher than the above data (24.3%, and 47.9%, respectively) while the underweight population was lower (3.6%).
Most of the lower-middle income countries (LMICs) are generally considered to be affected by the DBM, with overweight increasing rapidly than underweight decreasing [11]. The number of undernourished people in the world has declined since the early 2000s, but the decline rate was less than 20%. The rate of obesity is steadily increasing, especially accelerated in Asia [34]. The consequences of the DBM are important and evident across the life course [11].
This study revealed that most subjects had insufficient dietary intakes as well as an unbalanced diet. Notably, the diversity of food consumed was limited. This result may lead to the lack of diversity. The prevalence of DBM increased as the dietary diversity decreased. Considering as meal balance, intake of staple food and legumes was relatively high. On the other hand, the consumption of animal food, milk and fruits was significantly low (Table 7). It is considered that staple food-dominated dietary intake affected the iron-deficiency anemia and overweight/obesity.
Similar to the results of this study, in a previous study of DBM in the household level of Malaysia, a higher dietary diversity for women was found to be associated with the risk of overweight and obesity [39]. Dietary diversity and DBM occurrence were inversely correlated. In addition, Dietary diversity inversely affected to SBP.
Sustaining good health in the elderly is a major challenge for public health. Inadequate dietary intake was associated with functional decline in the elderly. Nutrition plays vital role in protecting health problems and slowing disease progression [40]. This study found that animal foods intake was significantly inadequate in the ≥ 65 years age group. A previous study [40] had reported that protein intake was lower than that of the recommended value for elderly people. The primary source of protein consumed plant protein (grains) and fish. Since animal foods are known as expensive foods, there is a strong positive relationship between the level of income and the consumption of animal foods, such as meat, milk, and eggs [15].
The longer this DBM situation, the higher the risk for obesity and other dietary-related NCDs such as type 2 diabetes and cardiovascular disease. NCD is responsible for most of the world's deaths and is disproportionately high in LMIC where nearly 80% of NCD deaths occur [211].
In Indonesia, the mortality due to chronic diseases accounted for 71% of all deaths in 2016 [41]. Hence, managing the risk factors for chronic diseases could decrease the overall mortality rate of chronic diseases. Hypertension plays a crucial etiologic role in the pathogenesis of ischemic heart disease, heart and kidney failure, and is a major risk factor for mortality and disability rates worldwide [42].
The prevalence of hypertension in this study was 57.1%, which was higher than the national average. The national prevalence of hypertension in the population above 18 years old was 27.8% in 2008 [43]. Other studies reported the prevalence of hypertension to be 35% for men and 65% for women in Sumenep in 2006, a town on Madura Island, and 57.44% in East Jakarta in 2009, 49% in Jember in 2009, a city of East Java province, and 48% in Semarang in 2009, a city of Central Java, in women [15].
In this study, the prevalence of diabetes among men and women was not significantly different, but the diabetes country profiles of WHO in 2016, the number of women deaths due to diabetes in Indonesia over 30 years old was 1.73 times higher than that of men [41].
It appears that the rate of hypercholesterolemia in Indonesia seems to vary greatly depending on the region or time. Prevalence of hypercholesterolemia in the present study was 2.0% in men and 4.5% in women. On the other hand, the hypercholesterolemia rate was 47% in Padang in 2005, the capital of West Sumatra province, 16% in Surabaya in 2007, the capital of East Java province, and 15% in Padang in 2008 [15].
The incidence of having more than three chronic diseases in this study was higher in the overweight (2.7 times) and obesity (4.5 times) rather than the normal group. Similar to our results, an earlier study relating BMI and chronic diseases reported the risk of hypertension was 1.7 times and 1.8 times higher in the obese group I (25 ≤ BMI < 30 kg/m2) and II (30 ≤ BMI kg/m2) than in the normal group (18.5 ≤ BMI < 23 kg/m2). Also, they reported the risk of hypercholesterolemia was 1.5 times and 2.3 times higher in obese group I and II than in the normal group, respectively [44].
There was no significant difference between the dietary intake and the number of chronic diseases in this study. That is why the subjects had a very simple and limited dietary pattern. Participants ate such as high intake of staple food, low intake of fruits, dairy products, and animal foods. The overall dietary intake was very poor, which was also associated with the high prevalence of DBM and chronic diseases. Contradictorily, in other studies [4546] reported that dietary diversity score was inversely related to cardiovascular risk factors of the adults such as obesity, hypercholesterolemia, diabetes, hypertension, etc.
To resolve the problem on prevalence of DBM and chronic diseases, several studies have demonstrated that dietary diversity is positively associated with the measure of diversity quality or nutrient adequacy in adults [39]. It means that if the subjects might eat more diversity, regular, and balanced diets, the prevalence of diseases such as obesity and hypertension may be reduced. Inappropriate dietary choices and poor diet quality lead to DBM and chronic diseases. However, risk factors could be able to improve. Therefore, dietary diversity is very significant for the prevention and management of DBM and chronic diseases.
This study has several limitations. First, this study was surveyed of non-random sampling. The number of subjects recruited was as small as 140 people in total, and the gender ratio of the subjects was not equal (51 men and 89 women). Secondly, we investigated the food intake through the 24-hour recall method to analyze nutrition intakes. However, due to the absence of a nutrient intake analysis program and the lack of data, we were unable to interpret the nutrient intake of food consumed by the subjects. Thus, this study analyzed only the actual conditions such as meal balance, dietary diversity, and meal frequency. Therefore, a more detailed investigation and analysis are required in data about diverse subjects in the future. Third, this study is a result of Malang area so it is difficult to interpret it as the whole of Indonesia. Regardless of these limitations, to our knowledge, this is the first study in DBM of adults in Malang, Indonesia and future research on dietary intake by region and religion can help contribute to the prevention of DBM and health care about chronic diseases in Indonesian.
In conclusion, adults in Malang showed the DBM of coexistence of malnutrition like iron-deficiency anemia and overweight, and had various chronic diseases. Notably, the proportion of chronic diseases is high because of high intake of the energy-based nutrient (staple food) and low intake of other nutrient (animal foods, fruits, milk). If the subjects eat regularly balanced meals which were included various foods, it is believed that the prevalence of DBM and chronic diseases might be reduced.


 XML Download